The Economics and Statistics Division maintains archives of previous publications for accountability purposes, but makes no updates to keep these documents current with the latest data revisions from Statistics Canada. As a result, information in older documents may not be accurate. Please exercise caution when referring to older documents. For the latest information and historical data, please contact the individual listed to the right.
<--- Return to Archive
For additional information relating to this article, please contact:
February 24, 2023TOURISM SATELLITE ACCOUNT, 2019 Statistics Canada has updated the Provincial and Territorial Satellite Account, a measure of the size of provincial tourism as measured by expenditures, GDP and employment.
The Provincial and Territorial Tourism Satellite Account contains some important definitions. "Tourism industries" are industries which would cease to exist or would exist at significantly reduced levels of activity in the absence of tourism (e.g. air transportation, accommodation). "Tourism products" are those for which a significant part of their total demand comes from tourists. Tourism expenditures also include spending by tourists on other products that are not considered to be tourism products.
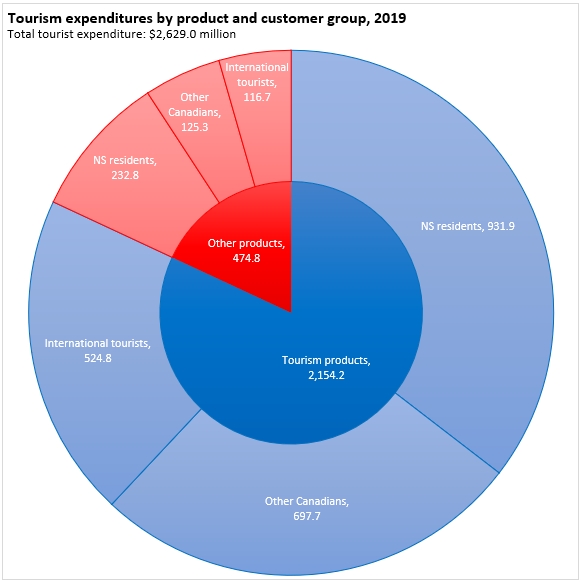
In Nova Scotia's latest Tourism Satellite Accounts for 2019, there was $2.629 billion in tourism expenditures in the province. Tourism products accounted for $2.1542 billion while other products purchased by tourists amounted to $474.8 million.
Nova Scotia residents spending within the province were the largest part of tourism expenditures. Domestic tourism expenditures were $1,164.7 billion in 2019: $931.9 million on tourism products along with $232.8 million on other products.
Visitors to Nova Scotia from other provinces spent $823.0 million in 2019: $697.7 million in tourism products and $125.3 million in other products.
International visitors to Nova Scotia made $641.5 million in tourism expenditures in 2019: $524.8 million in tourism products and $116.7 million in other products.
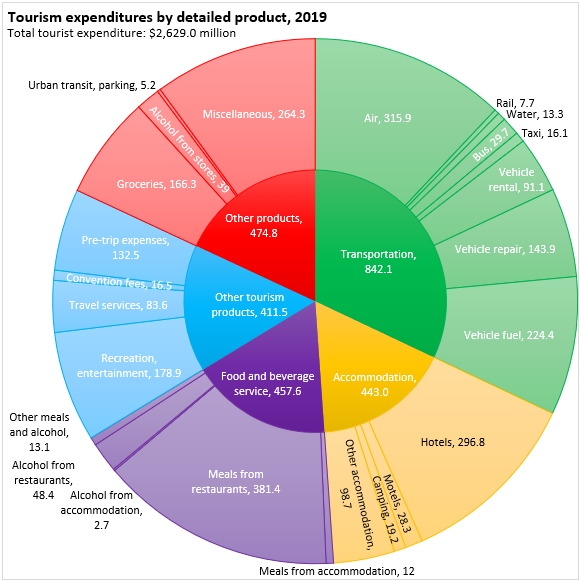
Tourism products can be broken down into four main categories: transportation, accommodations, food and beverage services and other tourism products. The largest parts of transportation expenditures were air travel as well as fuel, vehicle repair/parts and vehicle rentals. Hotels made up the largest part of accommodation expenditures while restaurants make up the bulk of food and beverage service expenditures. Recreation and entertainment spending was the largest tourism product category outside of transportation, accommodation and food/beverage services. Among specific tourism-related "other products", groceries were the largest individual item.
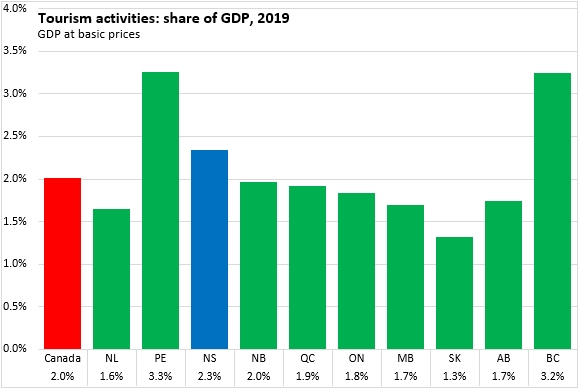
Tourism expenditures of $2,629.0 million generated Gross Domestic Product (GDP) of $998.1 million, which was 2.3% of Nova Scotia's total GDP in 2019. Across Canada, tourism GDP accounted for an average of 2.0% of GDP. Tourism share of GDP was highest in Prince Edward Island and British Columbia (followed by Nova Scotia). The lowest share of tourism in GDP was in Saskatchewan.
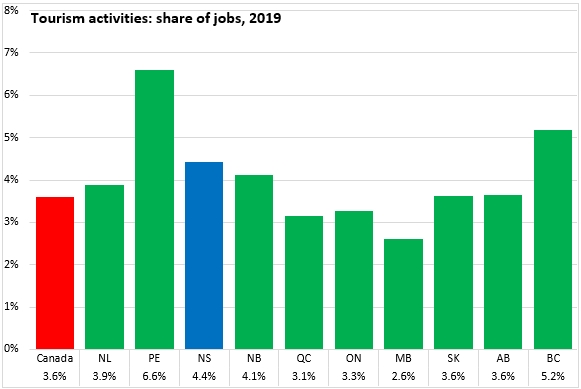
Tourism accounted 4.4% of total employment in 2019. This employment figure includes both full time and part time employment. Nationally, tourism accounted for 3.6% of employment. As with GDP, tourism had the highest portion employment in Prince Edward Island and British Columbia (followed by Nova Scotia). Tourism as a share of employment was lowest in Manitoba.
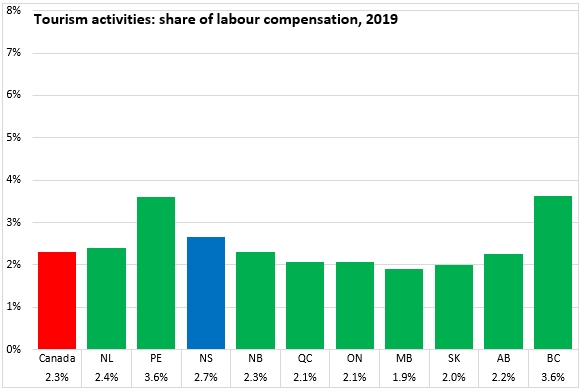
Tourism jobs accounted for 2.7% of Nova Scotia's labour income (third highest after Prince Edward Island anad British Columbia). Tourism generated 2.3% of national labour income.
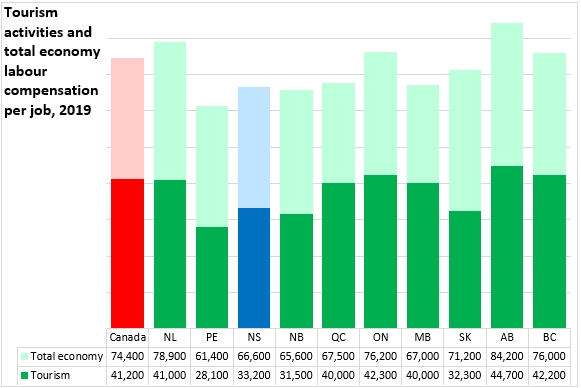
Part time and lower wage employment is more common in tourism industries than in the rest of the economy. Average labour income per tourism job was $33,200 in Nova Scotia, about 50% of the provincial average labour income per job.
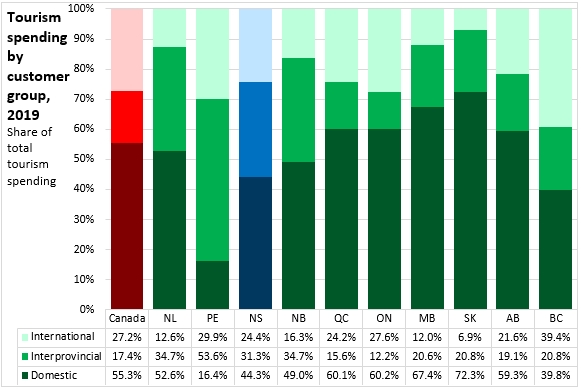
Domestic Demand (travel by residents from within a province) accounted for just under half of tourism product spending (44.3%), with the balance made up between interprovincial exports (visitors from another province in Canada: 31.3%) and international exports (visitors from another country: 24.4%).
The domestic share of tourism expenditures was highest in Saskatchewan. The lowest domestic share of tourism expenditure was in Prince Edward Island.
The interprovincial shares of tourism expenditures were highest in Prince Edward Island and lowest in Quebec and Ontario.
International share of tourism expenditure was highest in British Columbia and Prince Edward Island. The lowest shares of international expenditures in tourism were in Newfoundland and Labrador, Manitoba and Saskatchewan.
Looking at tourism expenditures by residents of each province, only Nova Scotia, Prince Edward Island and British Columbia reported more inbound tourism spending per capita than outbound tourism spending by residents.

Source: Statistics Canada. Table 24-10-0004-01 Provincial and territorial tourism supply and expenditure (x 1,000,000); Table 24-10-0042-01 Provincial and territorial gross domestic product (GDP) and employment generated by tourism and related measures (x 1,000,000); Table 24-10-0044-01 Interprovincial tourism expenditures (x 1,000,000)
<--- Return to Archive