The Economics and Statistics Division maintains archives of previous publications for accountability purposes, but makes no updates to keep these documents current with the latest data revisions from Statistics Canada. As a result, information in older documents may not be accurate. Please exercise caution when referring to older documents. For the latest information and historical data, please contact the individual listed to the right.
<--- Return to Archive
For additional information relating to this article, please contact:
February 28, 2023US S&P CORELOGIC CASE-SHILLER HOME PRICE INDICES, DECEMBER & ANNUAL 2022 S&P Dow Jones Indices today released data for the S&P CoreLogic Case-Shiller Home Price Indices for December 2022.
Month over Month (December 2022 vs November 2022, seasonally adjusted)
The Federal Reserve continues to increase their interest rates and as mortgages become more expensive, prices on resale homes are contracting. S&P Dow Jones Indices reports that US national house prices, as measured by the S&P CoreLogic Case - Shiller Indices fell by 0.3% from the previous month. The 20-city composite and 10-city composite average fell by 0.5% and 0.4% respectively.
Month-over-month housing prices fell for all 20 major urban centres. Phoenix, San Francisco, Seattle, Portland and Las Vegas reported the largest declines.
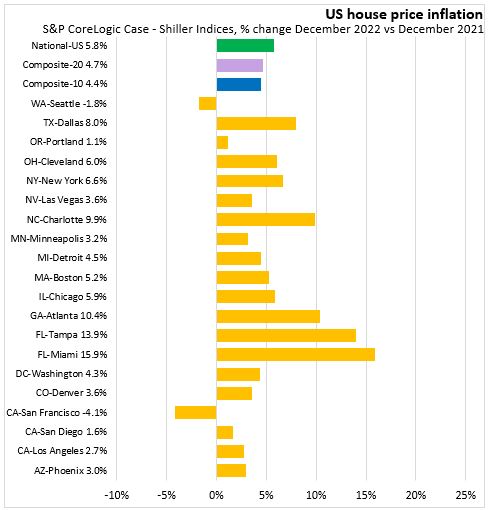
Year over year (December 2022 vs December 2021, seasonally adjusted)
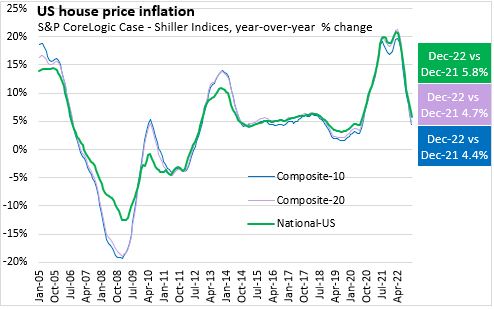
In the year over year comparison, National US house prices increased 5.8% in December 2022. The 20-city composite average rose by 4.7% while the 10-city composite rose by 4.4%. Housing prices were up for most major urban centres with the exception of San Francisco and Seattle. Miami, Tampa, and Atlanta reported the largest gains.
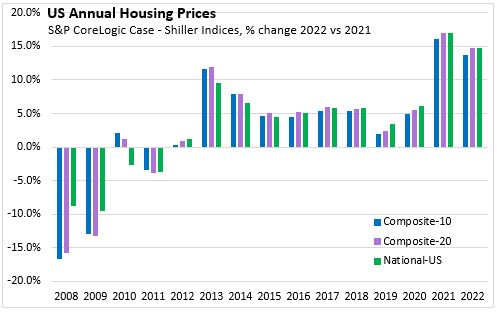
Annual (2022 vs 2021, seasonally adjusted)
US national house prices rose by 14.8% in 2022 compared to previous year. The 20-city composite average rose by 14.8% while the 10-city composite rose by 13.7%.
Housing prices were up for all 20 major urban centres. Tampa and Miami reported the largest gains. Minneapolis and Washington-DC reported the slowest growth.
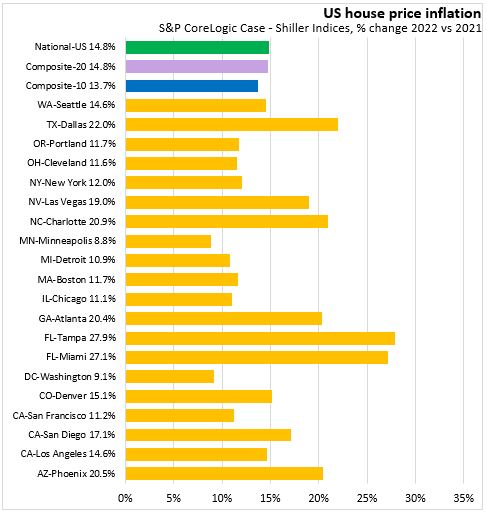
In 2022 price growth is still high, but slowing compared to 2021.
The 20-City Composite Index includes Atlanta, Boston, Charlotte, Chicago, Cleveland, Dallas, Denver, Detroit, Las Vegas, Los Angeles, Miami, Minneapolis, New York, Phoenix, Portland, San Diego, San Francisco, Seattle, Tampa, and Washington DC.
The 10-City Composite Index includes Boston, Chicago, Denver, Las Vegas, Los Angeles, Miami, New York, San Diego, San Francisco, and Washington DC.
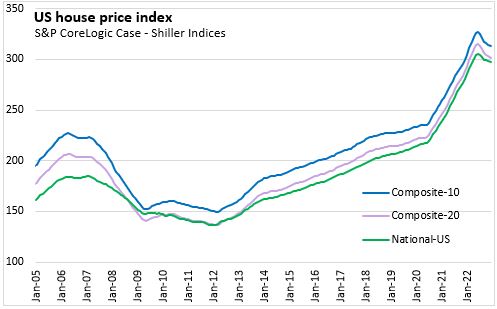
Trends and Comparisons
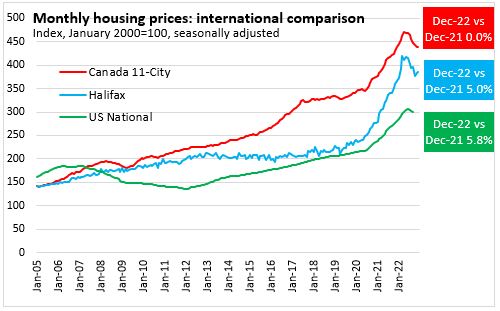
After bottoming out in 2012, US house prices grew at a steady pace up to 2020 before accelerating from summer 2020 to summer 2022. Canadian urban house price growth (measured by the Teranet-National Bank House Price Index) grew more rapidly starting in 2016 and accelerated again in 2020. However, in recent months, house price inflation in Canada has cooled more rapidly than in the US. Canada's 11-city composite house prices remined unchanged year-over-year in December 2022.
After a long period of slow growth, house prices in Halifax started to accelerate from 2019 until July 2022. Halifax year-over-year resale house price growth slowed to 5.0% in December 2022.
Source: S&P Dow Jones Indices, retrieved from FRED, Federal Reserve Bank of St. Louis
<--- Return to Archive