For additional information relating to this article, please contact:
September 21, 2018RETAIL TRADE, JULY 2018 Month-over month
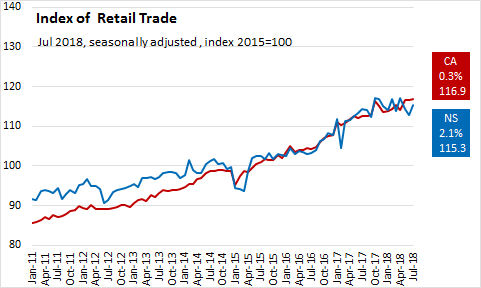
In Nova Scotia Jul 2018, seasonally adjusted Retail Trade increased 2.1% over Jun 2018 to $1.3 billion. Jul 2018 vs Jul 2017, seasonally adjusted Retail Trade increased 0.8%. Nationally, Jul 2018, seasonally adjusted Retail Trade increased 0.3% over Jun 2018 to $50.9 billion. Jul 2018 vs Jul 2017, seasonally adjusted Retail Trade increased 3.7%.
Canada and the Provinces
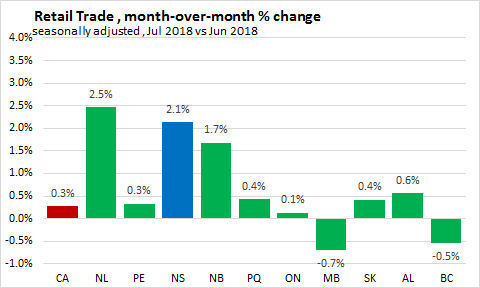
On a month over month basis, seasonally adjusted Retail Trade increased 0.3% nationally. Eight provinces reported monthly increases in retail trade, with Newfoundland and Labrador (2.5 %) reporting the largest gain. Nova Scotia reported an increase (2.1 %) over the previous month. Manitoba reported the largest decline (-0.7%).
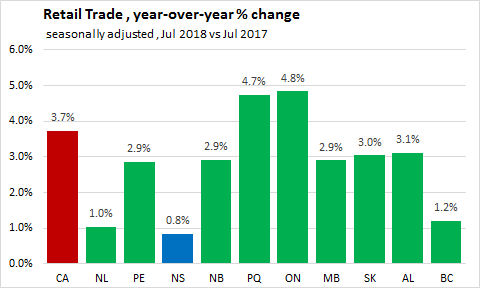
On a year over year basis, seasonally adjusted Retail Trade increased 3.7% nationally. Ten provinces reported year-over-year increases in retail trade, with Ontario (4.8 %) reporting the largest gain. Nova Scotia reported an increase (0.8 %) over the same month last year. Nova Scotia reported the smallest gain (0.8 %).
On a year to date basis, seasonally adjusted Retail Trade increased 3.4% nationally. Nine provinces reported year-over-year increases in retail trade, with Prince Edward Island (4.5 %) reporting the largest gain. Nova Scotia reported an increase (3.2 %) over the same period last year. Newfoundland and Labrador reported the largest decline (-1.3 %).

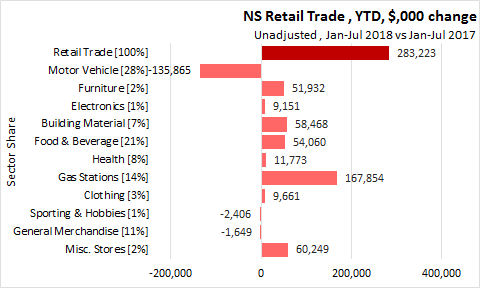
Nova Scotia Sectors
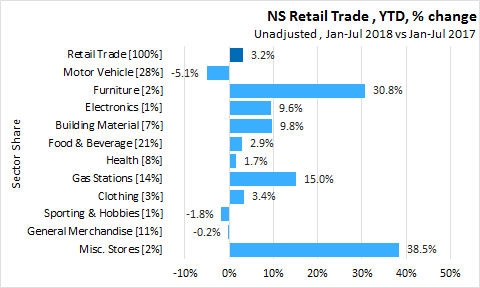
Unadjusted year-to-date (Jan-Jul 2018), Retail Trade increased 3.2% ($283.2 million) over Jan-Jul 2017 to $9,110.8 million.
- Motor Vehicle with a 28% share of Retail Trade decreased 5.1% (-$135.9 million).
- Furniture with a 2% share increased 30.8% ($51.9 million).
- Electronics with a 1% share increased 9.6% ($9.2 million).
- Building Material with a 7% share increased 9.8% ($58.5 million).
- Food & Beverage with a 21% share increased 2.9% ($54.1 million).
- Health with an 8% share increased 1.7% ($11.8 million).
- Gas Stations with a 14% share increased 15.0% ($167.9 million).
- Clothing with a 3% share increased 3.4% ($9.7 million).
- Sporting & Hobbies with a 1% share decreased 1.8% (-$2.4 million).
- General Merchandise with a 11% share decreased 0.2% (-$1.6 million).
- Misc. Stores with a 2% share increased 38.5% ($60.2 million).
QUOTES
"Widespread gains among most retail subsectors were behind the growth in Nova Scotia (+2.1%), where sales rose for the first time in three months", Statistics Canada Daily p. 2.
In Canada, "on an unadjusted basis, retail e-commerce sales totalled $1.3 billion, representing 2.5% of total retail trade. On a year-over-year basis, retail e-commerce rose 9.4%, while total unadjusted retail sales increased 3.8%.", Statistics Canada Daily, p.2.
REFERENCE
Source: Statistics Canada Tables 20-10-0008-01 and 20-10-0072-01