For additional information relating to this article, please contact:
December 13, 2018NEW HOUSING PRICE INDEX, OCTOBER 2018 The price of new housing in Nova Scotia declined 0.1 per cent month to month, to a level of 101.6 in October 2018. The national new housing price index was unchanged for the third consecutive month, remaining at 103.3.
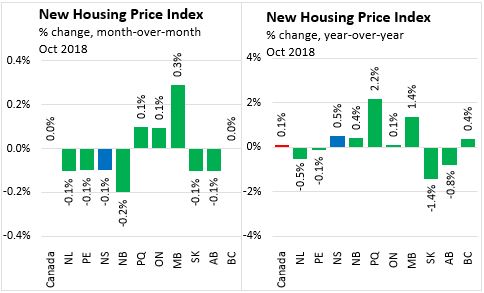
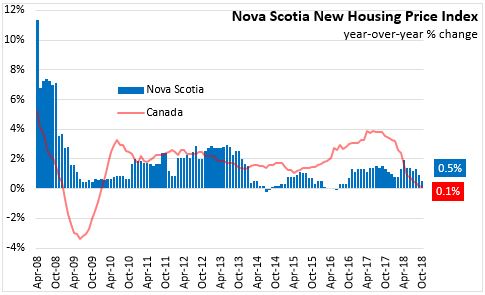
Nova Scotia new housing prices were 0.5 per cent higher than they were in October 2017. National housing prices were up 0.1 per cent as year-over-year house price growth continues to slow.
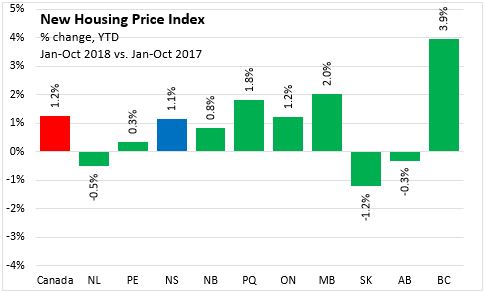
Year-to-date (January to October), Nova Scotia's new housing prices were up 1.1 per cent compared to the first ten months of 2017. National housing prices were up 1.2 per cent over 2017 in year to date terms. British Columbia saw the fastest growth (+3.9 per cent) while Saskatchewan, Alberta and Newfoundland and Labrador all reported lower new housing prices.
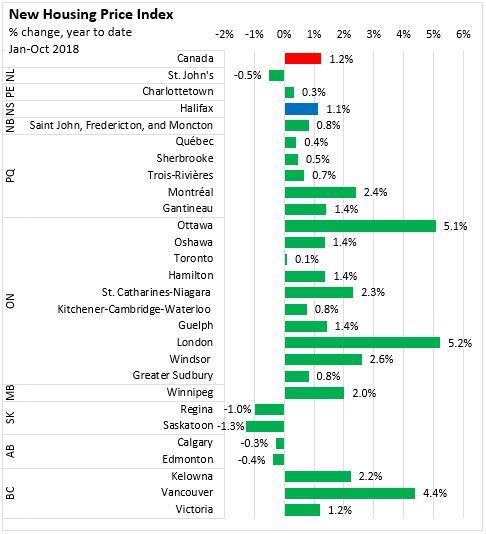
Census Metropolitan Areas
Comparing the first ten months of 2018 with the same period in 2017, price growth among Census Metropolitan Areas was fastest in London, Ottawa, and Vancouver. New housing prices have declined in St. John's, Regina, Saskatoon, Calgary and Edmonton.
Statistics Canada Note: With the release of the January 2017 NHPI data, a number of important changes have been introduced to increase the relevance of the index series. The index base period, for which the NHPI equals 100, is now December 2016. The NHPI basket has been updated with new weights for the 2017 series, its coverage has been expanded to include new CMAs.
Source Statistics Canada. Table 18-10-0205-01 New housing price index, monthly