For additional information relating to this article, please contact:
February 14, 2019MANUFACTURING SHIPMENTS, DECEMBER AND ANNUAL 2018 NOVA SCOTIA
Month-over-month
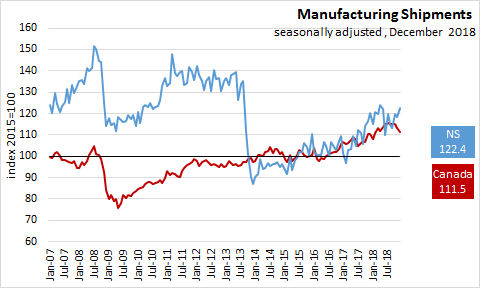
In Nova Scotia December 2018, seasonally adjusted Manufacturing Shipments increased 3.5% to $785.9 million over November 2018 and increased 1.9% over December 2017.
Annual
In Nova Scotia Jan-Dec 2018, seasonally adjusted Manufacturing Shipments increased 9.4% ($782.7 million) to $9.1 billion. Non-durable goods shipments, accounting for 70% of Manufacturing Shipments, increased 13.6% ($764.8 million) to $6.4 billion. Durable manufacturing, accounting for 30% of Manufacturing Shipments, increased 0.7% ($17.9 million) to $2.7 billion.
CANADA
In Canada December 2018, seasonally adjusted Manufacturing Shipments decreased 1.3% to $56.4 billion over November 2018 and increased 0.8% over December 2017. Compared to November 2018, overall sales decreased in 12 of 21 industries representing 72.7% of all manufacturing sales. Durable goods increased 0.6% to $30.3 billion over Nov 2018 and increased 1.5% over December 2017. Non-durable goods decreased 3.4% to $26.1 billion over Nov 2018 and were virtually unchanged over December 2017.
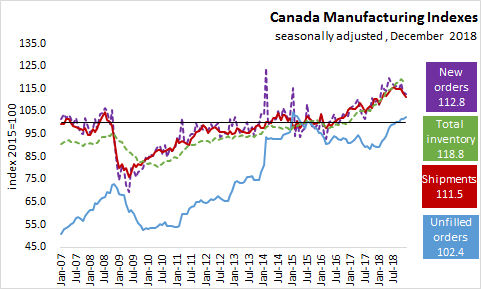
Inventory to sales ratio increased to 1.50 in December.
Unfilled orders increased for the third consecutive month with an increase of 0.6% to $97.3 billion.
Unfilled orders were up in the aerospace product and parts (+0.5%), machinery (+2.2%), and fabricated metal product (+2.7%) industries.
New orders decreased 0.8% to $57.0 billion over November 2018.
PROVINCES
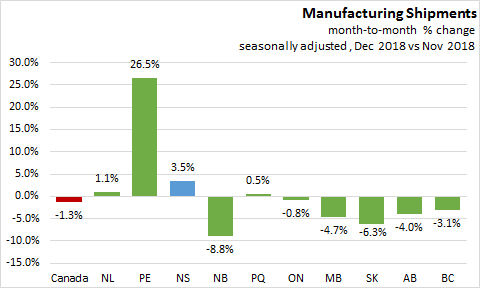
On a seasonally adjusted, month-over-month basis, Manufacturing sales increased in 4 provinces in December 2018 over November 2018. Prince Edward Island had the largest growth at 26.5%. New Brunswick shipment growth decreased 8.8%. Nova Scotia shipments increased 3.5%. In Canada shipments decreased 1.3%.
On a seasonally adjusted year-over-year basis, Manufacturing sales increased in 7 provinces in December 2018 over December 2017. Prince Edward Island had the largest growth at 23.2%. New Brunswick shipments growth decreased 33.1%. Nova Scotia shipments increased 1.9%. In Canada shipments increased 0.8%.

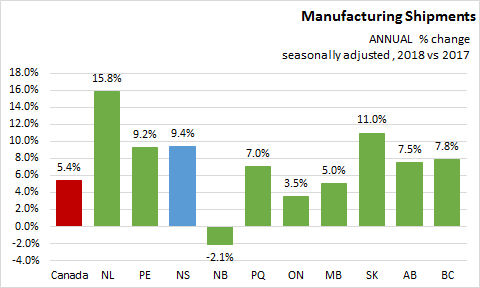
On a seasonally adjusted, year-to-date basis (Annual), Manufacturing sales increased in 9 provinces in Jan-Dec 2018. Newfoundland and Labrador had the largest growth at 15.8%. New Brunswick shipment growth decreased 2.1%. Nova Scotia shipments increased 9.4%. In Canada shipments increased 5.4%.
Nova Scotia's manufacturing shipments have grown for the fourth consecutive year, accelerating from 4.2 per cent in 2017.

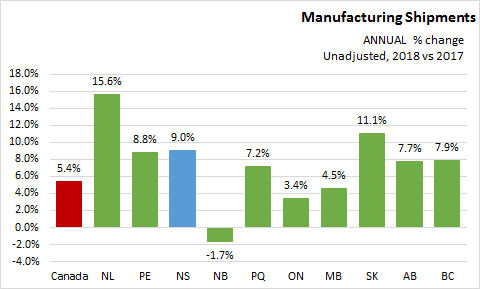
YEAR-TO-DATE UNADJUSTED DATA
On an unadjusted year-to-date basis, manufacturing shipments growth was positive in 9 provinces. In Canada shipments increased 5.4%. Nova Scotia shipments increased 9.0%.
SOURCES
Statistics Canada Monthly survey of Manufacturing, October 2018
Table 16-10-0047-01 Manufacturers' sales, inventories, orders and inventory to sales ratios, by industry (dollars unless otherwise noted)
Table 16-10-0048-01 Manufacturing sales by industry and province, monthly (dollars unless otherwise noted) (x 1,000)