For additional information relating to this article, please contact:
December 13, 2019VALUE ADDED IN EXPORTS, 2016 Statistics Canada has updated its estimates of value added and employment embodied in Canadian exports.
Value-added represents the contribution of labour and capital to the production process. Its components are labour income, gross operating surplus (or profits and depreciation) and taxes net of subsidies on production. The sum of value-added by all industries plus taxes net of subsidies on products is equal to GDP.
Exports only generate income (GDP) within Nova Scotia when value is added to either the domestically-produced or imported outputs. However, exports are typically reported on a gross basis, including the cost of imported inputs. Statistics Canada’s supply and use tables allow for the calculation of the proportion of exports that represent value added, and therefore, income generated within the provincial economy.
Statistics Canada's estimates calculate a value added amount within each sector that generates the exports. Statistics Canada further estimates the amount of value added created by upstream sectors within a province that supply an exporting sector. Statistics Canada also estimates the number of jobs associated with exports - both within exporting sectors and upstream sectors that supply them.
These estimates allow examination of the relative significance of trade for each province and sector. As the data are constructed using supply and use tables, there is a considerable lag in their production and they have only been updated to 2016 (along with revisions to 2014 and 2015).
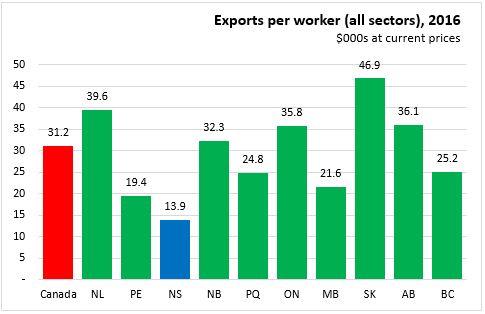
Overall, Nova Scotia's economy generates the least amount of exports (scaled to total employment in all sectors) at $13,863 per worker. This value is little changed compared to 2015 when it was $13,859.
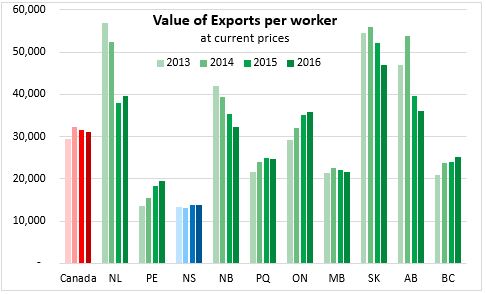
Resource-producing provinces still have the largest export values per worker, but these values fell in 2015 and 2016 due to lower oil prices. There was faster growth in value of exports per worker in British Columbia, Ontario and Prince Edward Island.
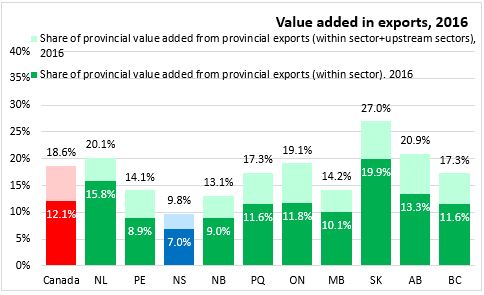
Of the total value added in the economy, Nova Scotia relies the least on exports to generate value added, with 9.8 per cent of GDP accounted for by value added in exports (either directly or in upstream sectors within the province). Saskatchewan generated the largest portion of its provincial value added from exports. The share of provincial value added created from exports sectors was similar for Alberta, Newfoundland and Labrador and Ontario. New Brunswick and Nova Scotia reported the least share of GDP accounted for by value added in exports.
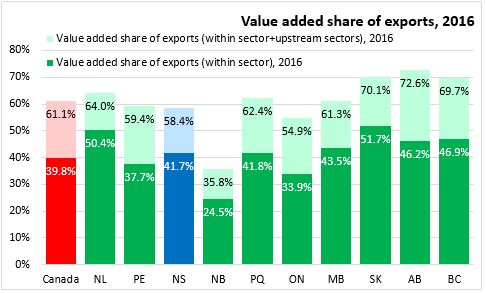
Despite its relatively low export intensity, the amount of value added measured as a share of total exports in Nova Scotia (41.7 per cent) is comparable to the national average (39.8 per cent). Counting the value added in exports created upstream of the exporting sector, 58.4 per cent of Nova Scotia's exports represent value added that generates income within the province. New Brunswick's value added share of exports is notably low because of the large value of imported content in its petroleum refining sector.
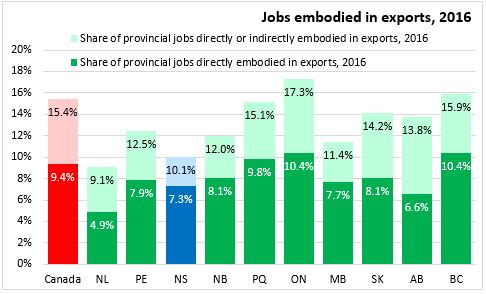
Nova Scotia's employment is comparatively less dependent on international exports as only 7.3 per cent of jobs are attributable directly to exports. Including upstream jobs embodied in exports, Nova Scotia's share of employment connected to exports is 10.1 per cent. The national average share of employment from exports is 15.4 per cent. The highest share is in Ontario at 17.3 per cent while the lowest is in Newfoundland and Labrador at 9.1 per cent.
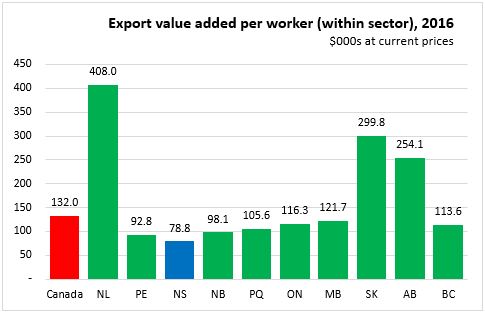
The amount of export value added per worker (directly within exporting sectors) is $78,800 for Nova Scotia, well below the national average of $132,000. The national average of value added per worker (within sector) is inflated by oil-producing provinces where export values are high relative to low employment within the oil and gas sector.
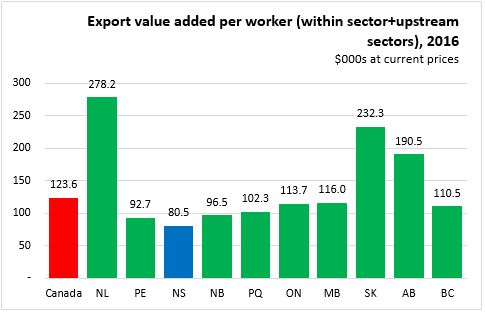
Including upstream value added to exports and upstream employment, Nova Scotia's export value added per worker is slightly higher at $80,500 per worker. However, export value added per worker in oil provinces is considerably lower after including upstream workers.
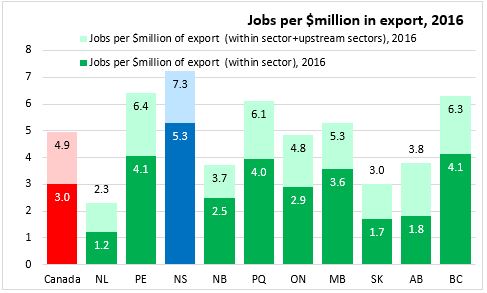
Calculating the number of workers required to generate $1 million in exports offers another perspective on the relationship between exports and employment. Nova Scotia's exports are the most labour intensive in the country requiring 7.3 jobs to generate $1 million in exports.
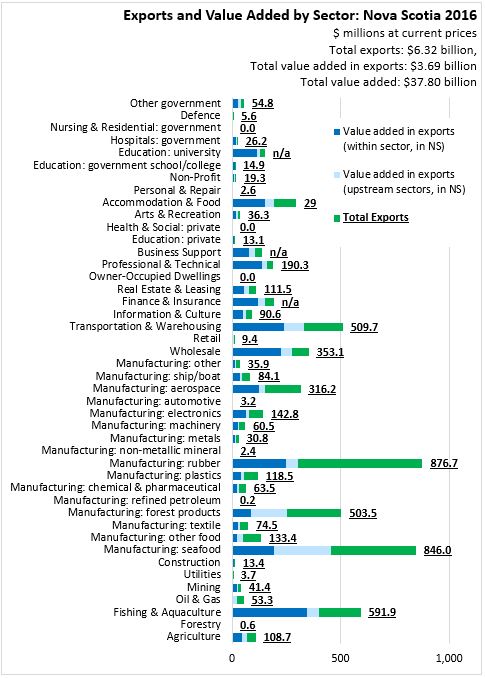
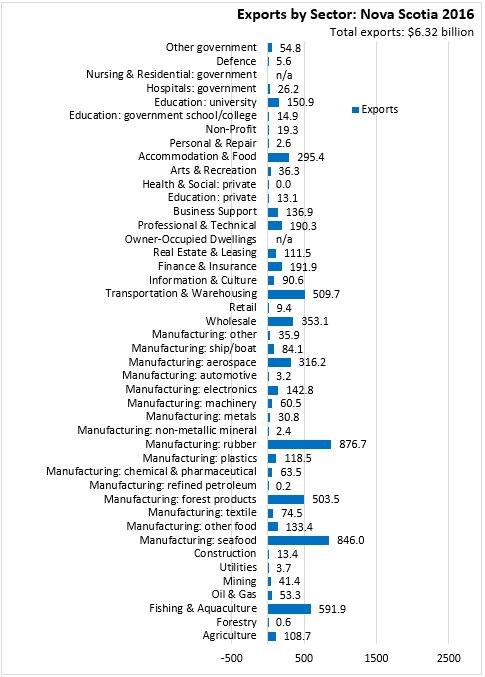
The value added in exports data also provides the most detailed information on the value of exports from all sectors, including services. Of the total value of $6.32 billion in exports from Nova Scotia in 2016, the largest values were from manufacturing, notably rubber products ($876.7 million), seafood products ($846.0 million, not including unprocessed) and fishing/aquaculture products ($591.9 million). Forest products ($503.5 million), transportation services ($509.7 million), and wholesale ($353.1 million) contributed the next largest exports.
From these exports, Nova Scotia generated $3.69 billion in added value, including the exporting sector as well as upstream sectors within the province. The chart below illustrates the amount of value added generated within each exporting sector as well as the value added generated in upstream sectors.
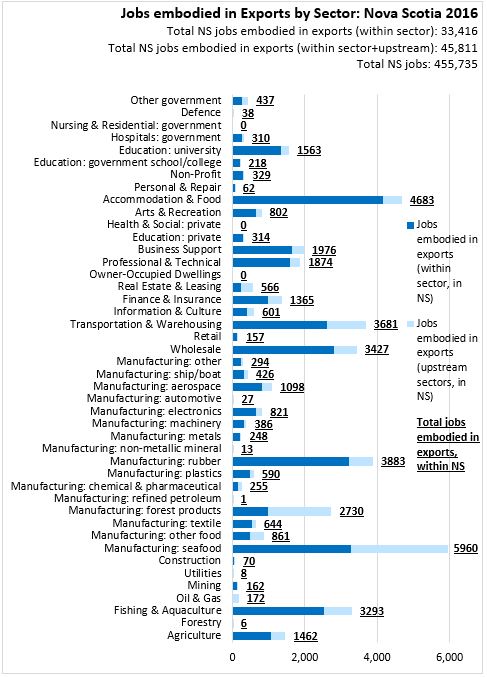
Statistics Canada estimates that in 2016 33,416 jobs were directly attributable to exports from a sector. Including upstream sectors, 45,811 jobs in Nova Scotia depended on exports. Seafood processing exports generated 5,960 jobs in 2016 - divided fairly evenly between jobs in the sector itself and upstream sectors. The next largest contributions of exports to employment were reported in accommodation/food, transportation/warehousing, rubber products manufacturing, wholesale trade, fishing/aquaculture and forest products.
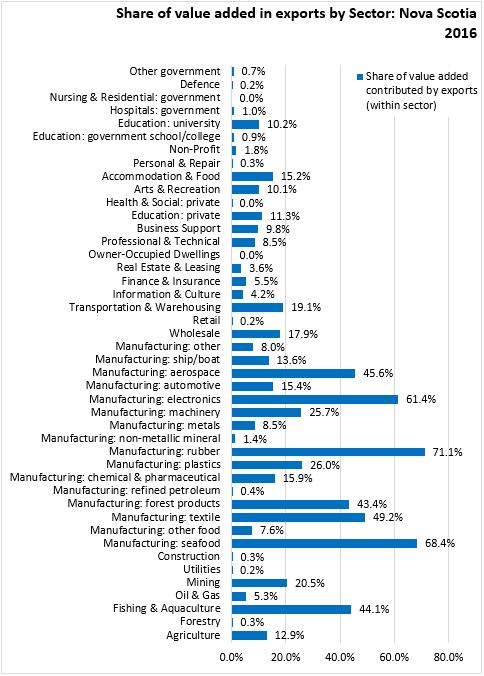
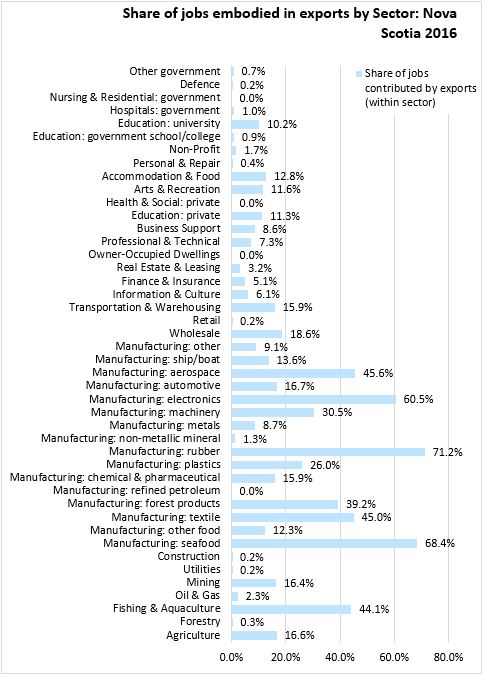
Measured in percentage terms (by either value added or employment), Nova Scotia's most export-intensive sectors in 2016 were largely in manufacturing: seafood processing, rubber products, electronics, textiles, machinery, aerospace and forest products. Mining and fishing/aquaculture also reported higher export shares of value added and employment. Other manufacturing sectors including ship/boat, metals, non-metallic, and other food manufacturing generate less value-added from international exports. Among services, export value-added share are highest in private education, transportation/warehouse, wholesale and business support.
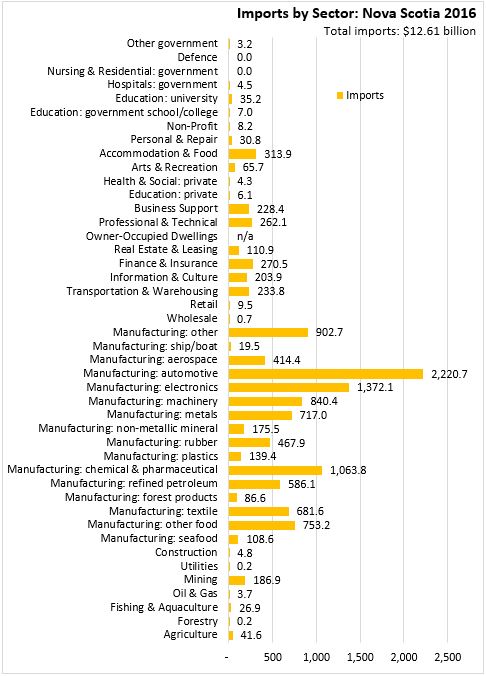
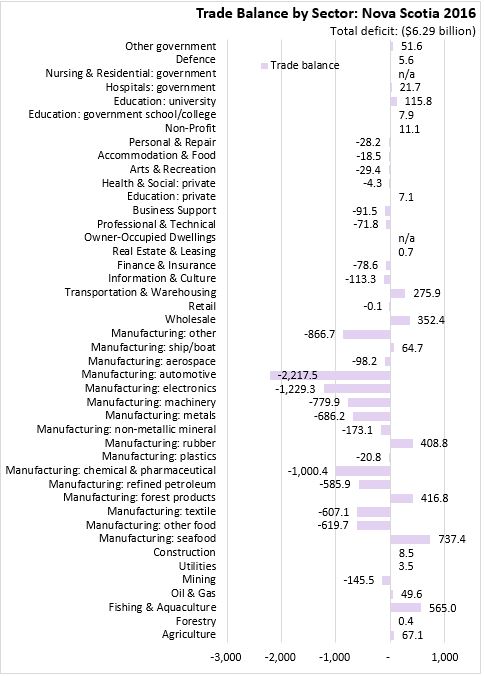
Statistics Canada's value added in exports also provides data on imports by sector as well, allowing the assessment of a trade balance by industry. Nova Scotia's imports are heavily concentrated in manufactured products, notably: automotive, electronics, chemical/pharmaceutical, machinery, metals, food and refined petroleum. Wtih relatively little production in these industries (except food), Nova Scotia has a substantial trade deficit in these products, with imports in excess of exports. Nova Scotia's products and services with trade surplus include: agriculture, fishing/aquaculture, seafood processing, forest products, rubber priducts, wholesale trade, transportation/warehousing, and university education.
Statistics Canada: Table 12-10-0100-01 Value added in exports, by industry, provincial and territorial