For additional information relating to this article, please contact:
December 01, 2020CANADIAN ECONOMIC ACCOUNTS Q3 2020 
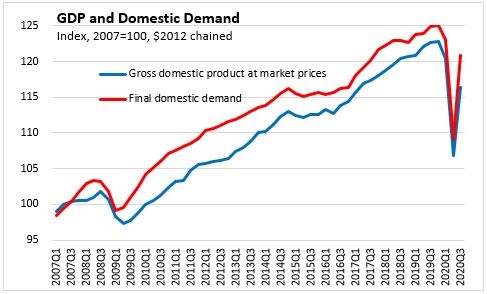
Real gross domestic product (GDP) growth increased 40.5% (figures seasonally adjusted at annual rates unless otherwise stated) in Canada in the third quarter of 2020 due to the reopening of the economy after COVID-19 related closures. This follows on a 38.1% decline in Q2. The last two quarters saw the steepest quarterly decline and increase since data started in 1961. The increase in GDP in the third quarter reflected substantial upturns in housing investment, household spending on durable goods, and exports. These increases were influenced by favourable mortgage rates, governments' continued support to households and businesses, and economic growth among major trading partners. Final domestic demand increased 50.8% at an annual rate following a 38.4% decline in Q2 2020.
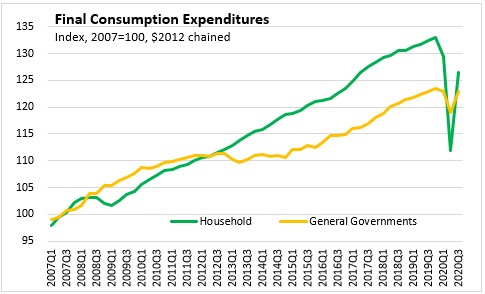
Household spending increased in the quarter with greater goods (+16.9%) and services (+9.6%) consumption. Increases in spending on durable goods were driven by purchases of new and used motor vehicles. Spending on durable goods was up 7.0% compared to the third quarter of 2019. Outlays for non-durables were up 3.9% compared to Q3 2019. The rise in outlays for services in the third quarter was led by food and beverage services. Despite growth in the quarter, household spending on services was down 11.6% compared to Q3 2019.
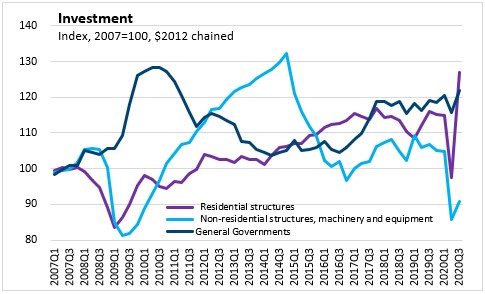
Residential structures investment increased 30.2% in Q3. The upturn was led by ownership transfer costs and to a lesser extent renovations. The increase in ownership transfer costs was widespread, as home resale activities resumed across the country, with sharp increases in resale units and prices. New construction increased 9.7% in Q3 2020, after a 7.6% decline in the second quarter. These increases coincided with low mortgage rates, improved job market conditions, and higher compensation of employees in the third quarter.
Business investments in non-residential buildings, machinery and equipment increased 5.9% compared to the previous quarter, but remained 14.8% below levels in Q3 2019.
Export volumes rose 14.5% after falling 18.9% in the second quarter, but remain 9.7% lower than volumes in Q3 2019. The rise in exports reflected higher domestic production and increased international demand as the economies of major trading partners improved. The increase in import volumes (+20.9%) was led by motor vehicles and parts, communication, and audio and video equipment, industrial machinery and equipment, and cleaning products, appliances, and miscellaneous goods and supplies. Despite these increases, import volumes were down 9.9% compared to the third quarter of 2019. The terms-of-trade rose primarily due to higher export prices for crude oil and crude bitumen.

Inventories declined $36.0 billion in Q3. This second straight quarterly decline pushed the economy-wide stock-to-sales ratio to its lowest level since the fourth quarter of 2018.

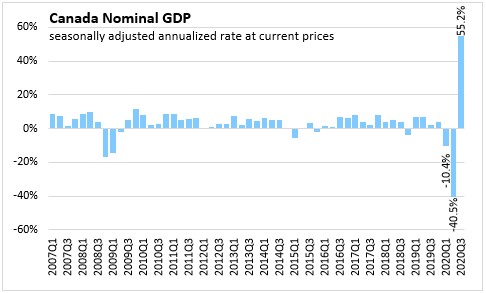
Nominal GDP increased 55.2% in Q3 2020 (seasonally adjusted at annual rates) after a 40.5% decline in Q2. Annualized compensation of employees increased 35.5%. Government wage support programs represented 5.5% of compensation of employees in the third quarter, compared with 10.4% in the second quarter. Net operating surplus of corporation increased at an annual rate of 182.9% while net mixed income was up 21.5%. These gains stemmed largely from reopening of businesses such as malls, restaurants, and hair salons.
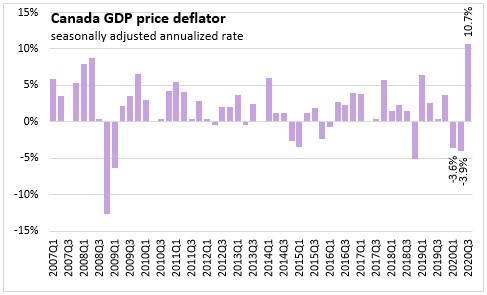
The GDP implicit price index, which reflects the overall price of domestically produced goods and services, rose 2.6% in the third quarter.
CANADA HOUSEHOLD CURRENT ACCOUNT
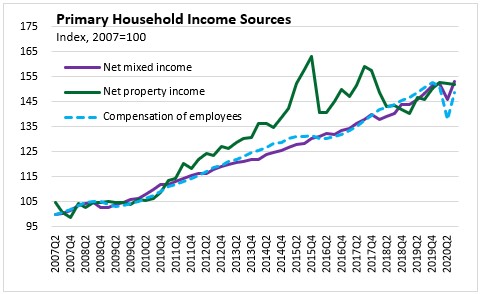
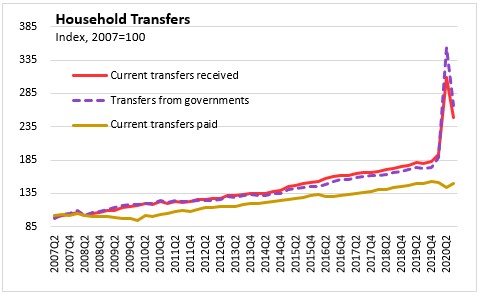
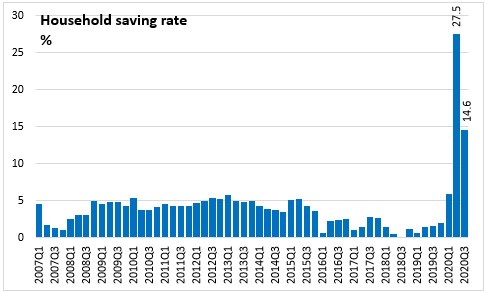
Increases in compensation of employees (+7.9%) and net mixed income (+5.0%) caused primary household income to increase at an annual rate of 29.5%. Offsetting the increase in primary income was a decline in transfers to households. Government transfers to households decreased $116.5 billion (-24.6%), while employment insurance benefits declined by $42.0 billion (-46.7%). After a rise in disposable income in Q2 due to transfers more than offsetting lower primary income, disposable income declined by $45.8 billion (-3.1%). The increase in compensation, coupled with elevated government transfers, helped offset a rebound in consumption as Canadians recorded another quarter of strong savings. The savings rate stood at 14.6%, down from a record 27.5% in the second quarter, but significantly higher than the fourth quarter of 2019, at 2.0%.

A seasonally adjusted annualized rate shows what the percent change would be if the quarterly rate continued for four quarters. It is computed by compounding the quarterly rate for four quarters. Reporting annualized rates facilitates comparability between annual and quarterly growth, but can exaggerate change when series are volatile. The COVID-19 shocks do not indicate an increase of Canadian GDP by 40.5% in Q3. It would take four quarters of compounded contraction at the same pace as reported in Q3 to increase Canadian GDP by 40.5%. Real GDP in Q3 increased 8.9% compared to Q2 2020.
Source: Statistics Canada Gross domestic product, income and expenditure, second quarter 2020
Statistics Canada. Table 36-10-0103-01 Gross domestic product, income-based, quarterly (x 1,000,000)
Statistics Canada. Table 36-10-0104-01 Gross domestic product, expenditure-based, Canada, quarterly (x 1,000,000)
Statistics Canada. Table 36-10-0111-01 Current and capital accounts - National, Canada, quarterly