For additional information relating to this article, please contact:
January 15, 2021US RETAIL SALES, DECEMBER AND ANNUAL 2020 The US Census Bureau announced today estimates of seasonally-adjusted U.S retail and food service sales for December 2020. Retail sales and food services increased 2.6% (+$13.8 billion) over November 2020 to $543.4 billion. Retail sales alone increased by 5.4% to $489.0 billion, while food service and drinking place receipts decreased 17.0% to $54.4 billion.
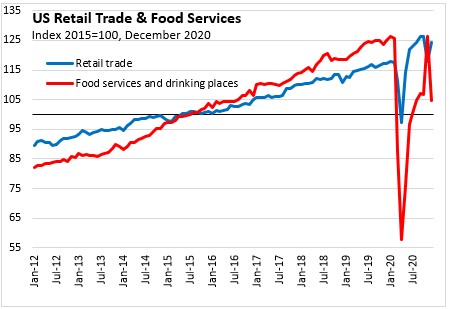
Year-over year, retail trade and food services increased 3.4% over December 2019. Retail trade increased 6.1% and food services and drinking places sales decreased 16.2% compared to the same month a year ago.
Compared to February 2020, retail trade and food service sales were up 3.1% in December. Retail trade was 5.9% higher in December versus February, while food services and drinking places sales were down 16.8%
Annual 2020
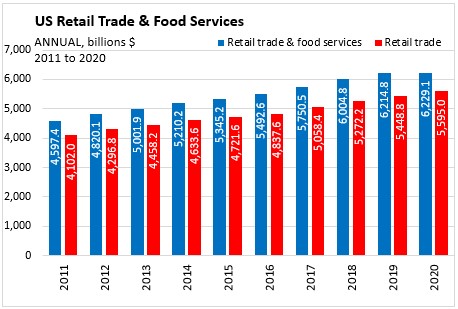
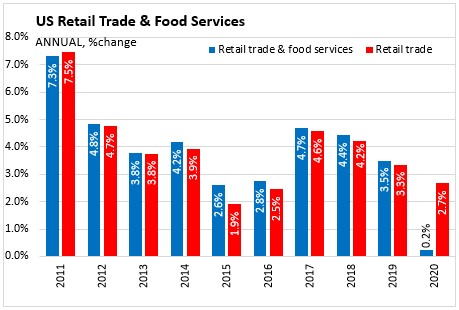
Retail sales and food service receipts were up 0.2% in 2020. Excluding food services and drinking places, retail trade sales were up 2.7% (+$146.3 billion). Food service and drinking places receipts were down 17.2% (-$131.9 billion).

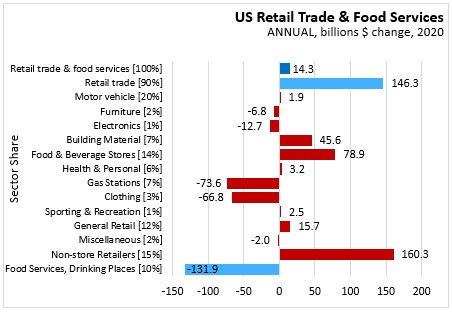
In percentage terms, sales were up in 7 of 13 retail categories, the fastest gains being reported in Non-store Retailers (+20.2%). The largest declines (in percentage terms) were seen in Clothing Stores (-25.0%).
Retail Trade increased 2.7% ($146.3 billion) to $5,595 billion.
- Motor vehicle dealers increased 0.2% ($1.9 billion).
- Furniture stores decreased 5.7% ($6.8 billion).
- Electronics stores decreased 13.1% ($12.7 billion).
- Building materials stores increased 11.9% ($45.6 billion).
- Food and beverage stores increased 10.3% ($78.9 billion).
- Heath and personal care stores increased 0.9% ($3.2 billion).
- Gasoline Stations decreased 14.7% ($73.6 billion).
- Clothing stores decreased 25.0% ($66.8 billion).
- Sports and hobby stores increased 3.1% ($2.5 billion).
- General merchandise stores increased 2.2% ($15.7 billion).
- Miscellaneous retail decreased 1.5% ($2.0 billion).
- Non-store retailers increased 20.2% ($160.3 billion).
- Food services and drinking places decreased 17.2% ($131.9 billion).
Source: US Census Bureau, Data Tables