For additional information relating to this article, please contact:
January 15, 2021UK TRADE BALANCE, NOVEMBER 2020
UK TRADE BALANCE
Month-over-month (Nov 2020 vs Oct 2020, seasonally adjusted)
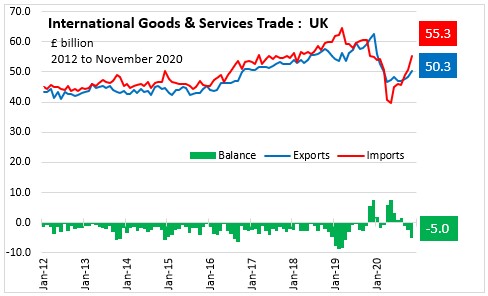
The United Kingdom Goods and services balance of trade deficit widened by £2.7 billion to £5.0 billion.
- exports of goods and services increased 3.9% (£1.9 billion) to £50.3 billion.
- imports of goods and services increased 8.9% (£4.5 billion) to £55.3 billion.
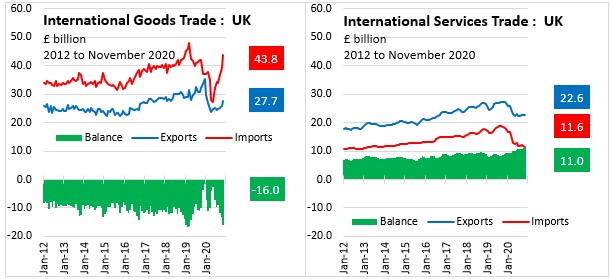
The United Kingdom Goods balance of trade deficit widened by £2.7 billion to £16.0 billion.
- exports of goods increased 7.5% (£1.9 billion) to £27.7 billion.
- imports of goods increased 11.9% (£4.7 billion) to £43.8 billion.
The United Kingdom Services balance of trade surplus widened by £0.1 billion to £11.0 billion.
- exports of services decreased 0.3% (£0.1 billion) to £22.6 billion.
- imports of services decreased 1.1% (£0.1 billion) to £11.6 billion.
Year-over-year (Nov 2020 vs Nov 2019, seasonally adjusted)
The United Kingdom Goods and services balance of trade deficit changed from a surplus (£5.5 billion) to a deficit (£5.0 billion).
- Goods balance of trade deficit widened by £12.4 billion.
- Services balance of trade surplus widened by £1.9 billion.
TRADING PARTNERS
Month-over-month (Nov 2020 vs Oct 2020, seasonally adjusted)
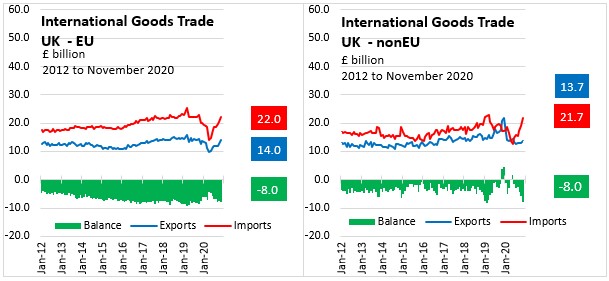
The United Kingdom EU-UK Goods balance of trade deficit widened by £0.5 billion to £8.0 billion.
- exports of goods increased 9.5% (£1.2 billion) to £14.0 billion.
- imports of goods increased 8.6% (£1.7 billion) to £22.0 billion.
The United Kingdom non-EU-UK Goods balance of trade deficit widened by £2.2 billion to £8.0 billion.
- exports of goods increased 5.5% (£0.7 billion) to £13.7 billion.
- imports of goods increased 15.5% (£2.9 billion) to £21.7 billion.
Year-over-year (Nov 2020 vs Nov 2019, seasonally adjusted)
The United Kingdom
- EU-UK Goods balance of trade deficit widened by £0.6 billion.
- non-EU-UK Goods balance of trade deficit widened by £11.9 billion as good exports decreased £7.2 billion and imports increased £4.7 billion.
GOODS TRADE BY SECTOR
Year-to-date (Jan-Nov 2020 ) Goods Trade by Sector
NET TRADE
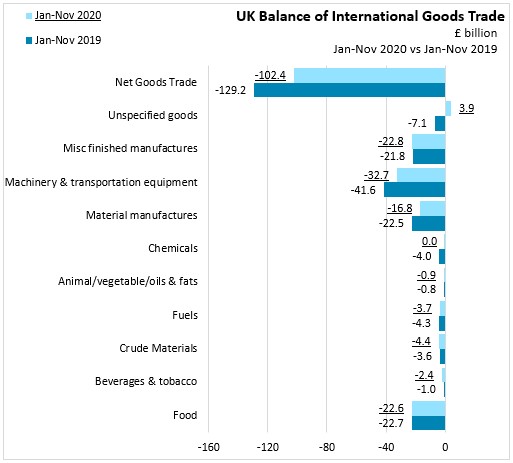
The Total trade deficit narrowed by £26.8 billion to £102.4 billion.
- Food deficit narrowed by £136.0 million to £22.6 billion.
- Beverages & tobacco deficit widened by £1463.0 million to £2.4 billion.
- Crude Materials deficit widened by £866.0 million to £4.4 billion.
- Fuels deficit narrowed by £577.0 million to £3.7 billion.
- Animal/vegetable/oils & fats deficit widened by £75.0 million to £0.9 billion.
- Chemicals deficit narrowed by £3912.0 million to £0.5 billion.
- Material manufactures deficit narrowed by £5,704.0 million to £16.8 billion.
- Machinery & transport equip deficit narrowed by £8,944.0 million to £32.7 billion.
- Misc finished manufactures deficit widened by £1,059.0 million to £22.8 billion.
- Unspecified goods changed from a deficit to a surplus (£3.9 billion).
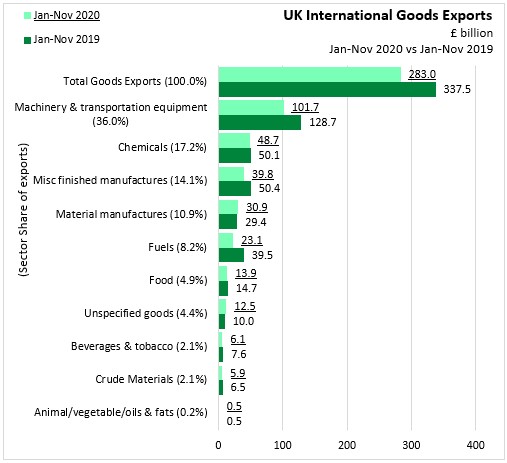
EXPORTS
Total Goods Exports decreased £54,471 millions to £283.0 billions.
- Machinery & transportation equipment decreased £26,956 millions to £101.7 billions.
- Chemicals decreased £1,426 millions to £48.7 billions.
- Misc finished manufactures decreased £10,670 millions to £39.8 billions.
- Material manufactures increased £1,567 millions to £30.9 billions.
- Fuels decreased £16,387 millions to £23.1 billions.
- Food decreased £880 millions to £13.9 billions.
- Unspecified goods increased £2,424 millions to £12.5 billions.
- Beverages & tobacco decreased £1,553 millions to £6.1 billions.
- Crude Materials decreased £584 millions to £5.9 billions.
- Animal/vegetable/oils & fats decreased £6 millions to £0.5 billions.
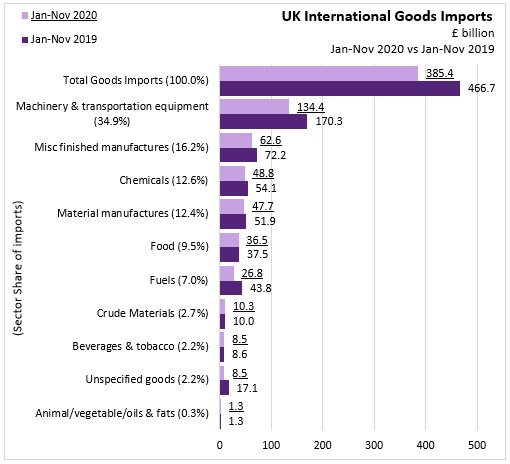
IMPORTS
Total Goods Imports decreased £81,297 millions to £385.4 billions.
- Machinery & transportation equipment decreased £35,900 millions to £134.4 billions.
- Misc finished manufactures decreased £9,611 millions to £62.6 billions.
- Chemicals decreased £5,338 millions to £48.8 billions.
- Material manufactures decreased £4,137 millions to £47.7 billions.
- Food decreased £1,016 millions to £36.5 billions.
- Fuels decreased £16,964 millions to £26.8 billions.
- Crude Materials increased £282 millions to £10.3 billions.
- Beverages & tobacco decreased £90 millions to £8.5 billions.
- Unspecified goods decreased £8,592 millions to £8.5 billions.
- Animal/vegetable/oils & fats increased £69 millions to £1.3 billions.
Source: UK Office for National Statistics, Statistical Bulletin | Time Series | Time Series Explorer