To view previous releases, select one from the dropdown box:
Currently displaying information released on: September, 2020
CANADIAN INCOME SURVEY, 2018 REVISIONS TO POVERTY RATE
With revisions to thresholds for the Market Basket Measure (MBM) of poverty, Statistics Canada has restated poverty rates across Canada. Incomes for the 2018 reference year reported in the Canadian Income Survey are unchanged, but the increased threshold reclassifies additional families and individuals as experiencing poverty. Poverty rates have been re-estimated back to 2015 using the 2018 base for the MBM.
Poverty Rates
The Market Basket Measure estimates the share of the population that do not have sufficient income to afford the cost of a basket of essential goods and services. The MBM threshold is estimated for specific communities. In Nova Scotia, there are separate thresholds for MBM in Halifax, Cape Breton, communities with populations between 30,000 and 100,000, communities with populations under 30,000 and rural areas.
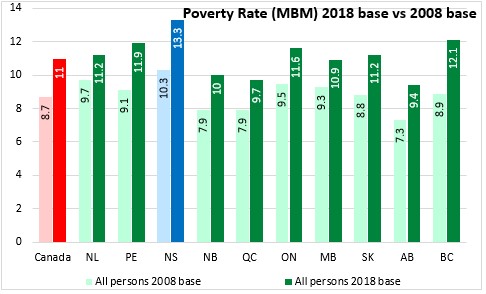
According to the Canadian Income Survey, 13.3 per cent of Nova Scotians lived with income below the poverty line established by the MBM threshold, revised up from the previous estimate of 10.3 per cent under the 2008 base for MBM thresholds. Nova Scotia has the highest poverty rate among provinces, followed by British Columbia and Prince Edward Island. Nationally, 11.0 per cent of the population had income below the MBM threshold with a low of 9.4 per cent in Alberta.
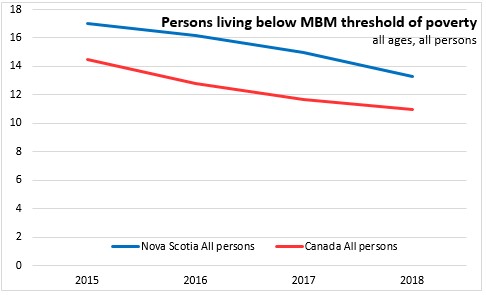
Poverty rates have been declining for several years in Canada and Nova Scotia. Although the revisions to the MBM thresholds increase the poverty rate in each year, the declining trend in poverty remains.
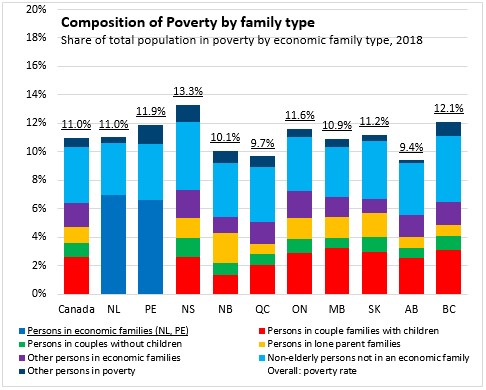
The largest group of persons in poverty in Canada is found among those who are not in economic families. Although poverty rates are similar for lone parent families, this group makes up a smaller share of the population and therefore a smaller portion of Canadians in poverty. Couple families (with children or without) typically have lower poverty rates, but they are a large portion of Canada's population and therefore make up a sizable number of Canadians in poverty.
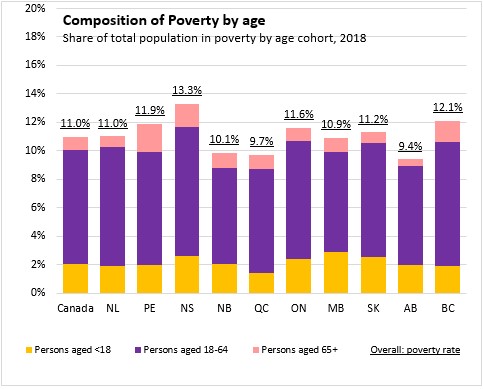
The bulk of Canadians in poverty are aged 18-64. The poverty rate among seniors is lower while the poverty rate among children is higher.
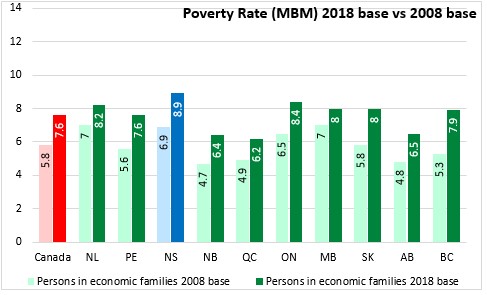
Among family structures, Nova Scotia's share of persons in economic families living below the MBM threshold of poverty was 8.9 per cent in 2018, revised up from 6.9 per cent under the previous (2008) MBM thresholds. Nova Scotia's poverty among economic families is the highest among provinces. Poverty rates for persons in economic families were revised up in every province.
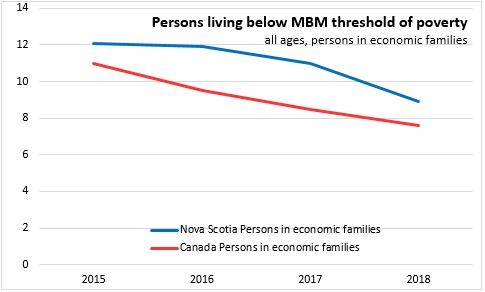
The poverty rate among Nova Scotia's economic families has declined in the last two years, closing the gap with the national average.
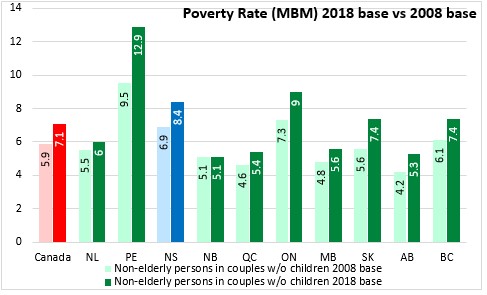
Within economic families, the share of Nova Scotia couples (non-elderly, without children or other relatives) living below the MBM threshold of poverty was 8.4 per cent, revised up from 6.9 per cent. Non-elderly couples without children generally have lower poverty rates than for all economic families.
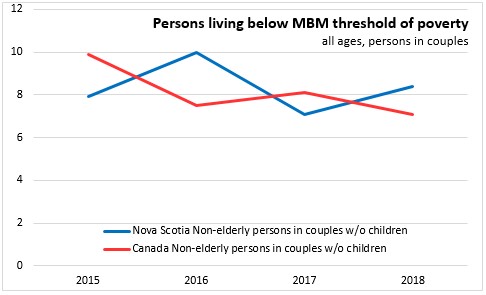
Nova Scotia's poverty rate among couple familes without children increased from 2017 to 2018
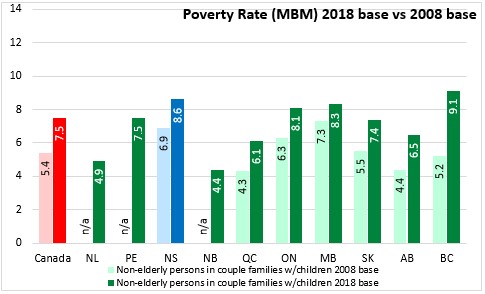
In 2018, 8.6 per cent of Nova Scotia couple families with children lived with income below the poverty line. This was revised up from 6.9 per cent under the 2008 base.
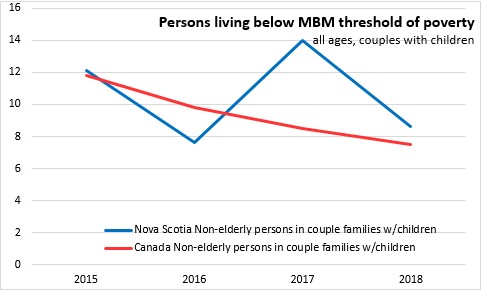
In 2017, there was a large increase in the number of people in couple families with children living under the poverty threshold. However, by 2018, the gap narrowed between poverty rates for couple families with children in Nova Scotia and Canada.
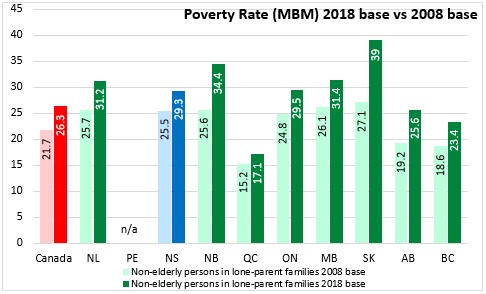
Lone parent families across the country report a higher share of the population living below the MBM threshold of poverty. In 2018, 29.3 per cent of persons in lone parent families in Nova Scotia lived below the MBM poverty line. This is revised up from 25.5 per cent measured using the 2008 base. Poverty among lone parent families has been revised up substantially in most provinces (data for Prince Edward Island are unavailable).
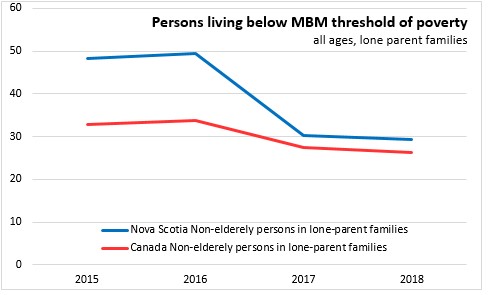
In 2017 and 2018, the poverty rate for lone parent families has declined significantly, particularly for Nova Scotia. In 2016, 49.4 per cent of Nova Scotians in lone parent families lived in poverty. In the next two years, this share declined by over 20 percentage points.
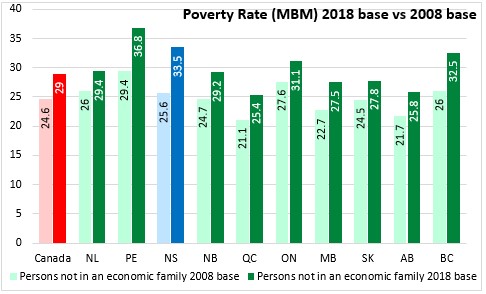
Those living outside of economic families report higher poverty rates than those living in economic families. In 2018, 33.5 per cent of the population of Nova Scotians not in economic families had income below the MBM poverty line, revised up from 25.6 per cent under the 2008 base for the MBM threshold.
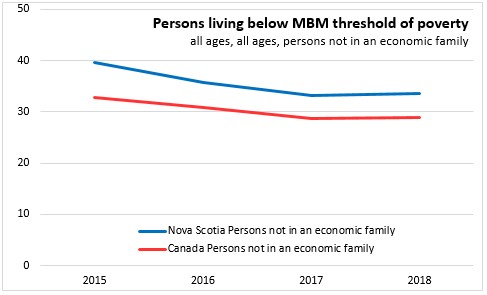
In 2016 and 2017, poverty rates among those not in an economic family declined, but this progress stopped in 2018.
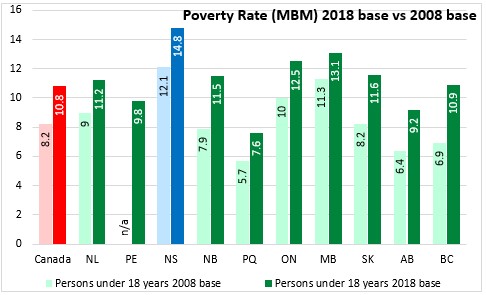
The share of Nova Scotia children in families with incomes below the MBM has been revised up from 12.1 per cent under the 2008 base to 14.8 per cent under the 2018 base for the threshold. Nova Scotia's rate of children in poverty remains the highest among provinces. Child poverty has been revised up in all provinces, with the largest increase in British Columbia.
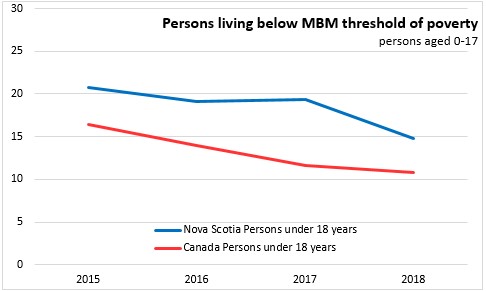
After stalling in 2017, Nova Scotia's child poverty declined again in 2018.
The share of Nova Scotia's population aged 18-64 living below the MBM threshold of poverty was 14.6 per cent, highest among provinces.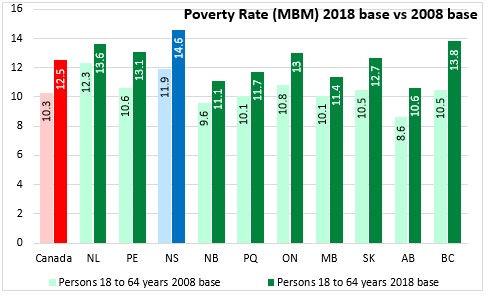
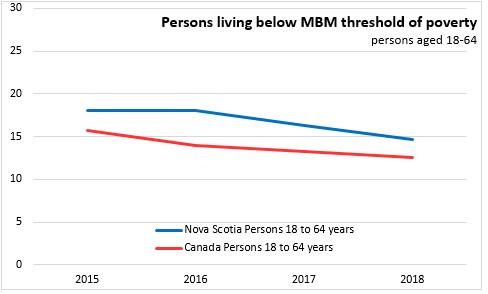
The share of Nova Scotians aged 18-64 living in poverty has declined in each of the last two years.
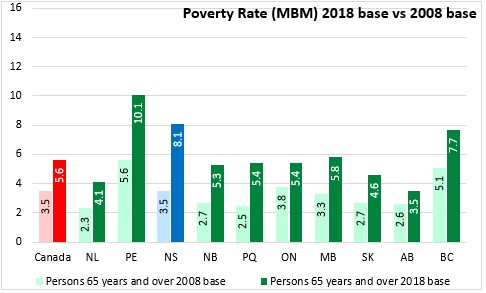
The share of senior citizens (aged 65+) living below the MBM is lower than it is for other age cohorts in Nova Scotia, but there has been a substantial upward revision, from 3.5 per cent under the 2008 base to 8.1 per cent under the 2018 base for the threshold. The revisions resulted in a higher share of seniors poverty in every province.
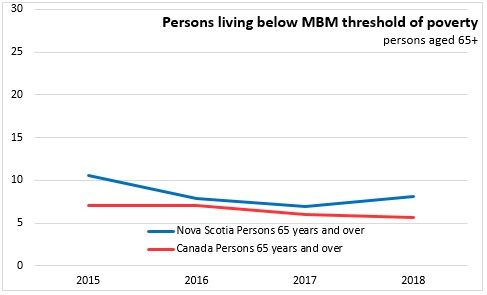
The poverty rate among seniors increased in Nova Scotia in 2018.
Notes and definitions
The Canadian Income Survey estimates are based on probability samples and are therefore subject to sampling variability. As a result, estimates will show more variability than trends observed over longer time periods.
The market basket measure (MBM) of poverty is based on the cost of a specific basket of goods and services representing a modest, basic standard of living. It includes the costs of food, clothing, footwear, transportation, shelter and other expenses for a reference family. These costs are compared with the disposable income of families to determine whether or not they fall below the poverty line. The definitions for the basket of goods and services have been updated as of the 2018 reference year (see separate article in today's DailyStats).
An economic family refers to a group of two or more persons who live in the same dwelling and are related to each other by blood, marriage, common-law union, adoption or a foster relationship. This concept differs from the census family concept used for subprovincial data in the Annual Income Estimates for Census Families and Individuals.
Sources: Statistics Canada, Canadian Income Survey:
Table 11-10-0135-01 Low income statistics by age, sex and economic family type
Table 11-10-0136-01 Low income statistics by economic family type MARKET BASKET MEASURE 2018-BASE THRESHOLD UPDATE
Statistics Canada and Employment and Social Development Canada (ESC) have updated the Market Basket Measure (MBM) to the 2018-base, completing the second comprehensive review of the MBM that started in 2018. For details of the changes a series of reports have been released: An update on the Market Basket Measure comprehensive review (Heisz, 2019), Towards an update of the Market Basket Measure (Djidel et al., 2019a), Defining disposable income in the Market Basket Measure (Djidel et al., 2019b). Report on the second comprehensive review of the Market Basket Measure (Djidel et. al, 2020).
SUMMARY OF CHANGES TO MBM THRESHOLD FOR THE 2018-BASE
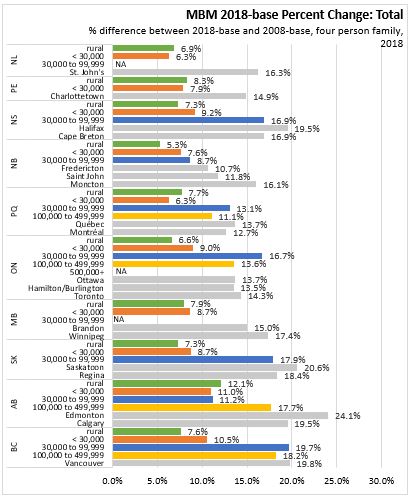
All components of the MBM basket (clothing/footwear, food, shelter, transportation and other) have methodological changes for the 2018-base compared to the 2008-base. The change to methodology affects MBM regions differently, but overall there is a higher threshold in all MBM regions with the 2018-base. Generally the rural areas and population under 30,000 have the smallest change and the specific urban MBM regions/cities have the largest increase in each province. Note the three new MBM regions do not have 2008-base thresholds for comparisons and appear as NA in the following charts.
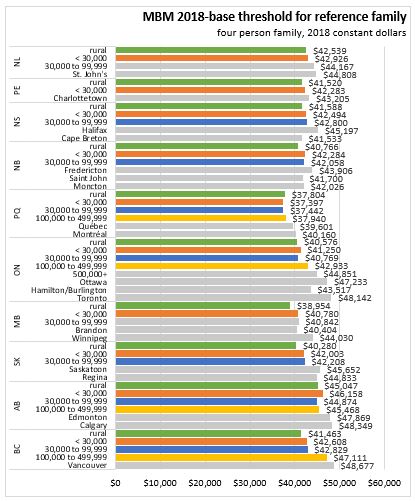
The threshold values are the disposable family income that is needed to be able to afford the MBM basket of goods and services, which are to reflect "a modest, basic standard of living" for a reference family of 2 adults and 2 children living in a particular region of the country. The threshold values for families of different sizes are calculated by multiplying the reference values by 50% of the square root of the family size. The threshold values have been reported in 2018-constant dollars.
The increase in the basket cost results in more people below the income threshold and thus an increase in the percentage of people living in poverty. The largest percentage and dollar increases in the threshold values were in urban areas. The higher threshold value is primarily from the shelter and transportation components of the basket.
The 2018-base thresholds for the reference family of 2 adults and 2 children in Nova Scotia increased for each region : rural (+$2,847), under 30,000 people (+$3,567), 30,000 to 99,999 people (+$6,193), Halifax (+$7,381) and Cape Breton (+$6,009).
The new MBM 2018-base threshold for the reference family for Nova Scotia are the following: rural ($41,588), under 30,000 people ($42,494), 30,000 to 99,999 people ($42,800), Halifax ($45,197) and Cape Breton ($41,533). The highest threshold value is in Toronto ($48,142) and the lowest is in Quebec under 30,000 ($37,397)
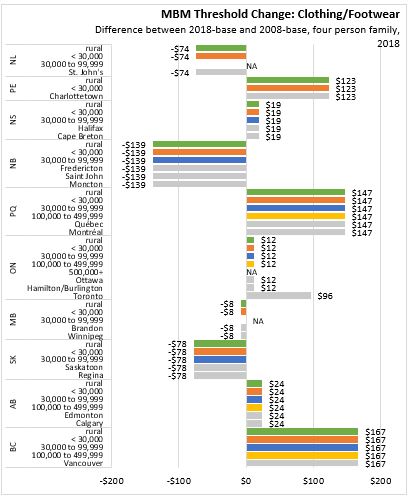
The 2018-base MBM for the clothing component basket of goods adopted the most recent (2012) list of goods of the Social Planning Council of Winnipeg and Winnipeg Harvest Acceptable Living Level. Previously the 2001 basket was used. The updated basket is more contemporary and responds to concerns around gender-stereotypes in quantities/types of clothing need. For the 2018-base MBM a one time collection from representative city in each province will be made with annual change based on the provincial CPI for "clothing and footwear". The component will continue to not differ between MBM regions within a province. The change for Nova Scotia is an increase in the clothing component by $19 to $2,207.
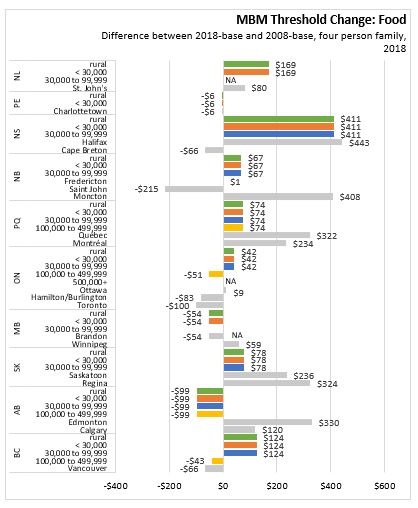
The 2018-base MBM uses the 2019 National Nutritious Food Basket to calculate food component and be consistent with the new Canada's Food Guide and commonly consumed nutritious foods. The change includes fresh, frozen and canned food formats to balance costs, access and availability considerations. Data collection from 38 cities across Canada will continue. The provincial CPI food price index would be used to determine change in price of the 2018-base food basket over time.
The threshold for food component rises all Nova Scotia regions except Cape Breton. Nova Scotia regions, except Cape Breton, had larger increases in the food thresholds than most other regions. The 2018-base MBM food component thresholds for a family of four in Nova Scotia is $12,001 for Halifax, $11,750 for Cape Breton and $12,528 for other areas.
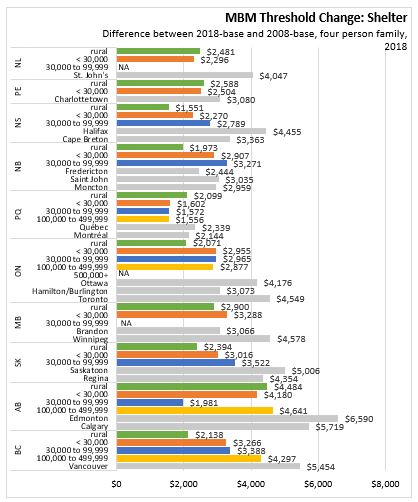
The largest increase in the MBM threshold comes from the Shelter component. The 2018-base MBM updated the shelter component based on 2016 Census and adopted the National Occupancy Standard of a 3-bedroom rental unit, instead of the previous 2 and 3 bedroom units used in the 2008-base. The 2018-base estimate is the median cost of a 3-bedroom rental unit by families in the second income decile in the region. The 2018-base MBM uses the all-items index of the CPI instead of CPI-rental accommodation to update the shelter component. Statistics Canada notes that they will continue research this component.
The change results in increase in the shelter component for all Nova Scotia regions with the largest increase in Halifax. CMA/CAs in each province generally experienced larger shelter cost increases than less populated areas. The shelter component threshold for a four person family in 2018-base MBM is: rural ($9,842), under 30,000 people ($10,747), 30,000 to 99,999 person ($11,516), Halifax ($15,312), and Cape Breton ($11,764).
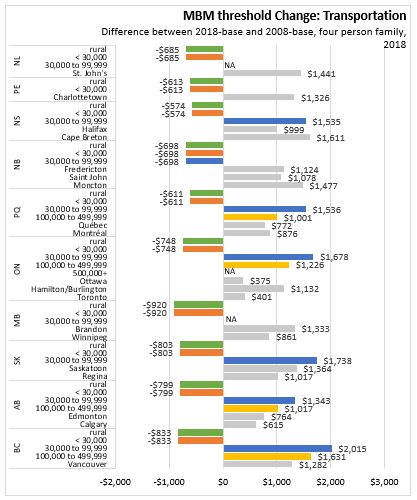
For 2018-base the change to the transportation component recognizes the widespread use of cars in urban centers, even those that have public transportation options. Based on 2016 Census commuting modes to work, urban areas will have a weighted transportation expenditure between public and private transportation. Rural areas and population centres under 30,000 will continue to use private transportation cost in the 2018-base. The typical compact car, assumed in the reference basket, has been updated to reflect the longevity of vehicles and improved fuel efficiency. The change results in lower transportation threshold in rural and under 30,000 MBM regions and a higher thresholds in areas that now include a private transportation component to the basket.
For Nova Scotia the transportation component cost for the reference family of four are: rural and under 30,000 ($4,790), 30,000 to 99,999 ($4,328), Halifax ($3,852), Cape Breton ($4,176).
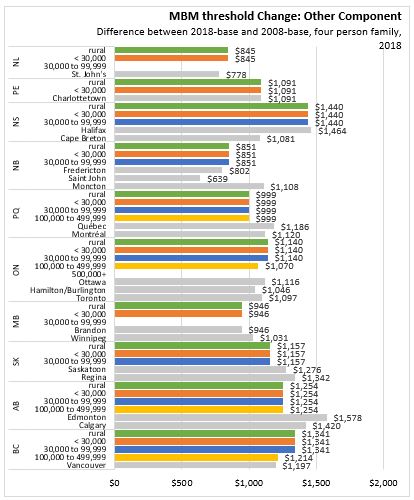
The "other" component of the 2018-base basket recognises need for necessary good and services not captured in the shelter, food, clothing and transportation components (i.e. household items, reading materials, etc.). A specific basket is not priced out due to larger number of items and differences between family needs. The 2018-base MBM continues to calculate "other" costs as a multiple of food and clothing costs for each MBM region. In addition, average cell phone service expenditures of persons in the second decile of income are now added to the 2018-base basket. Annual updates for the 2018-base of the "other" component will be based on the all-items CPI for each province. This had previously been based on food and clothing costs.
The change to the other component results in a higher threshold in the Nova Scotia MBM regions, other than Cape Breton, than most other MBM regions in Canada. The other component costs for Nova Scotia in the 2018-base are $11,824 in Halifax, $11,635 in Cape Breton, and $12,221 in the rest of Nova Scotia.
SUMMARY OF CHANGES OTHER THAN THRESHOLD
Based on 2016 Census results, there are three new population centre size regions: Newfoundland and Labrador 30,000 to 99,9999, Ontario 500,000+ and Manitoba 30,000 to 99,999. There are now 53 MBM regions.
Three broad changes to disposable income calculation were made:
1) An adjustment to family income recognizes differences in shelter costs for homeowners with equity and subsidized renters compared to the shelter component of MBM that is based on renters. Previously only mortgage-free homeowners received an adjustment. The new concept will be referred to as the Tenure Type Adjustment (TTA). Estimates of the difference shelter costs will be based on imputation of interest payments and differentiated based on age of homeowners with mortgages.
2) Out-of-pocket medical expenses when no tax information is available is updated to more recent survey data. this results in higher costs for the 2018-base with Nova Scotia rising from $189 to $420, other provinces have similar change. Imputation will still only be used when tax data claims are zero or can't be linked.
3) Capital Gains taxes will no longer be deducted from pre-tax income in the 2018-base MBM. This prevents families with larger capital gains from appearing to be in poverty.
Source: Statistics Canada. Table 11-10-0066-01 Market Basket Measure (MBM) thresholds for the reference family by Market Basket Measure region, component and base year
|