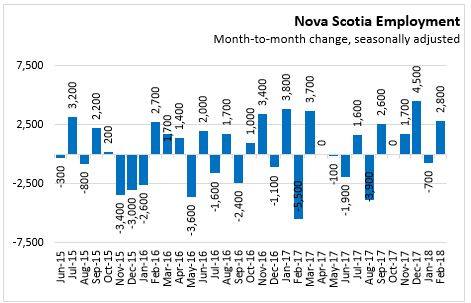
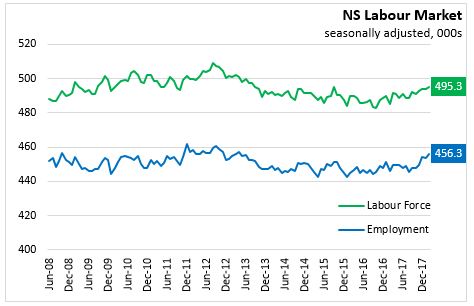
March 09, 2018LABOUR MARKET TRENDS - FEBRUARY 2018 Nova Scotia's seasonally adjusted employment increased by 2,800 to 456,300 in February 2018. This increase follows a drop of 700 in January. Nova Scotia’s employment is at its highest level since April 2013.
Compared to January, Nova Scotia’s labour force increased by 1,300 to 495,300 in February, its highest level since September 2013.
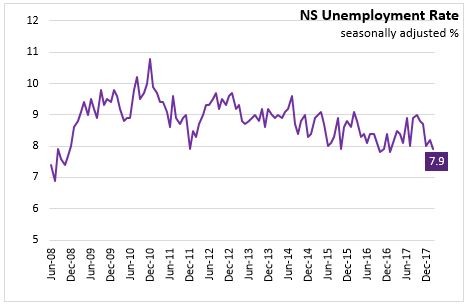
With labour demand growing at a faster pace than labour supply, the net result was a 0.3 percentage point fall in the seasonally adjusted unemployment rate to 7.9 per cent in February.
In February, the increase in employment occurred in full-time employment (2,800) while part-time employment decreased by 2,000. Changes in part-time and full-time employment can include the net impacts of changing hours of work within the same position.
Year-to Date (January- February 2018 vs. January- February 2017)
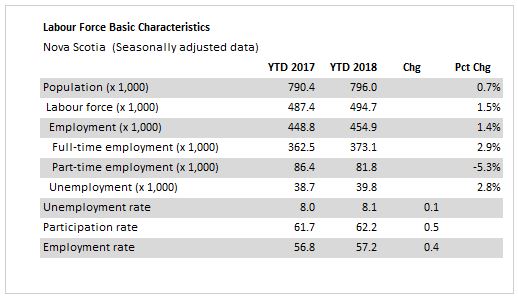
Comparing the first two months of 2018 to the same period in 2017, there was an increase of 6,100 (1.4 per cent) in the average employment level. Full time employment was up 10,600 while there were 4,600 fewer part-time jobs.
The labour force was up 7,300 compared to the first two months of 2017. With labour supply increasing at a faster pace, the net result was an increase in the average unemployment rate of 0.1 percentage point to 8.1 per cent. The labour force participation rate increased by 0.5 percentage points to 62.2 per cent. The employment rate increased to 57.2 per cent.
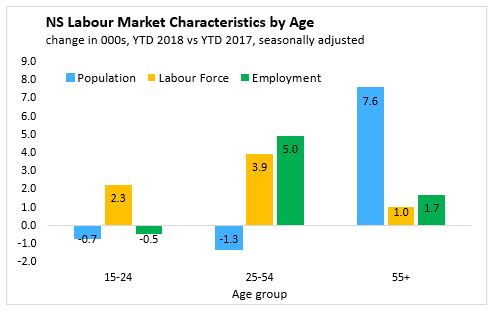
AGE COHORTS
Comparing the first two months of 2018 to the same period in 2017, the youth population (aged 15-24) saw a decrease in population (-700) and a drop in employment (-500) while the labour force increased by 2,300. With labour supply increasing faster than labour demand, the unemployment rate for 15-24 year olds increased from 15.1 per cent in the first two months of 2017 to 18.5 per cent in the first two months of 2018.
Within the 25-54 age cohort, the population declined 1,300 over the first two months of the year, but saw an employment increase of 5,000 (1.7%). With employment increasing faster than the labour supply, there was a 0.4 per cent decline in the unemployment rate for this cohort, dropping to 6.2 per cent for the first two months of 2018.
The cohort aged 55 and older saw a population increase of 7,600 over the first two months of last year, a labour force increase of 1,000 (0.9%) and employment gains of 1,700 (1.6%). With labour demand growing faster than the labour supply, there was a decrease in the unemployment rate to 6.9 per cent (compared to 7.5% over the first two months of 2017).

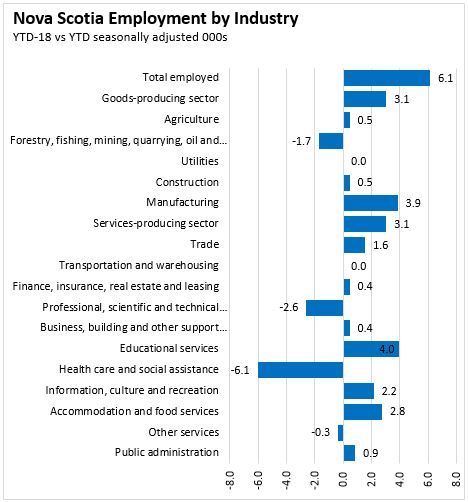
SECTORS
Looking at public and private sector employees for the first two months of 2018, the employment increase in private sector employees (6,100) was the driving force offsetting decreases in public sector employees (-1,400). For the same period self-employment was up 1,300.
Among goods-producing sectors, employment for the first two months of 2018 saw employment growth concentrated in manufacturing (+3,900) offsetting declines in forestry, fishing, hunting, mining and oil and gas. Services-producing employment increased by 3,100 for the first two months over the same period in 2017. The largest increases come from education services and food and accommodation sectors. The largest decline came from health care and social assistance.
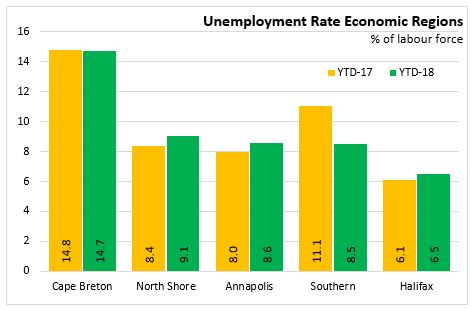
Regions (3 month moving average, January- February 2018 vs. January- February 2017)
Comparing the 3-month average for the first two months of 2018 with the same period in 2017, three regions (North Shore, Annapolis Valley, and Halifax) reported labour force growth that outpaced employment growth, resulting in higher average unemployment rates. The North Shore region had employment and labour force both decline compared to January 2017 while the Southern economic region had an increase in labour demand while labour supply declined.
The Cape Breton region reported a 100 job increase with 200 more in the labour force for the first two months of 2018 over the same period in 2017. The net result was a 0.1 percentage point decrease in the unemployment rate to 14.7 per cent.
For the North Shore region, employment decreased 3,100 for the first two months of 2018 compared to the same period in 2017 while the labour force declined 2,800 (-3.9 per cent). The faster decline for employment relative to labour supply resulted in an increase to the unemployment rate to 9.1 per cent.
The Annapolis Valley reported an increase in employment of 4,200 and an increase in the labour force of 5,000 for the first two months comparison. The net result was an increase of 0.3 percentage points in the average unemployment rate to 8.6 per cent.
The Southern region saw an increase of 700 in employment along with a drop of 700 in the labour force. With employment rising and labour force falling, the unemployment rate was down 2.6 percentage points to 8.5 per cent compared to the first two months of 2017.
Comparing the first two months of 2018 to the first two months of 2017 estimates, Halifax (HRM) experienced an increase in employment of 3,300 (along with an increase in the labour force of 4,300). With the labour supply growing faster than labour demand, the unemployment rate increased from 6.1 per cent to 6.5 per cent in Halifax.
Provincial Comparisons
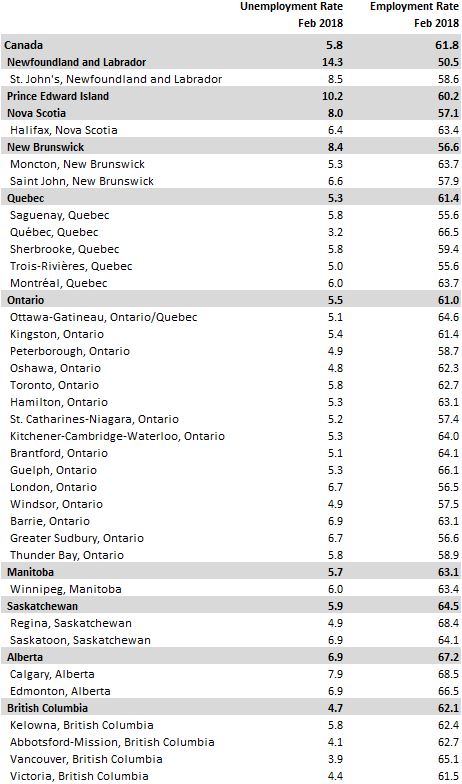
The Nova Scotia unemployment rate was 7.9 per cent in February 2018. In February of last year, the unemployment rate was 8.1 per cent in Nova Scotia. The Canadian unemployment rate was 5.8 per cent, down from 6.6 per cent one year ago. Compared to the same month one year ago, only PEI reported a higher unemployment rate. Alberta had the steepest decline (1.5 percentage points). The lowest unemployment rate among the provinces in January 2018 was in British Columbia (4.7 per cent) while the highest was in Newfoundland and Labrador, which remained at 14.0 per cent.
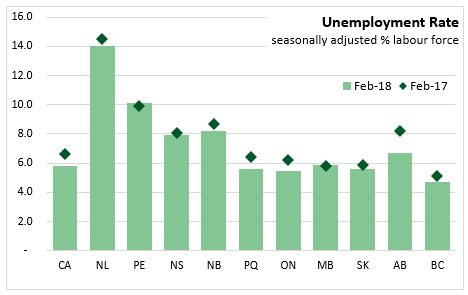
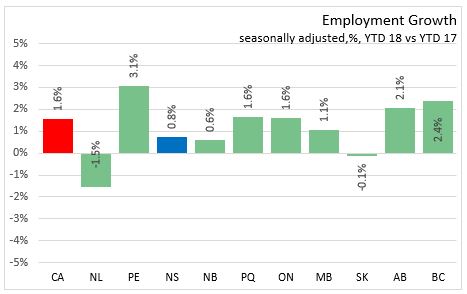
Comparing February 2018 with February 2017, employment increased 1.6 per cent in Canada. Employment grew in eight of the ten provinces, with the largest gains in Prince Edward Island (+3.1 per cent), British Columbia (+2.4 per cent), and Alberta (+2.1 per cent). Employment declined in Newfoundland and Labrador (-1.5 per cent) and Saskatchewan (-0.1 per cent).
National Comparisons: Cities
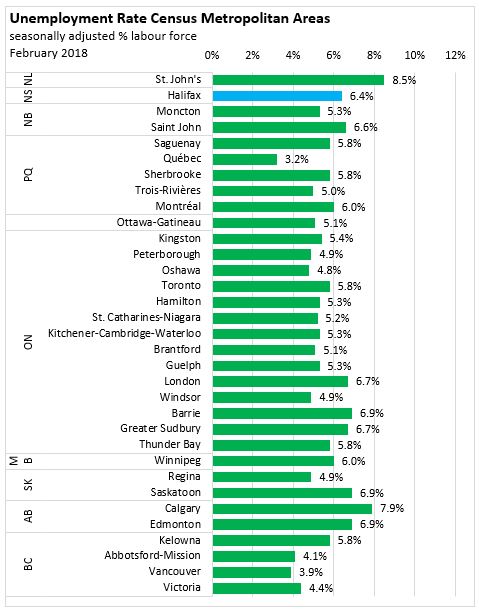
The seasonally adjusted unemployment rate for the Halifax Census Metropolitan Area (CMA) in January was 6.4 per cent. Quebec (3.2 per cent) had the lowest unemployment rate among CMAs in February, while the highest was in St. John’s (8.5 per cent).
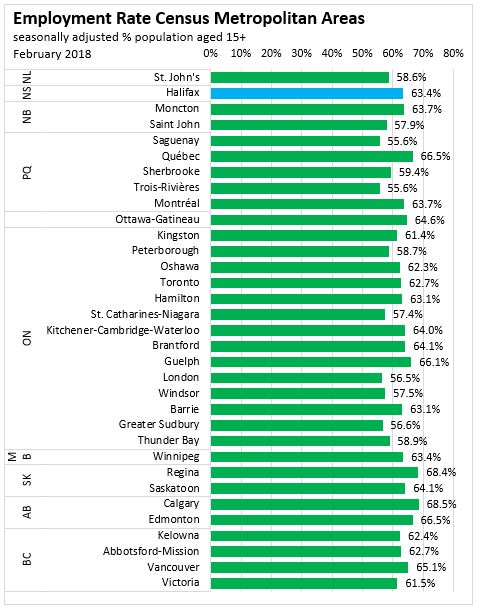
The seasonally adjusted employment rate for the Halifax CMA was 63.4 per cent, up from 62.5 last month. Saguenay and Trois-Rivieres had the lowest employment rates (55.6 per cent), while Calgary had the highest (68.5 per cent).
The three month average employment ending in January for the Halifax CMA was up 1.5 per cent compared to the three month period ending in January. The largest gain among CMAs was in Abbotsford-Mission, BC, where employment rose by 1.6 per cent.

Note: Seasonally adjusted, 3 month average.