January 04, 2019LABOUR MARKET TRENDS - DECEMBER 2018 AND 2018 ANNUAL Nova Scotia's seasonally adjusted employment increased by 1,400 to 459,100 in December 2018. This marks the sixth consecutive month of employment growth since 2007. The employment level has remained over 450,000 since December 2017.
Compared to November, Nova Scotia’s labour force increased by 1,500 to 494,000 in December. Unemployment declined by 200, and with labour supply growing faster than unemployment, net result was a 0.1 percentage point increase in the seasonally adjusted unemployment rate to 7.1 per cent in December.
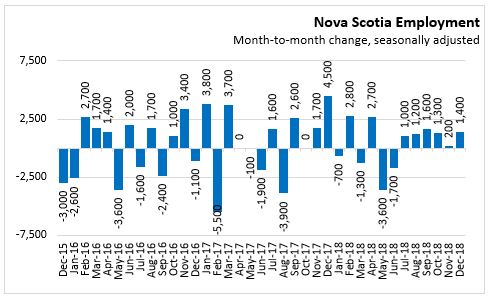


In December, the increase in employment was due to a gain in full-time employment (1,100) as well as in part-time employment (300). Full-time employment has once again reached an all time high at 378,300. Note: Changes in part-time and full-time employment can include the net impacts of changing hours of work within the same position.
Compared with December 2017, the labour force has increased by 200 while employment is up 4,900. The year-over-year increase in employment includes a rise of 9,000 in full time employment and a decrease of 4,100 in part time employment. The unemployment rate was 0.9 percentage points lower in December 2018 than it was in December 2017.
Annual
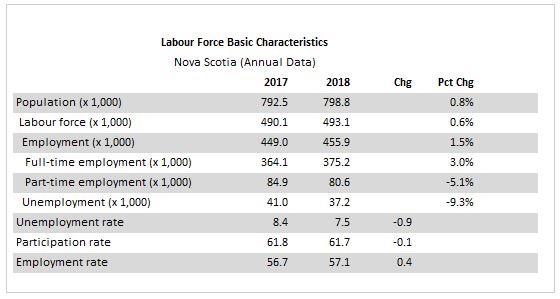
Comparing 2018 to 2017, there was an increase of 6,900 (1.5 per cent) in the average employment level. Full time employment was up 11,100 (3.0 per cent) while there were 4,300 fewer part-time jobs (-5.1 per cent).
The labour force was up 3,000 (0.6 per cent) compared to the 2017. With labour demand increasing at a faster pace, the net result was a drop in the average unemployment rate of 0.9 percentage points to 7.5 per cent for 2018. The labour force participation rate decreased by 0.1 percentage points to 61.7 per cent. The employment rate increased from 56.7 per cent to 57.1 per cent.
Age Cohorts
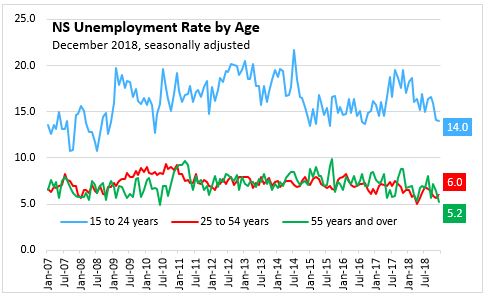
In December 2018, the unemployment rate for the 15-24 age cohort dropped 0.1 percentage point to 14.0 per cent compared to November. The 25-54 year old age cohort unemployment rate rose 0.3 percentage points to 6.0 per cent, and the 55 years and over age cohort unemployment rate dropped 1.2 percentage points to 5.2 per cent.
Age Cohorts - Annual
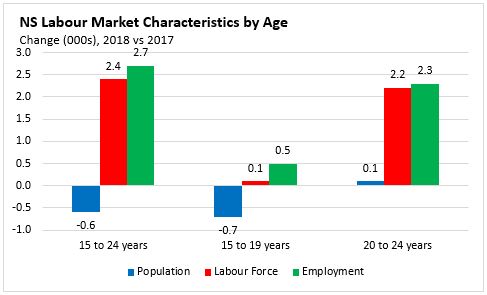
Comparing 2018 to 2017, the youth cohort (aged 15-24) saw a decrease in population (-600) and increases of 2,400 in labour force and 2,700 in employment. With labour demand increasing at a slightly faster pace than labour force, the unemployment rate for 15-24-year olds decreased to 15.6 per cent in 2018. The 15-19 age cohort saw an increase in labour force, and a larger increase in employment, and a drop in the unemployment rate to 20.7 per cent in 2018. The 20-24 age cohort saw increases in population, labour force, and in employment. This combination resulted in the unemployment rate falling from 13.5 per cent in 2017 to 12.8 per cent in 2018.
Within the 25-54 age cohort, the population remained level compared to 2017. Employment increased 3,200 while labour force rose by 700. With employment increasing faster than the labour supply, there was a 0.8 percentage point decline in the unemployment rate for this cohort, dropping to 6.1 per cent for 2018. The highest employment gains within the 25-54 age cohort were seen in those 35-39 years old, followed by 25-29 year olds. Unemployment rates for these two cohorts were 5.9 and 7.2 per cent, respectively, both showing declines compared to 2017.
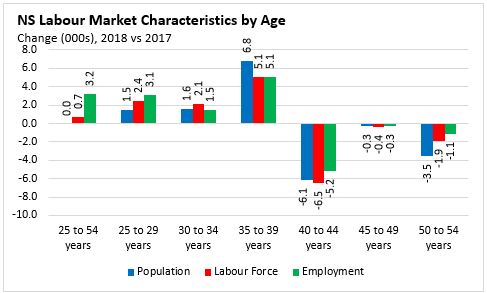
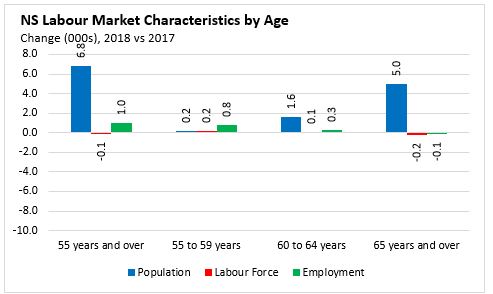
The cohort aged 55 and older saw a population increase of 6,800 in 2018, labour force decreases of 100 and an employment gain of 100. With labour demand growing faster than the labour supply, there was a decrease in the unemployment rate from 7.2 per cent in 2017 to 6.3 per cent in 2018. Within this larger age cohort, all subsets saw population increases and unemployment rate declines. The 65 years and over cohort was the only one to show labour force and employment declines.

Sectors - Annual
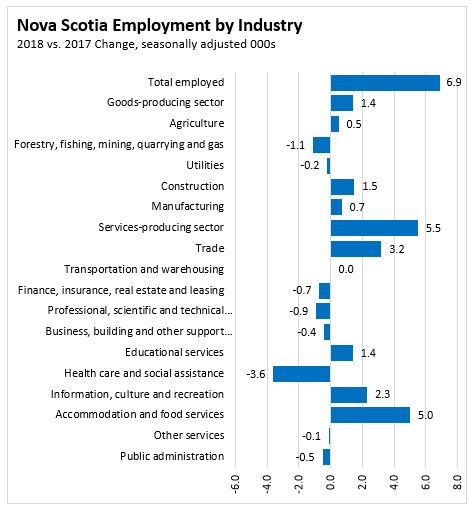
Looking at results by class of worker for 2018, employment increase for the private sector (5,7000) and self employment (1,700) were the main sources of employment growth, offsetting a decrease in public sector employees (-500).
Among goods-producing sectors, 2018 saw employment growth concentrated in manufacturing (+700) and construction (+1,500) offsetting declines in forestry, fishing, hunting, mining and oil and gas (-1,100). Services-producing employment increased by 5,500 in 2018 over 2017. The largest increases come from accommodation/food sectors, wholesale/retail trade, information/culture/recreation sectors, and education. The largest decline came from health care, with smaller declines in professional/technical services, finance/insurance, and public administration.
Regions - Annual
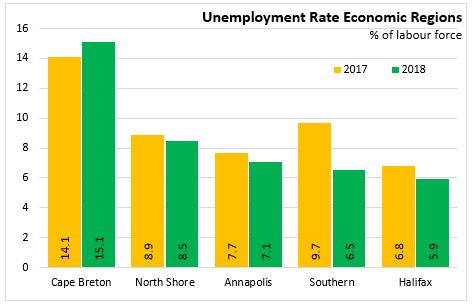
Comparing 2018 with 2017, umemployment rates fell in all economic regions except Cape Breton. The Southern and Halifax regions both saw employment gains, while all regions except Cape Breton had declines in total unemployment.
The Cape Breton region showed declines in both labour demand (-900) and labour supply (-400), and an increase in unemployment (+500). With unemployment rising and labour force shrinking, this put upward pressure on the unemployment rate, which rose from 14.1 per cent in 2017 to 15.1 per cent in 2018.
For the North Shore region, the labour force declined by 3,100 and employment declined by 2,500. Unemployment dropped by 600, causing a 0.4 percentage point drop in the unemployment rate to 8.5 per cent.
The Annapolis Valley reported a decline of 2,700 for employment along with a decline of 3,200 for the labour force. Unemployment dropped by 600, and the net result was drop in the average unemployment rate of 0.6 percentage points to 7.1 per cent.
The Southern region saw an increase of 3,300 in employment along with an increase of 1,800 in the labour force. With labour force and employment increasing (and unemployment declining), the unemployment rate was down 3.2 percentage points to 6.5 per cent for 2018.
Halifax experienced an increase in employment of 9,600 along with an increase in the labour force of 8,000. With the labour demand growing faster than labour supply the unemployment rate dropped by 0.9 percentage point to 5.9 per cent in Halifax.
Provincial Comparisons - Monthly and Annual
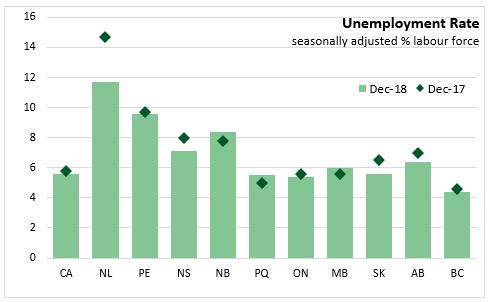
The Nova Scotia unemployment rate was 7.1 per cent in December 2018, down from 8.0 per cent a year ago. The Canadian unemployment rate was 5.6 per cent, down from 5.8 per cent one year ago. Canada's unemployment rate remains at its lowest level on record since the start of the Labour Force Survey.
Compared to the same month one year ago, three provinces noted slightly higher unemployment rates (New Brunswick, Quebec and Manitoba). Newfoundland and Labrador, PEI and Nova Scotia all posted declines in unemployment rates compared to December 2017. The lowest unemployment rate among the provinces this month was in British Columbia (4.4 per cent) while the highest was in Newfoundland and Labrador at 11.7 per cent.
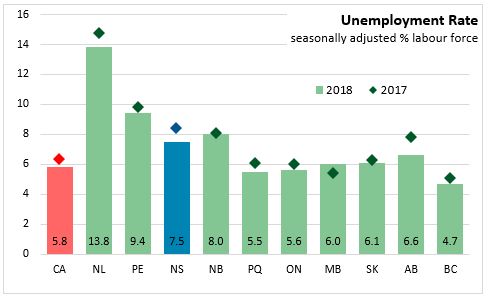
Employment across the country was up in all provinces in 2018 compared to 2017, with the largest gains in percentage terms in PEI and Alberta. The smallest gains were in New Brunswick and Saskatchewan. Nova Scotia saw a 1.5 per cent change in the level of employment. Nationally, employment was up 1.3 per cent.

Comparing 2018 with 2017, the unemployment rate dropped in all provinces with the exception of Manitoba. The largest drops were in Alberta and Newfoundland and Labrador.
National Comparisons: Cities (Monthly)
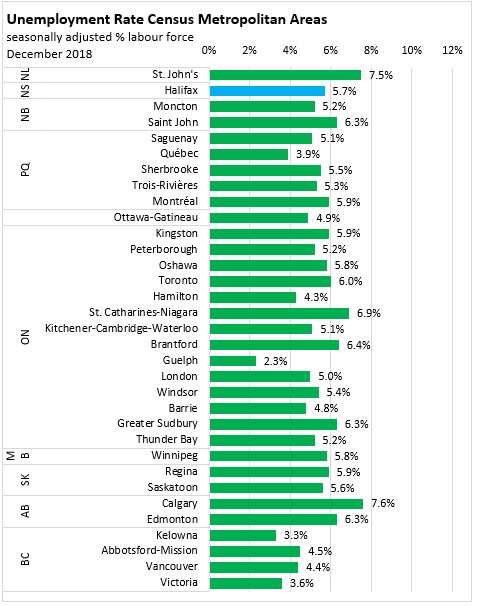
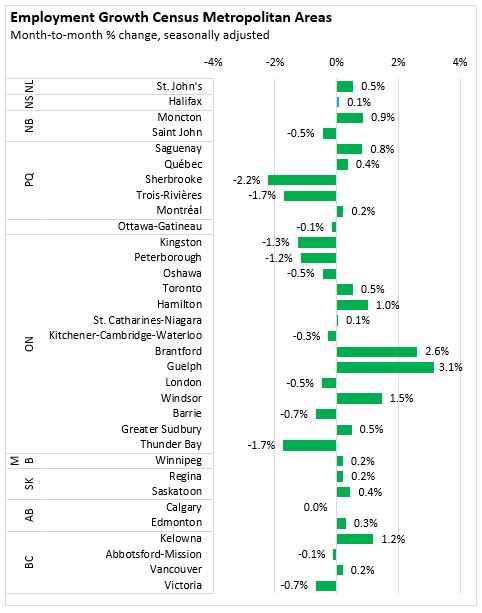
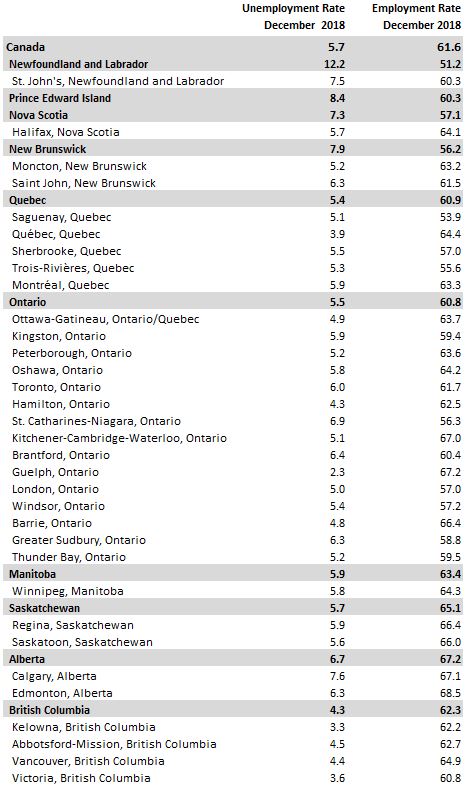
The seasonally adjusted unemployment rate for the Halifax Census Metropolitan Area (CMA) in December was 5.7 per cent (3 month moving average). Guelph, Ontario (2.3 per cent) had the lowest unemployment rate among CMAs, while the highest was in Calgary (7.6 per cent).
The seasonally adjusted employment rate for the Halifax CMA was 64.1 per cent, down slightly from last month. Saguenay had the lowest employment rate (53.9 per cent), while Edmonton had the highest (68.5 per cent).
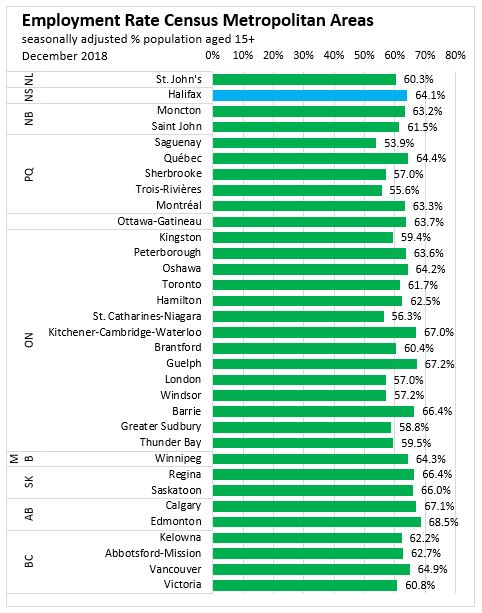
Halifax’s employment (3 month moving average) for December was up 0.1 per cent compared to the November result. The largest gain among CMAs was in Guelph, Ontario, where employment rose by 3.1 per cent.
Note: Seasonally adjusted, 3 month average.