February 26, 2019CANADIAN INCOME SURVEY, 2017 Statistics Canada has released results from the Canadian Income Survey.
Average income
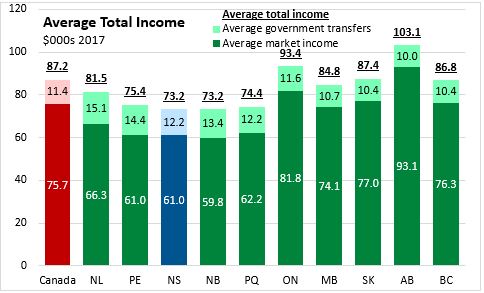
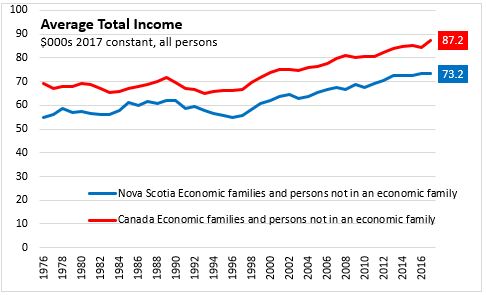
In 2017, the average total income of Nova Scotians (persons both in economic families and not in economic families) was $73,200 - consisting of $61,100 in market income and $12,100 in government transfers. The national average total income was $87,200 ($75,700 in market income and $11,400 in transfers).
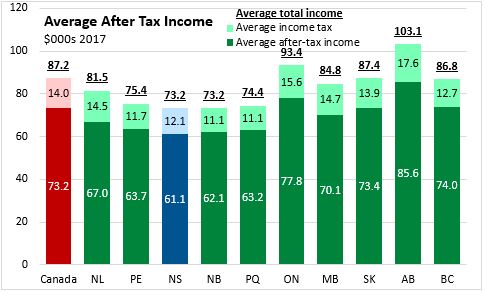
Nova Scotia's after-tax income averaged $61,100 in 2017 as income taxes averaged $12,100. National after tax income averaged $73,200 with an average income tax of $14,000.
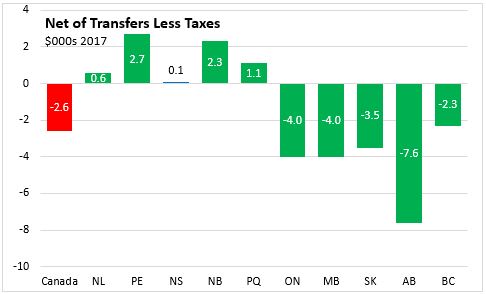
The average net transfer (transfers less taxes) was $100 in Nova Scotia as total transfers were slightly larger than income taxes.
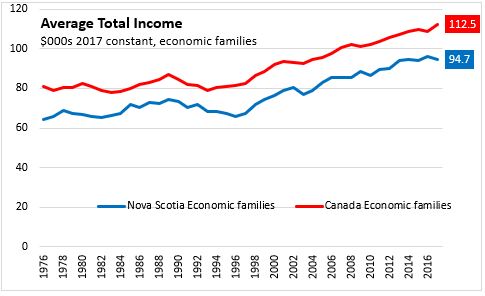
Data for all persons does not distinguish between those in economic families and persons not in economic families. With a larger number of possible earners, economic families typically report higher incomes, transfers and taxes. Economic families in Nova Scotia reported an average market income of $80,000 in 2017 and average transfers of $14,700.
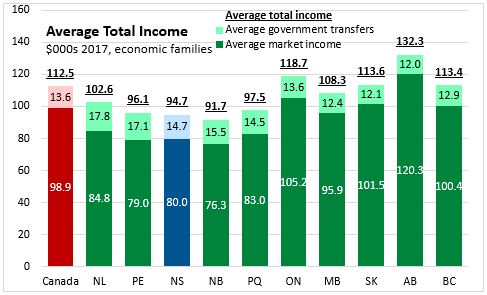
Of total income averaging $94,700 among economic families in Nova Scotia, average taxes were $15,900, leaving after tax incomes of $78,800.
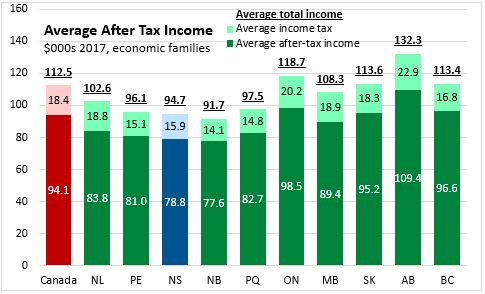
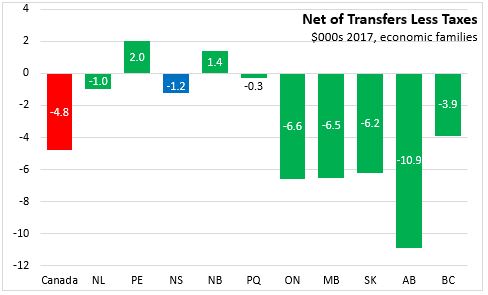
Net transfers to Nova Scotia economic families were -$1,200 in 2017 (meaning more taxes paid than transfers received).
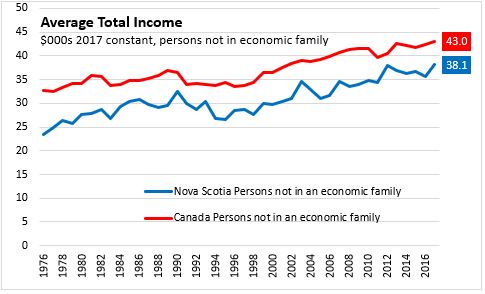
Among those not in economic families, market income averaged $30,000 in Nova Scotia while transfers averaged $8,100.
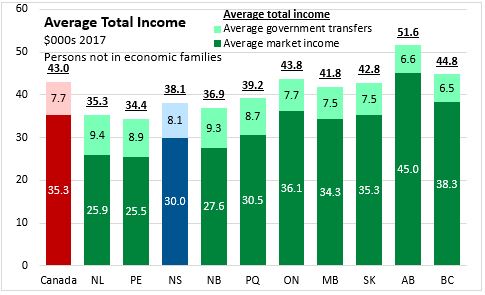
Average taxes were $5,800 from persons not in an economic family in Nova Scotia in 2017, leaving after tax income of $32,400.

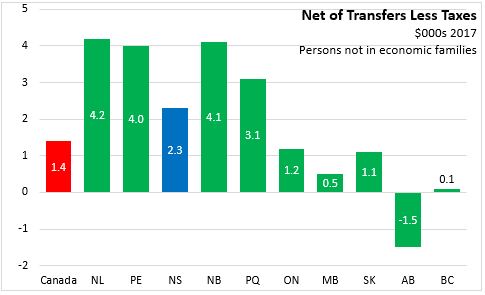
The net transfer to Nova Scotia's persons not in an economic family was $2,300 (more transfers received than taxes paid).
Real incomes (total incomes measured in 2017 constant dollars) have been rising in Nova Scotia since the mid 1990s. However, this growth slowed in recent years, while national real income growth accelerated.
Among economic families however, Nova Scotia's real incomes declined in 2017 while national real incomes grew.
For persons not in an economic family, average real incomes increased in 2017, reversing a downward trend since 2012.
Market Basket Measure of poverty
Federal Legislation introduced in the Fall of 2018 proposes to define the Market Basket Measure (MBM) as Canada's official poverty line.
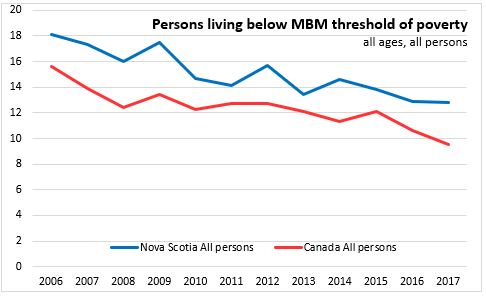
The Market Basket Measure estimates the share of the population that do not have sufficient income to afford the cost of a basket of essential goods and services. The MBM threshold is estimated for specific communities. In Nova Scotia, there are separate thresholds for MBM in Halifax, Cape Breton, communities with populations between 30,000 and 100,000, communities with populations under 30,000 and rural areas.
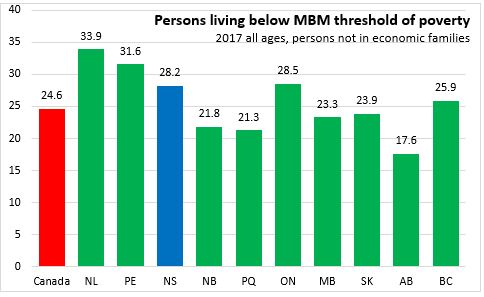
According to the Canadian Income Survey, 12.8 per cent of Nova Scotians lived with income below the poverty line established by the MBM threshold. This is the highest share in Canada. Nationally, 9.5 per cent of the population had income below the MBM threshold with a low of 6.8 per cent in Alberta.

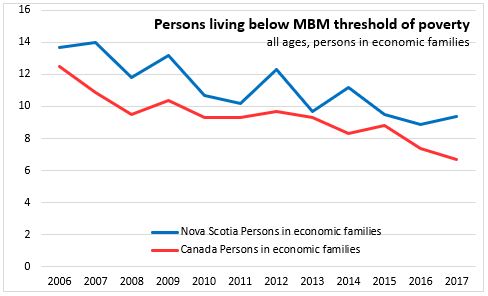
Over time, the share of the population living below the MBM threshold has fallen both nationally and in Nova Scotia. However, in the last year, this decline was slower in Nova Scotia.
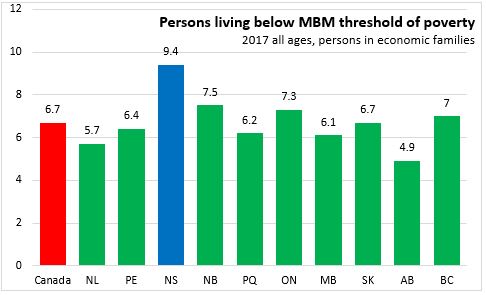
Among family structures, Nova Scotia's share of persons in economic families living below the MBM threshold of poverty was 9.4 per cent in 2017, also the highest among provinces. Of the total population, 82.1 per cent lived in economic families in Nova Scotia. This is below the national average of 84.2 per cent.
Nova Scotia's share of economic families living with incomes below the MBM threshold rose while the national share declined.
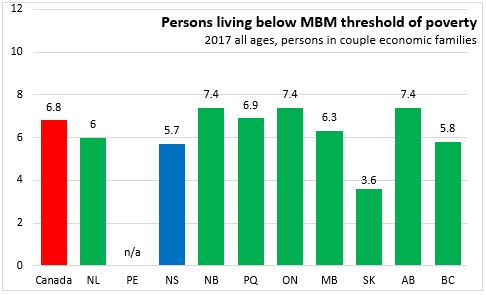
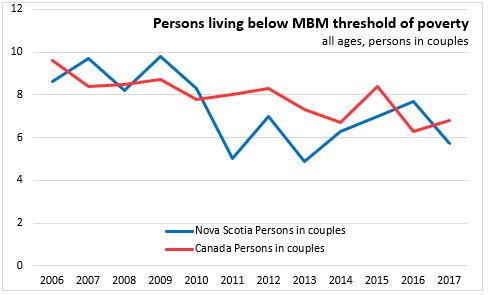
Within economic families, the share of Nova Scotia couples (non-elderly, without children) living below the MBM threshold of poverty was 5.7 per cent - below the national average and a decline from 2016. Couples make up 35.6 per cent of non-elderly economic families in Nova Scotia, higher than the national average.
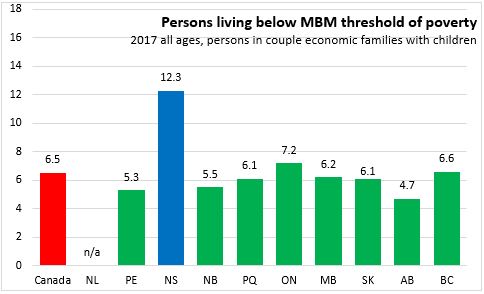
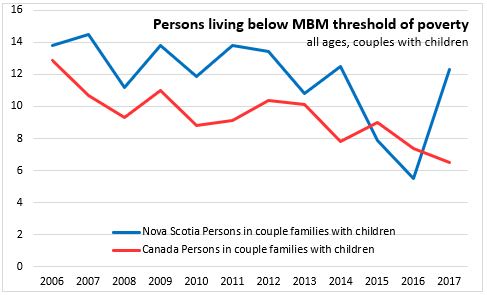
However, Nova Scotia's share of couple families with children living below the MBM threshold rose sharply from 5.5 per cent in 2016 to 12.3 per cent in 2017. This was the highest share in the country by a wide margin in 2017. Couples with children account for 31.2 per cent of Nova Scotia's non-elderly economic families.
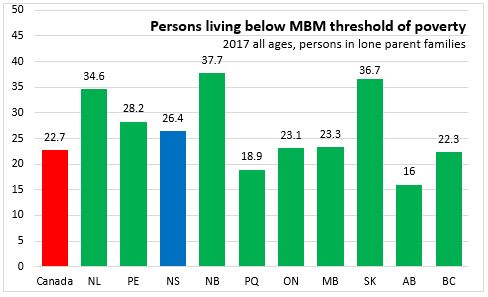
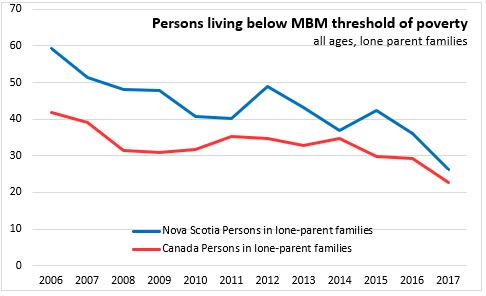
Lone parent families across the country report a higher share of the population living below the MBM threshold of poverty. In 2017, 26.4 per cent of persons in lone parent families in Nova Scotia lived below the MBM threshold. However, this is down 59.4 per cent in 2006. The national share of lone parent families living below the MBM threshold has also fallen substantially but it still remains well above the share for other family structures. Nova Scotia's lone parent families make up 10.2 per cent of all non-elderly families, the highest share in the country.
Among those living outside of economic families (17.9 per cent of the population), the share living below the MBM threshold is also typically higher than for those in economic families (apart from lone parents). In 2017, 28.2 per cent of the population of Nova Scotians not in economic families had income less than the MBM threshold. Nova Scotia's share of persons not in an economic family with income below the MBM threshold is higher than the national average, but has been trending down in step with the national average over the past two years.

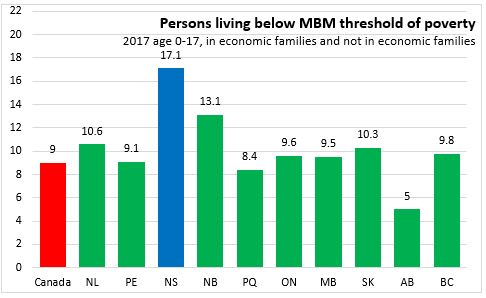
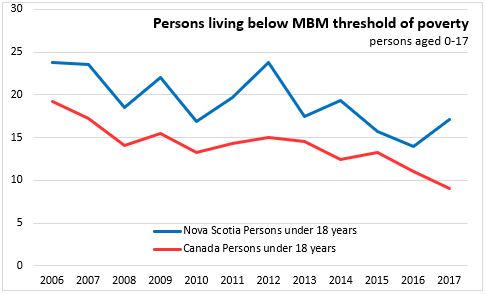
The share of Nova Scotia children in families with incomes below the MBM threshold of poverty rose in 2017, particularly among those in couple economic families. Children of lone parents reported a substantial decline in living below the MBM threshold. The share of children (aged 0-17) living below the MBM threshold of poverty was 17.1 per cent, the highest in the country. This partially reverses improvements made over the past two years.
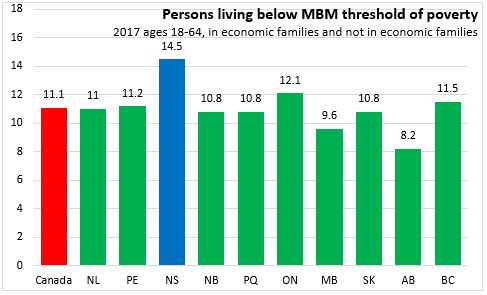
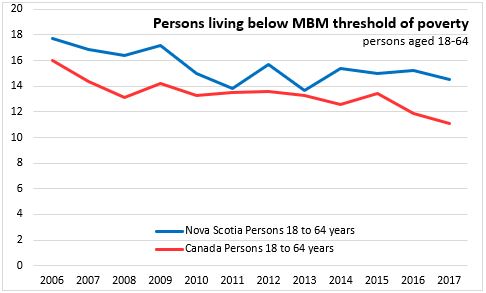
The share of Nova Scotia's population aged 18-64 living below the MBM threshold of poverty was also highest among provinces. Although there has been modest improvements over the past year, these gains have not kept pace with the national average.
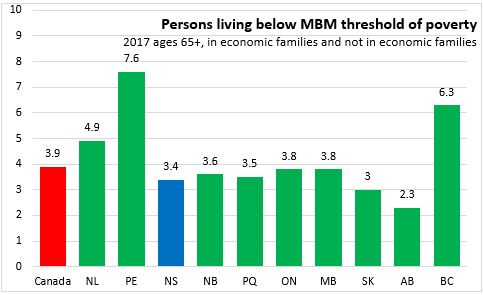
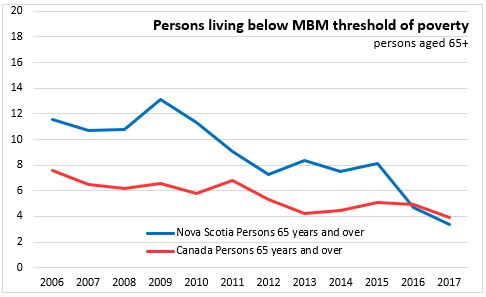
The share of senior citizens (aged 65+) living below the MBM threshold of poverty is much lower than it is for other age cohorts. Only 3.4 per cent of Nova Scotia's seniors reported incomes below the MBM threshold of poverty, below the national average of 3.9 per cent. The share of Nova Scotia seniors living below the MBM has declined over the past two years.
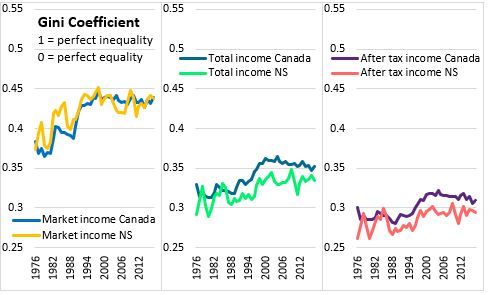
Gini coefficient of income distribution
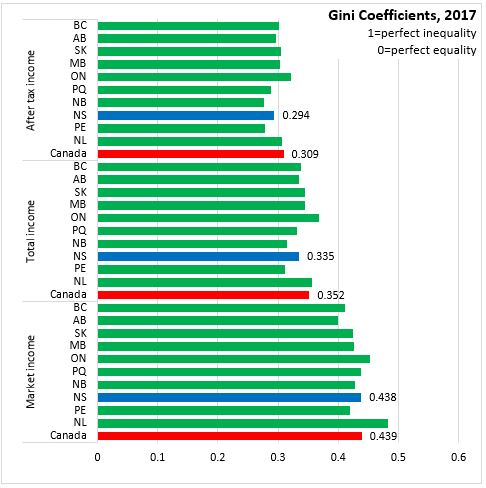
The Canadian Income Survey also reports the Gini coefficient measure of income distribution. Gini coefficients range between zero (representing perfect equality in which all individuals have the same income) and one (representing perfect inequality in which only one person has all the income while others have none). A higher Gini coefficient means greater income inequality.
Gini coefficients can be measured for market income, total income (market income plus transfers) and after tax income (total income less taxes).
Measured by market income, Nova Scotia has a similar income distribution as the national average. However, after factoring government transfers (which are concentrated among those with less income), Nova Scotia's total income Gini coefficient is less than the national average. Likewise, Nova Scotia's after tax Gini coefficient is lower than the national average.
From 1976 until the 1990s, market income inequality increased in Canada as well as in Nova Scotia. Since then, market income inequality has stated stable while total income and after tax income inequality has declined.
The Canadian Income Survey estimates are based on probability samples and are therefore subject to sampling variability. As a result, estimates will show more variability than trends observed over longer time periods.
Sources: Statistics Canada, Canadian Income Survey:
Table 11-10-0134-01 Gini coefficients of adjusted market, total and after-tax income
Table 11-10-0135-01 Low income statistics by age, sex and economic family type
Table 11-10-0136-01 Low income statistics by economic family type
Table 11-10-0190-01 Market income, government transfers, total income, income tax and after-tax income by economic family type