For additional information relating to Daily Stats or any of our products, please contact:
View the Archive..April 10, 2026LABOUR FORCE SURVEY, MARCH 2026 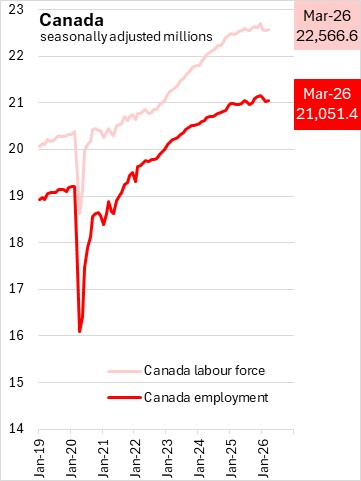
 &nb...
View complete article..
April 10, 2026LABOUR MARKET TRENDS, MARCH 2026 March labour force survey results reflect the period from March 15 to 21, 2026.
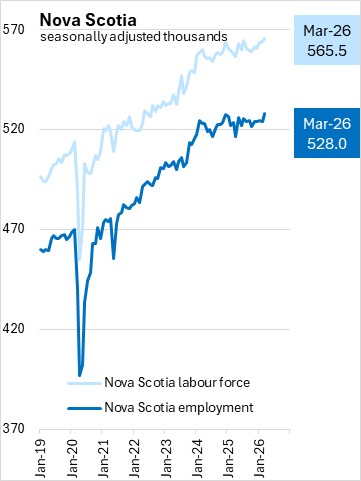
Ages 15+ (March 2026 vs February 2026, seasonally adjusted)
Nova Scotia's seasonally adjusted employment increased by 3,900 (+0.7%) to 528,000 in March. This follows a decline of 0.1% (-600) in February.
The change in employment reflected a decrease for full-time jobs (-1,200), offset by higher part-time employment (+5,100). Note that changes in full-ti ...
View complete article..
April 10, 2026LABOUR FORCE SURVEY: VISIBLE MINORITIES, MARCH 2026 The Labour Force Survey asks respondents about whether they identify with visible minority categories (as used in the Census): White, South Asian (e.g., East Indian, Pakistani, Sri Lankan), Chinese, Black, Filipino, Arab, Latin American, Southeast Asian (e.g., Vietnamese, Cambodian, Laotian, Thai), West Asian (e.g., Iranian, Afghan), Korean, Other.
March 2026 (3 month moving average, unadjusted)
Nationally, the unemployment rate for those who identify&nbs...
View complete article..
April 10, 2026US CONSUMER PRICE INDEX, MARCH 2026 Please note that October 2025 inflation was not published due to the US government shut down.
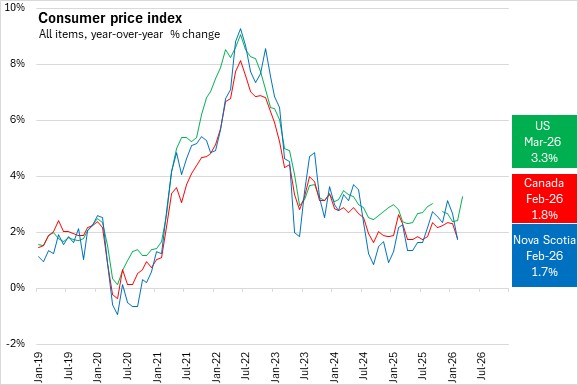
The United States Consumer Price Index (not seasonally adjusted) for All Urban Consumers increased 3.3% year-over-year in March 2026, up from the 2.4% year-over-year pace in February 2026.
Compared to March 2025, the US energy p...
View complete article..
April 09, 2026HOUSING ECONOMIC ACCOUNTS, 2025 Statistics Canada has released housing economic accounts (HEA) for 2025, which provides a macroeconomic perspective on housing assets that represent the physical structures and supported services in residential real estate. The HEA includes investment and net capital stock by industry and type of housing.
Residential capital stock and investment
Nova Scotia's residential capital stock amounted to $131,629 per household in 2025 (measured in constant dollars). Th ...
View complete article..
Top