For additional information relating to Daily Stats or any of our products, please contact:
View the Archive..October 22, 2026EMPLOYMENT INSURANCE, AUGUST 2026 Monthly (August vs July 2026, seasonally adjusted regular beneficiaries)
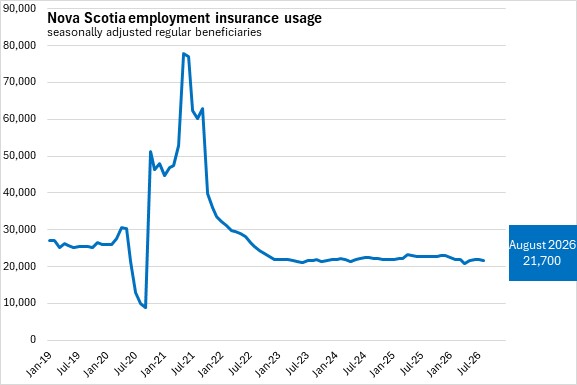
In August 2026 there were 21,700 Nova Scotians in receipt of regular employment insurance benefits (seasonally adjusted). Nova Scotia's seasonally adjusted regular employment insurance usage in August decreased by 100 (-0.5%) from July.
There were 541,3 ...
View complete article..
October 22, 2026NEW HOUSING PRICE INDEX, SEPTEMBER 2026 Monthly (September vs August 2026)
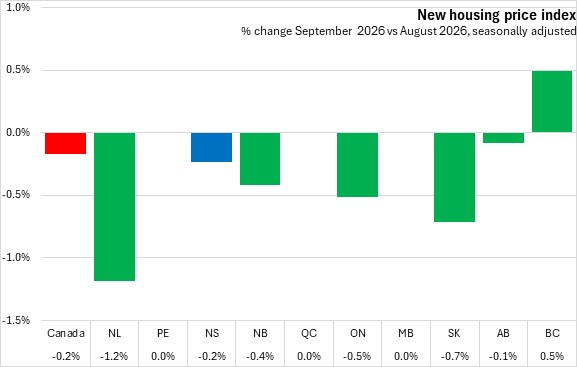
New housing prices in Nova Scotia were down 0.2% from August to September 2026. Nationally the price of new houses also declined 0.2%, with declines in six provinces led by Newfoundland and Labrador. The only gain was reported in British Columbia.
Year-over-year (September 2026 vs Septembe...
View complete article..
October 21, 2026
BUILDING CONSTRUCTION, AUGUST 2026
Monthly (August vs July 2026, seasonally adjusted)
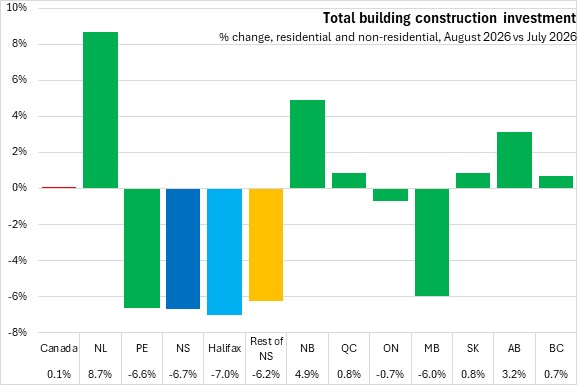
Investment in Nova Scotia building construction decreased 6.7% in August 2026 to $473.7million, the fastest decline among provinces. Halifax monthly building construction was down 7.0% to $251.3 million while outside of Halifax building construction was down 6.2% to $222.5 million. Nationall...
View complete article..
October 21, 2026
UK CONSUMER PRICE INDEX, SEPTEMBER 2026
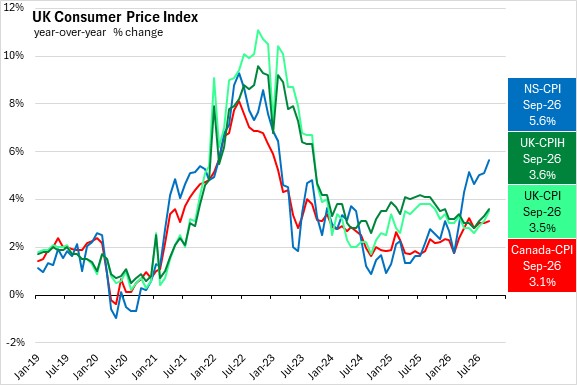
UK Consumer Price Index including owner-occupiers' housing costs (CPIH) rose 3.6% year-over-year in September 2026, up 0.3 percentage points from its year-over-year in August 2026. The UK CPI index was up 3.5% year-over-year in September 2026, up 0.4 percentage points from year-over-year in August.
Owner occupiers' housing costs account for roughly 18% of th ...
View complete article..
October 20, 2026
TERANET-NATIONAL BANK HOUSE PRICE INDEX, SEPTEMBER 2026
Monthly (September vs August 2026, seasonally adjusted)
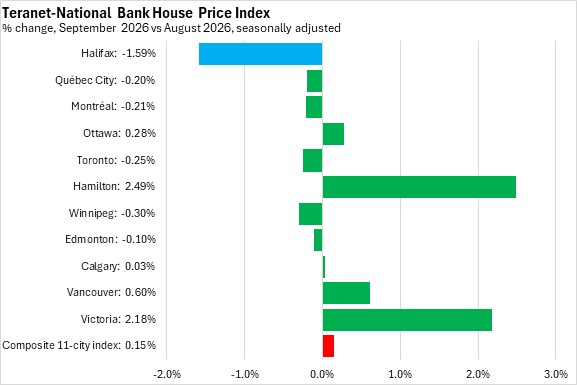
Halifax resale home prices, as measured by the Teranet-National Bank House Price Index (seasonally adjusted), declined 1.59% from August to September 2026, the fastest decline among cities.
The composite 11-city index of resale house prices rose 0.15% d...
View complete article..
Top

