For additional information relating to Daily Stats or any of our products, please contact:
View the Archive..July 31, 2026NEW CONDOMINIUM APARTMENT PRICE INDEX, Q2 2026 Compared with Q2 2025, Halifax's new condominium prices were down 0.1%. Condo prices declined 4.0% in the 9-city composite index with seven cities reporting declines, led by Toronto. The largest gain was reported in Québec City.
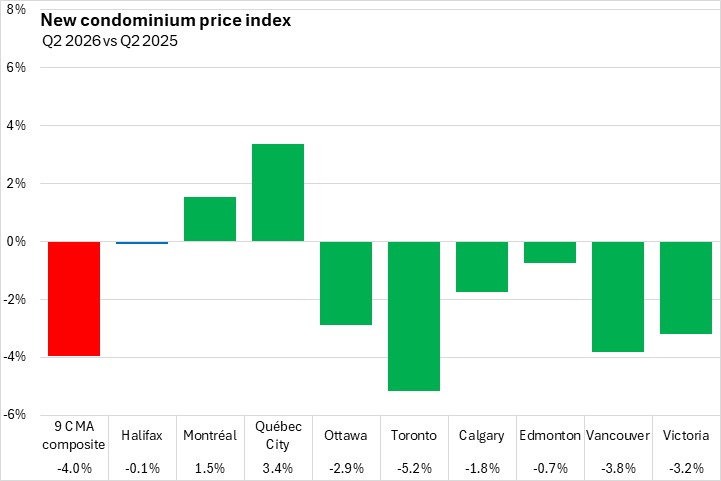
Compared with the average of 2017, new condominium prices in the Halifax market were 20.7% higher as ...
View complete article..
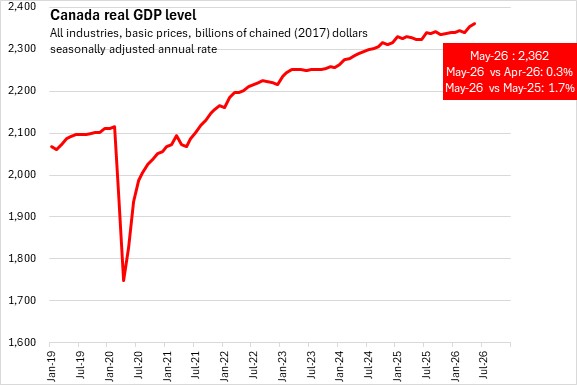
July 31, 2026CANADA GDP BY INDUSTRY, MAY 2026 Month-over-month (May 2026 vs April 2026)
Real Gross Domestic Product (GDP) in Canada was up by 0.3% in May 2026, with gains in service and goods-producing industries.
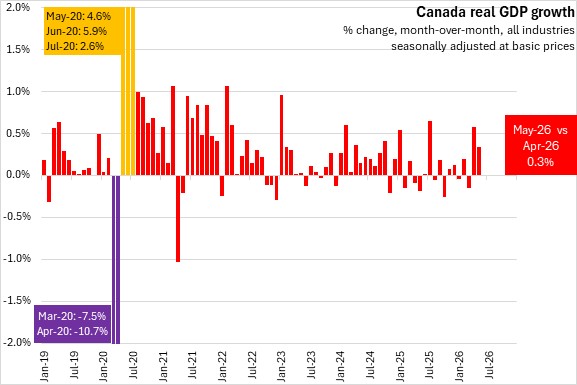
Real GDP in Canada's goods-producin ...
View complete article..
July 31, 2026BANK OF JAPAN MONETARY POLICY The Policy Board of the Bank of Japan kept its uncollateralized overnight call rate around 1.0%.
Japan’s economy saw moderate recovery despite the conflict in the Middle East. Higher crude oil prices have been slowing economic activity and are expected to reduce corporate profits and household’s real income through deterioration in terms of trade. However, government initiatives that aim to reduce household burden of higher energy prices continue to provide suppo...
View complete article..
July 30, 2026PAYROLL EMPLOYMENT AND AVERAGE WEEKLY EARNINGS, MAY 2026 Monthly (May 2026 vs April 2026, seasonally adjusted)
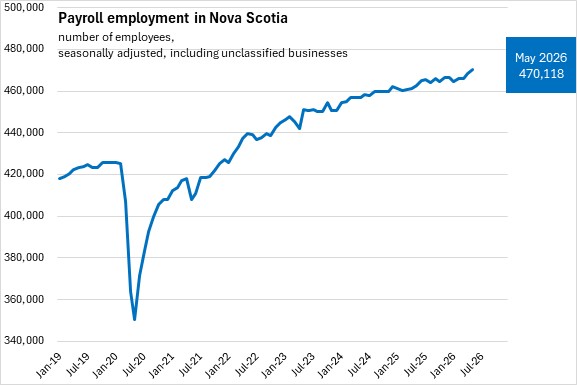
Nova Scotia had 470,118 payroll employees in May 2026, up 0.32% (+1,488) compared to April 2026. Canada had 18.39 million employees, up 0.13% from April 2026 with gains in eight provinces. The fastest gains were reported in Prince Edward Island and Newfoundland and Labrador. Declines were re...
View complete article..
July 30, 2026JOB VACANCIES, MAY 2026 Monthly (May vs April 2026, seasonally adjusted)
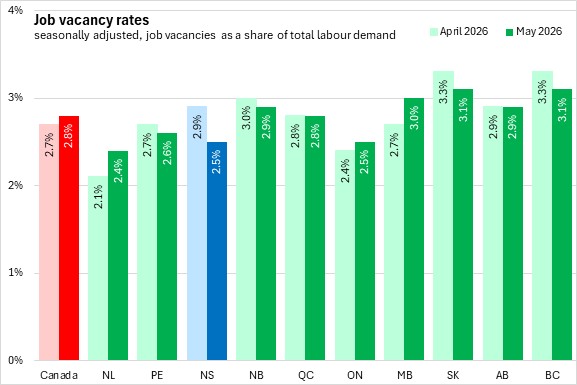
Nova Scotia had 12,345 job vacancies in May 2026, down 8.1% (-1,095 vacancies) from April 2026.
Canadian employers were actively recruiting for 495,715 positions in May with the national job vacancy rate of 2.8%, up 0.1 percentage points from last month. Among provinces, five...
View complete article..
Top