The Economics and Statistics Division maintains archives of previous publications for accountability purposes, but makes no updates to keep these documents current with the latest data revisions from Statistics Canada. As a result, information in older documents may not be accurate. Please exercise caution when referring to older documents. For the latest information and historical data, please contact the individual listed to the right.
<--- Return to Archive
For additional information relating to this article, please contact:
February 12, 2024SOCIOECONOMIC PROFILE OF 2SLGBTQ+ CANADIANS, 2019/2021 Statistics Canada has released new information on the socioeconomic profile of 2SLGBTQ+ Canadians. These data are drawn from the 2019 and 2021 iterations of the Canadian Community Health Survey.
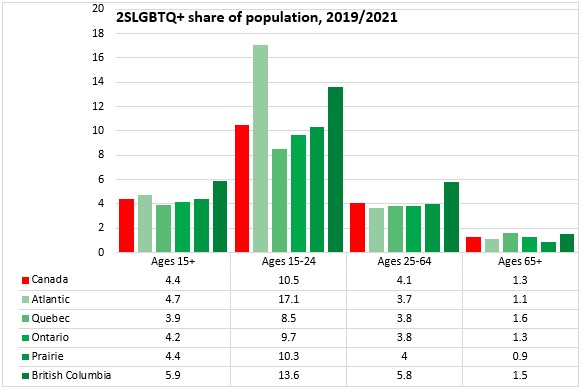
In Canada, 4.4% of the adult population (aged 15+) identifies as 2-spirited, lesbian, gay, bisexual, trans, queer or plus (2SLGBTQ+; data are not yet collected on populations that identify as intersex).
These proportions are higher in Atlantic Canada (4.7%) and British Columbia (5.9%). Québec has the lowest share of the population that reports identifying as 2SLGBTQ+ (3.9%).
The proportion of the population aged 15-24 that identify as 2SLGBTQ+ is notably larger, particularly in Atlantic Canada and British Columbia. The portion of older Canadians (aged 65+) identifying as 2SLGBTQ+ was notably smaller.
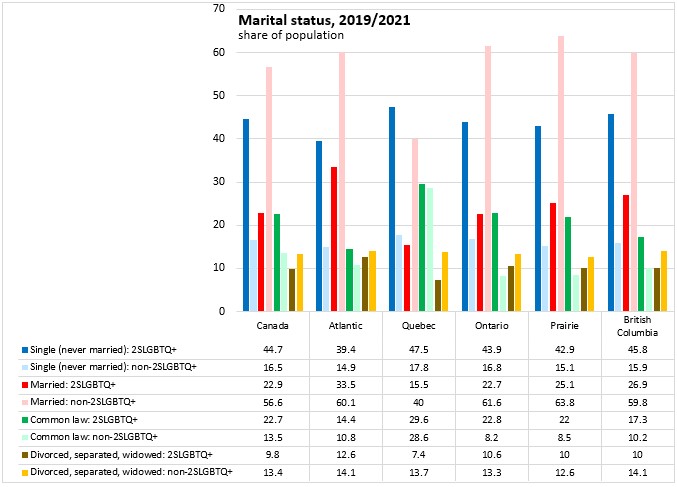
Across Canada, a higher portion of the 2SLGBTQ+ population were single (never married) or in common-law relationships while a higher portion of the non-2SLGBTQ+ population were married. Marriage was more common than the national averages for both population groups in Atlantic Canada.
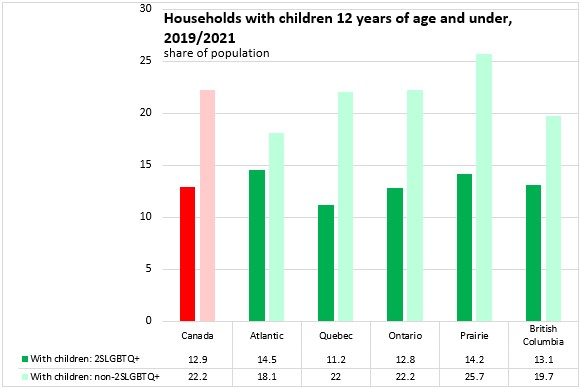
Across Canada 12.9% of the 2SLGBTQ+ population lived in households with a child aged 12 or under (22.2% for the non-2SLGBTQ+ population). A higher portion of 2SLGBTQ+ households in Atlantic Canada reported living with a child 12 years or age or younger.
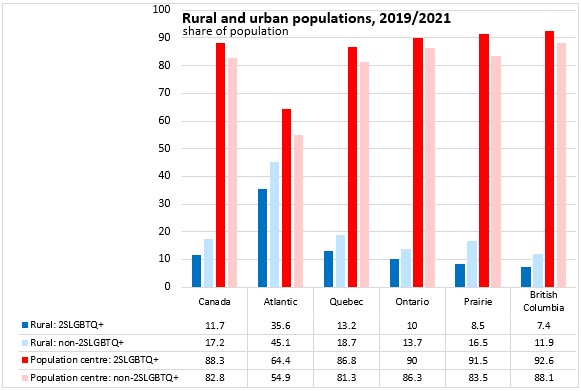
Across Canada, 11.7% of the 2SLGBTQ+ population lived in a rural area while 88.3% lived in a population centre. In every region, the 2SLGBTQ+ population was more concentrated in population centres than in rural areas. In Atlantic Canada, rural population shares were higher for both 2SLGBTQ+ and non-2SLGBTQ+ populations.
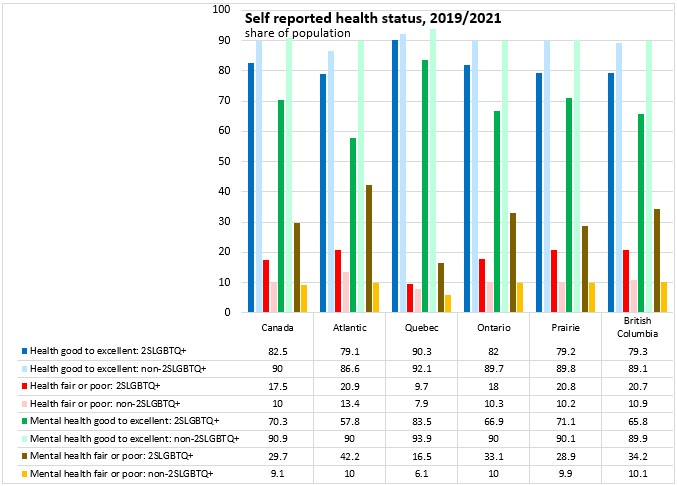
When asked about perceived health status, members of the 2SLGBTQ+ population were less likely to report good, very good or excellent general health and more likely to report fair or poor general health than the non-2SLGBTQ+ population. This gap was narrowest in Québec.
The gaps in perceived health were more acute when focusing on perceived mental health, where 2SLGBTQ+ populations were less likely to report good to excellent mental health and substantially more likely to report fair or poor mental health (particularly in Atlantic Canada).
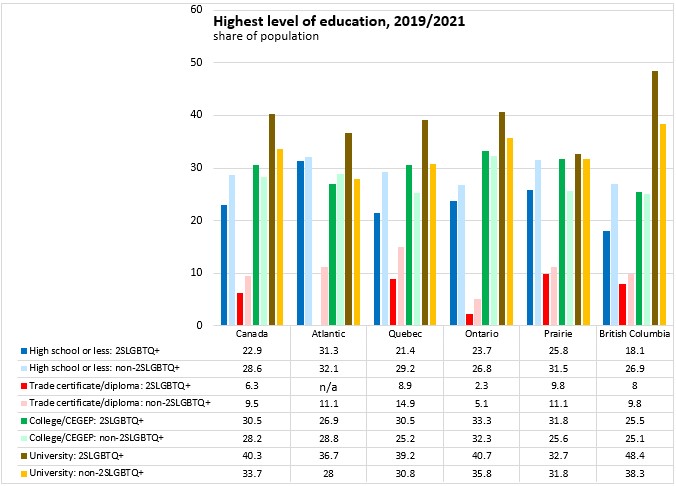
Across Canada, 2SLGBTQ+ populations were more likely to have a university (bachelor or higher) degree or a college/CEGEP education than the non-2SLGBTQ+ population. One exception is in Atlantic Canada where the non-2SLGBTQ+ population had a higher portion with college education than the 2SLGBTQ+ population.
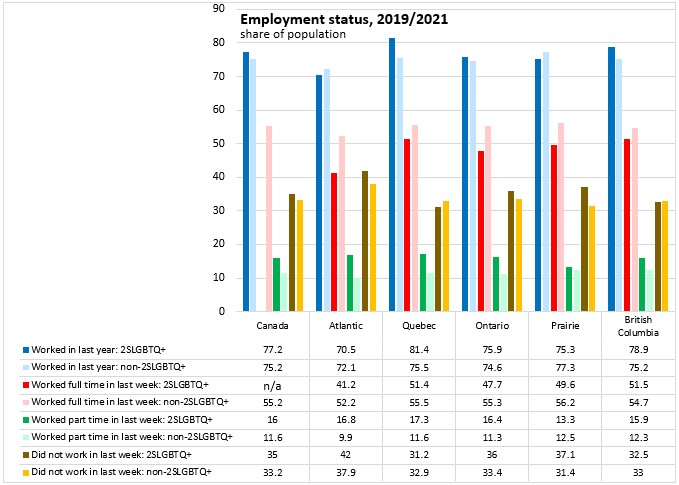
Across Canada, those among the 2SLGBTQ+ population were more likely to have worked in the past year than the non-2SLGBTQ+ population. However, this was not the case in Atlantic Canada or the prairie provinces.
When asked about recent work (in the last week), 2SLGBTQ+ respondents in every region were less likely to report full time work than the non-2SLGBTQ+ population.
Part time work in the last week was more prevalent among 2SLGBTQ+ populations than among the non-2SLGBTQ+ populations in every region.
Not working at all in the last week was more commonly reported among 2SLGBTQ+ populations (compared to non-2SLGBTQ+ residents) in Atlantic Canada, Ontario and the prairie provinces, but not in Québec or British Columbia.
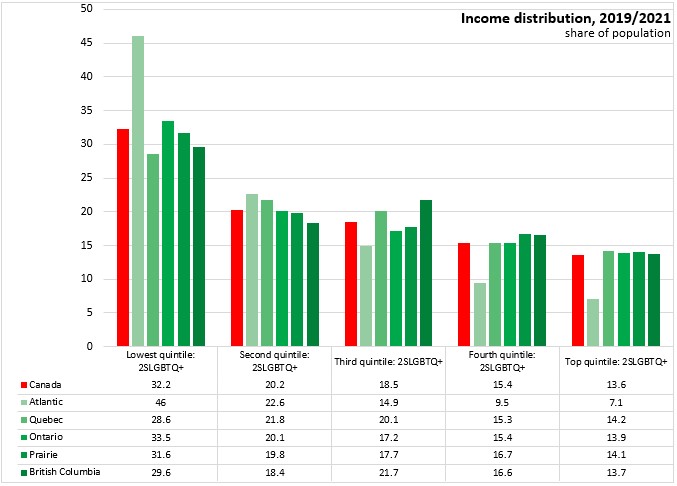
Across the entire country, an income quintile should represent 20% of the population. However, for the 2SLGBTQ+ population, a notably higher share of the population (32.2% nationally) were in the lowest income quintile. This was particularly the case in Atlantic Canada, which may reflect the higher proportion of 2SLGBTQ+ respondents among those aged 15-24 (who typically report lower incomes).
Across Canada, there were notably lower portions of the 2SLGBTQ+ population in the two highest income quintiles.
Source: Statistics Canada. Table 13-10-0874-01 Socioeconomic characteristics of the 2SLGBTQ+ population, 2019 to 2021
<--- Return to Archive