The Economics and Statistics Division maintains archives of previous publications for accountability purposes, but makes no updates to keep these documents current with the latest data revisions from Statistics Canada. As a result, information in older documents may not be accurate. Please exercise caution when referring to older documents. For the latest information and historical data, please contact the individual listed to the right.
<--- Return to Archive
For additional information relating to this article, please contact:
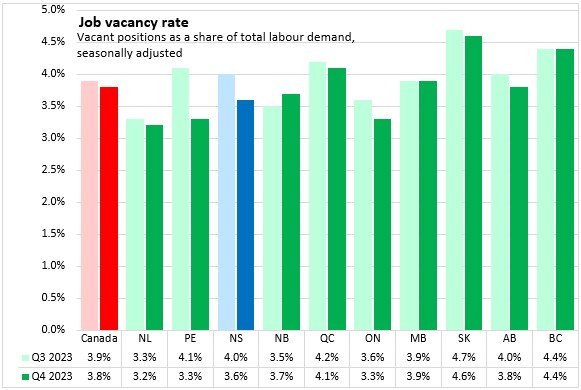
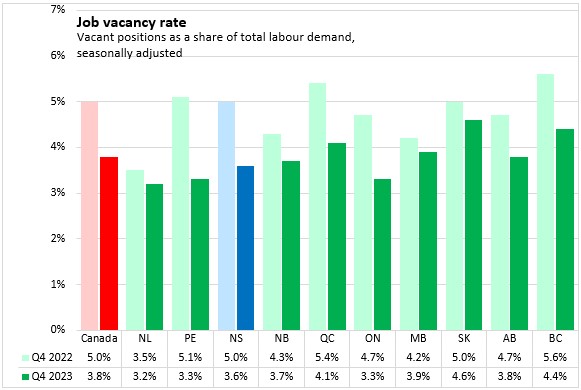
March 19, 2024JOB VACANCIES AND WAGES, Q4 2023 Nova Scotia's job vacancy rate (seasonally adjusted) was 3.6% in Q4 2023, representing 15,940 job vacancies. Nova Scotia's job vacancy rate declined from 4.0% in Q3 2023.
Nationally, the job vacancy rate was 3.8%, down 0.1 percentage points from Q3. The highest job vacancy rate was reported in Saskatchewan while the lowest job vacancy rates were in Newfoundland and Labrador.
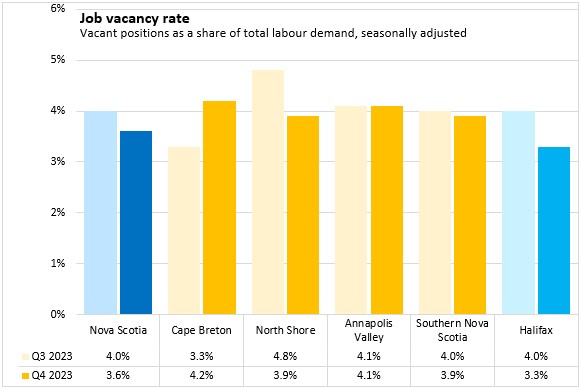
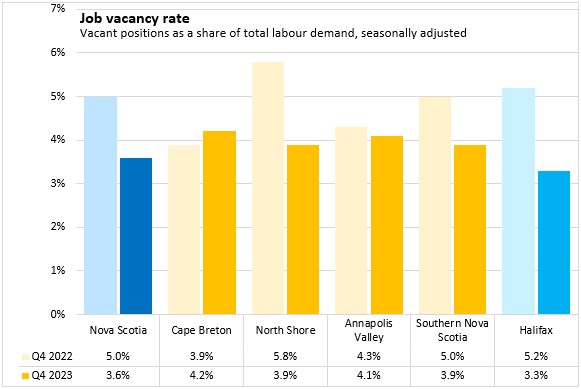
In Nova Scotia, Cape Breton reported the highest job vacancy rate in Q4 2023 at 4.2%. Halifax reported the lowest job vacancy rate at 3.3%.
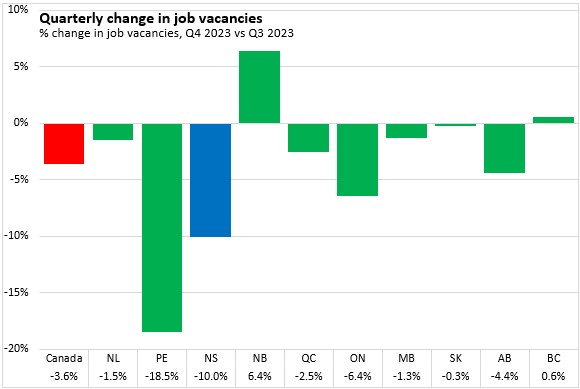
From Q3 to Q4 2023, the number of job vacancies in Nova Scotia declined by 10.0% - the second steepest decline after Prince Edward Island. Nationally, job vacancies were down 3.6% with declines in all provinces except New Brunswick and British Columbia.
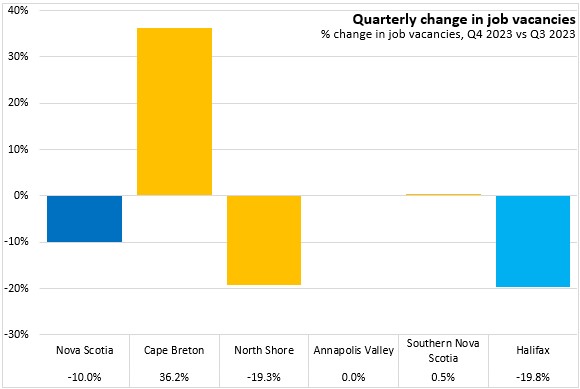
In Nova Scotia, job vacancies were down the most in the Halifax and North Shore economic regions. Cape Breton reported the largest increase in job vacancies in the last quarter.
Compared with Q4 2022, Nova Scotia's job vacancy rate was down by 1.4 percentage points. All provinces reported declining job vacancy rates from Q4 2022 to Q4 2023.
Within Nova Scotia, all regions except Cape Breton reported lower job vacancy rates from Q4 2022 to Q4 2023.
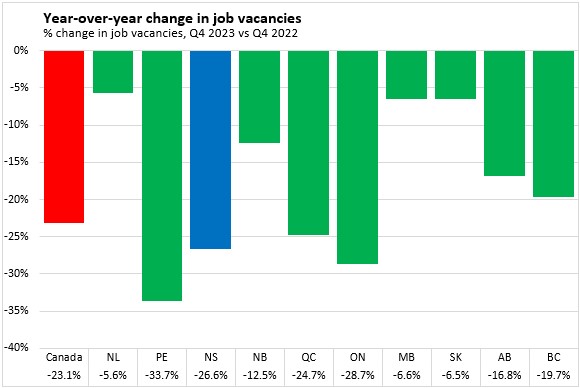
The number of job vacancies declined by 26.6% in Nova Scotia from Q4 2022 to Q4 2023. Nationally, the number of job vacancies fell by 23.1% with declines in all provinces. Prince Edward Island reported the largest percentage reduction in job vacancies while Newfoundland and Labrador reported the least decline.
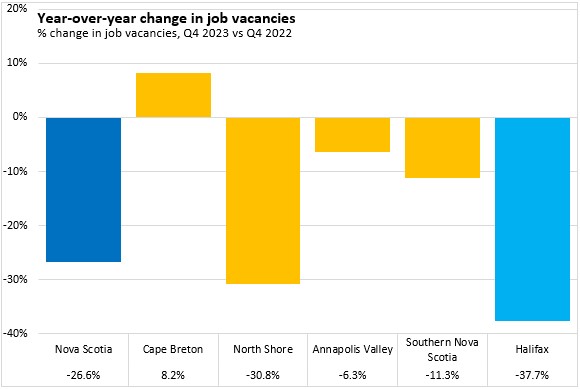
Among Nova Scotia's economic regions, Halifax reported the largest year-over-year decline in job vacancies from Q4 2022 to Q4 2023. Cape Breton reported the only increase in job vacancies over the last year.
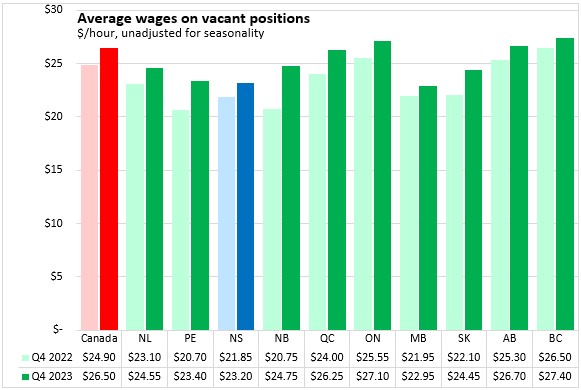
The average hourly wage offered on vacant positions (unadjusted for seasonality) was $23.20 in Nova Scotia during Q4 2023, this was up from $21.85 a year earlier. All provinces reported higher average hourly wages on vacany positions compared with Q4 2022.
Average hourly wages on vacant positions were $26.50 nationally, with the highest values in British Columbia and Ontario. Manitoba reported the lowest average wages on vacant positions in Q4 2023.
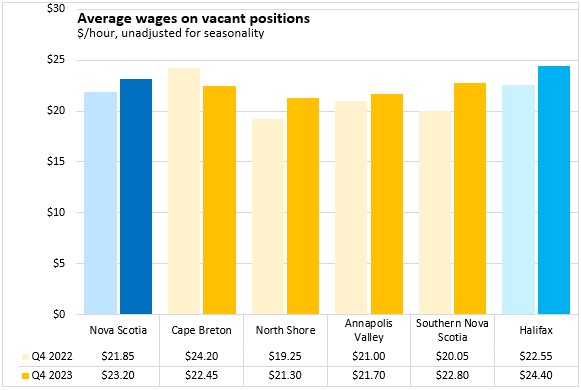
Across Nova Scotia, average hourly wages on vacant positions were up for all economic regions except Cape Breton. Q4 2023 wages were highest in Halifax and lowest in the North Shore economic region.
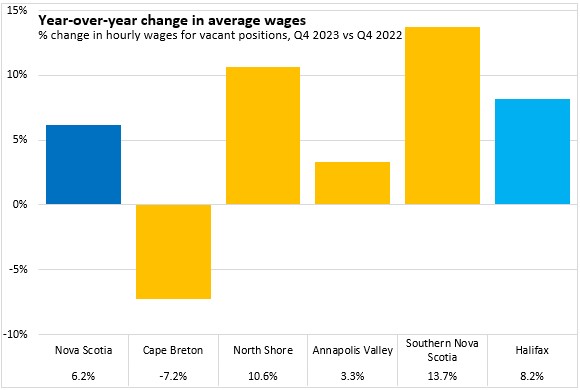
Average wages on vacant positions grew by 6.2% in Nova Scotia from Q4 2022 to Q4 2023. Nationally, average wages on vacant positions were up 6.4% over this period with gains in all provinces. New Brunswick reported the largest increase in average wages on vacant positions while British Columbia reported the slowest growth.

Southern Nova Scotia reported the fastest year-over-year growth in average wages for vacant positions. Cape Breton reported the only decline among Nova Scotia's economic regions.
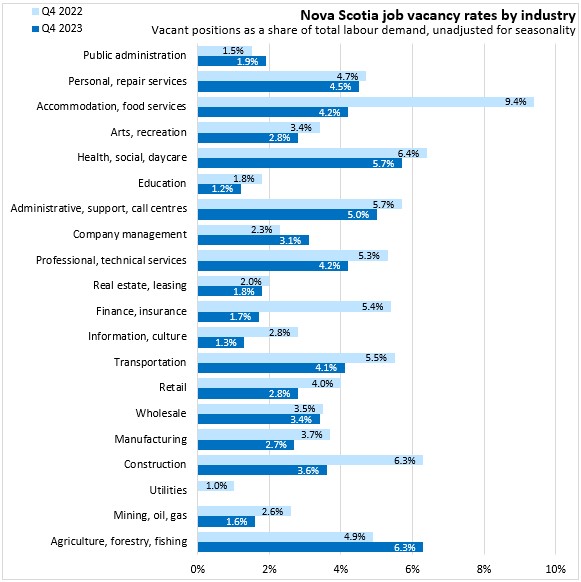
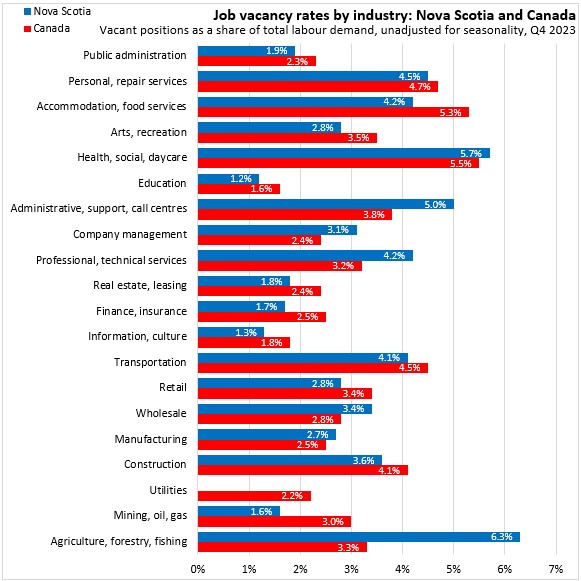
In unadjusted job vacancy rates by industry in Nova Scotia, agriculture/forestry/fishing and health/social/daycare reported the highest job vacancy rates in Q4 2023. Education and information/culture reported the lowest job vacancy rates. (Note: no data were available for utilities in Q4 2023).
Compared with Q4 2022, there were notable declines in job vacancy rates for Nova Scotia's accommodation/food service, finance/insurance and construction industries. Company management, public administration and agriculture/forestry/fishing were the only industries in Nova Scotia to report rising job vacancy rates over the last year.
The number of job vacancies remained highest in health/social/daycare in Nova Scotia in Q4 2023.
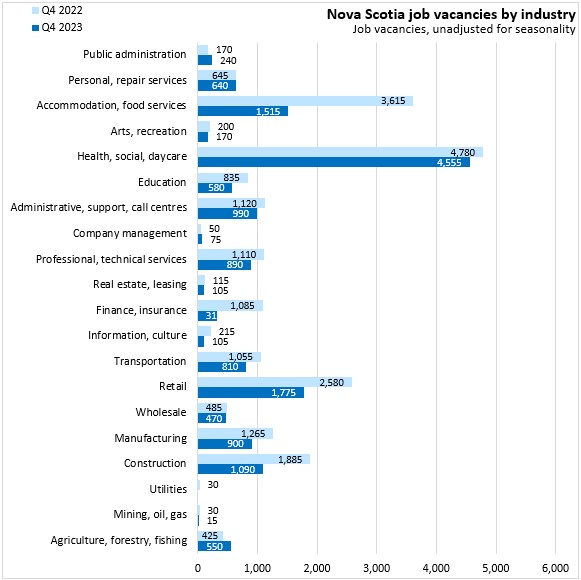
Most industries in Nova Scotia reported a lower number of job vacancies, comparing Q4 2023 against Q4 2022. Across all industries, job vacancies were down 27.2% in unadjusted results. The steepest percentage declines were observed in finance/insurance, accommodation/food services, information/culture and mining. Only public administration, company management and agriculture/forestry/fishing reported increases in job vacancies over this period.

Compared with national averages by industry, Nova Scotia's job vacancy rates were lower for all reporting industries except health/social/daycare, administrative/support/call centres, company management, professional/technical services, wholesale trade, manufacturing and agriculture/forestry/fishing.
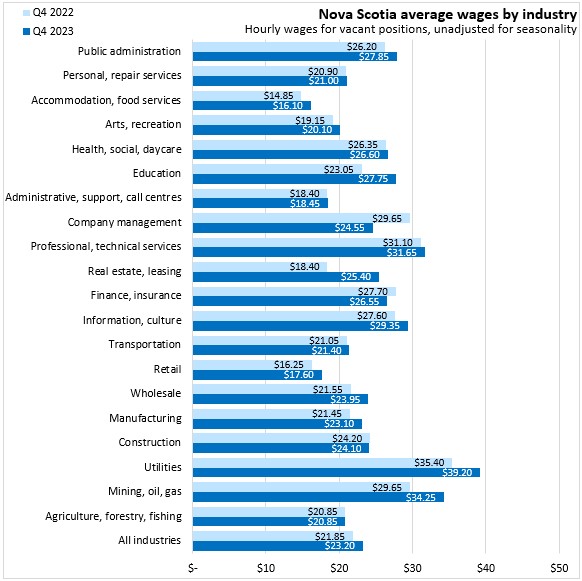
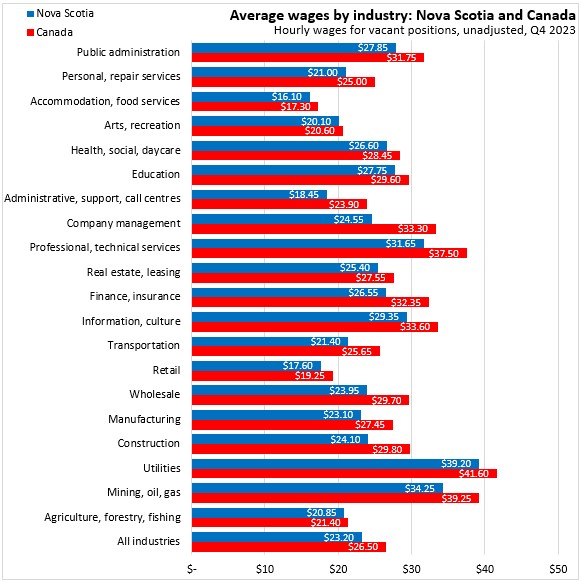
In Q4 2023, average hourly wages offered on vacant positions in Nova Scotia were highest for mining, utilities and professional/technical services. Hourly wages for vacant positions in Nova Scotia were lowest for accommodation/food services and retail.
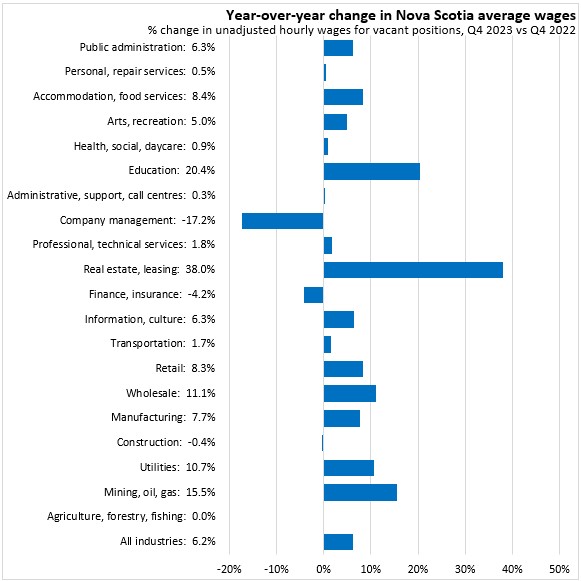
From Q4 2022 to Q4 2023, average hourly wages offered on vacant positions in Nova Scotia were up for most industries (exceptions: company management, finance/insurance, construction, agriculture/forestry/fishing).
Growth in average hourly wages for vacant positions was strongest for real estate/leasing, comparing Q4 2023 against Q4 2022. Company management reported the steepest percentage decline in hourly wages offered on vacant positions over this period.
Compared with national averages, average hourly wages on vacant Nova Scotia positions were lower for all industries. The gaps were largest in company management and smallest for arts/recreation and agriculture/forestry/fishing.
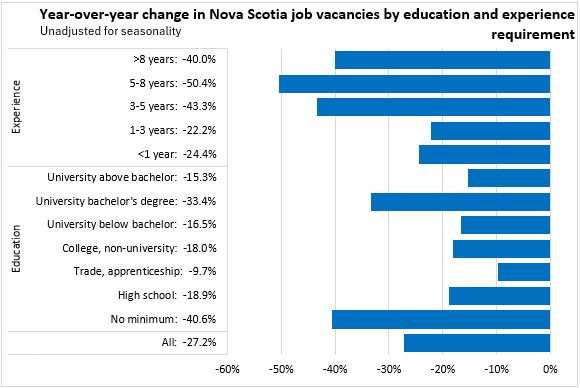
The majority of job vacancies in in Q4 2023 required no more than a high school education and less then a year of experience.

Comparing Q4 2023 against Q4 2022, job vacancies were down for all categories of educational or experience requirements. The largest pecentage declines were for positions requiring between 5 and 8 years of experience as well as for those with no minimum educational requirement.
Average hourly earnings for vacant positions rise based on increased experience and educational requirements.
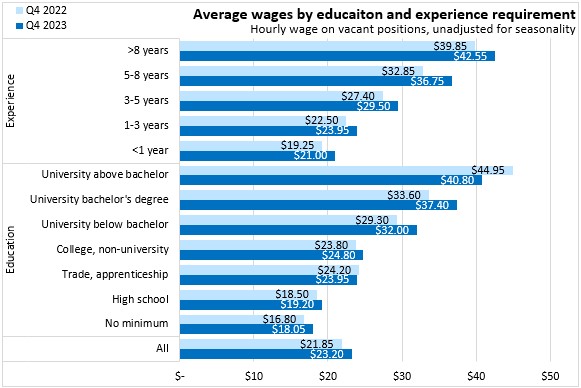
Over the last year (comparing Q4 2023 against Q4 2022), average hourly wages were up most for positions requiring between 5 and 8 years of experience as well as for those requiring a university bachelor's degree. Wages were down for vacant positions requiring a university degree above a bachelor's level as well as for positions requiring trades or apprenticeship certifications.

Trends

Following the pandemic (when job vacancy data were not collected), there was a substantial rise in Nova Scotia's job vacancy rate. The national job vacancy rate also increased over this time. After peaking in early 2022, vacancy rates in both Nova Scotia and across Canada have declined steadily.

The number of job vacancies in Nova Scotia peaked at 22,190 (seasonally adjusted) in Q2 2022. Since then, the number of vacancies has fallen by over 6,000 with notable declines in the North Shore, Annapolis Valley and Halifax economic regions. Vacancies have been more stable in Southern Nova Scotia and Cape Breton.
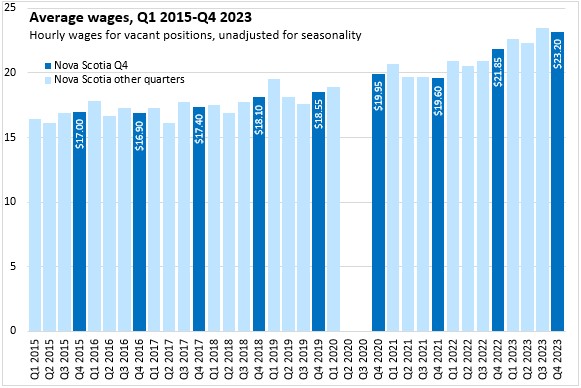
Growth in average hourly earnings for vacant positions across Nova Scotia has accelerated in the last two years.
Notes: Data collection activities were suspended from the start of the pandemic in March to September 2020. There remains a gap in the dataset for this survey.
Source: Statistics Canada. Table 14-10-0398-01 Job vacancies, payroll employees, and job vacancy rate, by economic regions, quarterly, adjusted for seasonality; Table 14-10-0441-01 Job vacancies, payroll employees, job vacancy rate, and average offered hourly wage by economic regions, quarterly, unadjusted for seasonality; Table 14-10-0442-01 Job vacancies, payroll employees, job vacancy rate, and average offered hourly wage by industry sub-sector, quarterly, unadjusted for seasonality; Table 14-10-0443-01 Job vacancies, proportion of job vacancies and average offered hourly wage by occupation and selected characteristics, quarterly, unadjusted for seasonality; Table 14-10-0444-01 Job vacancies and average offered hourly wage by occupation (unit group), quarterly, unadjusted for seasonality
<--- Return to Archive