The Economics and Statistics Division maintains archives of previous publications for accountability purposes, but makes no updates to keep these documents current with the latest data revisions from Statistics Canada. As a result, information in older documents may not be accurate. Please exercise caution when referring to older documents. For the latest information and historical data, please contact the individual listed to the right.
<--- Return to Archive
For additional information relating to this article, please contact:
March 26, 2024HOUSEHOLD ACTUAL FINAL CONSUMPTION, 2022 Statistics Canada's system of macroeconomic accounts measures household final consumption based on purchases of final goods and services from private market sources. Household actual final consumption expenditures expand this to include the value of goods and services provided to households in kind by governments and non-profit institutions.
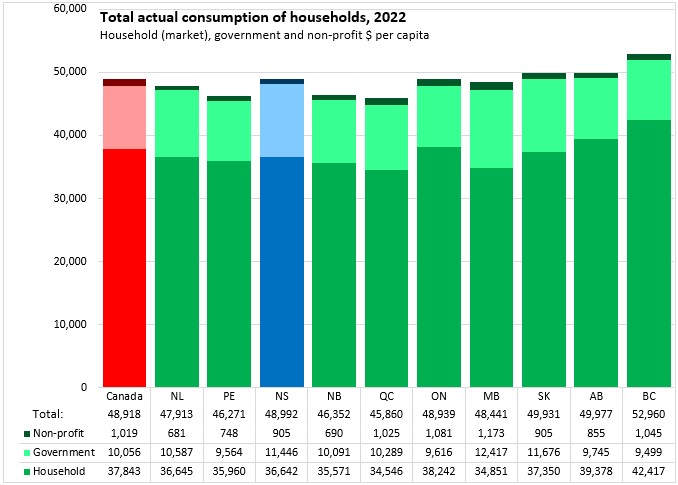
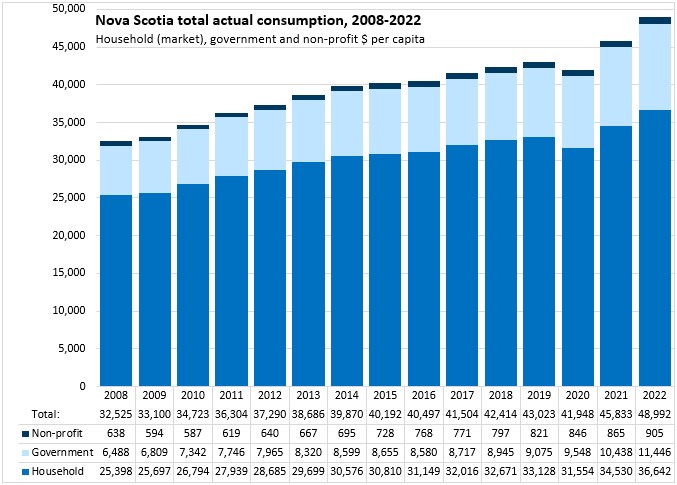
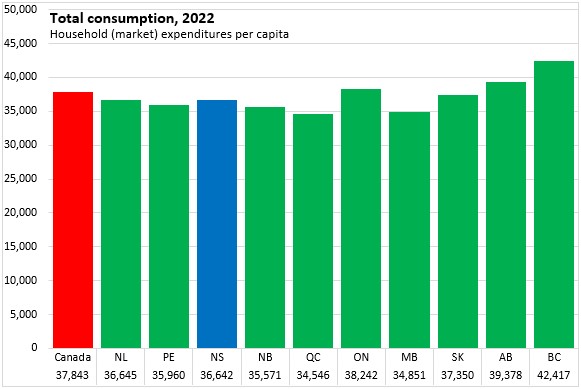
In 2022, household final consumption expenditures on market goods and services amounted to $36,642 per capita in Nova Scotia. Nationally, per capita household final consumption expenditures on market goods and services were $37,843 - ranging from a high of $42,417 in British Columbia to a low of $34,546 in Québec.
The value of government services added $11,446 per capita to household consumption in Nova Scotia while non-profit institutions added $905 per capita. Across Canada, government expenditures added $10,056 to per capita household consumption while non-profits added $1,019. Government expenditures for households was highest in Manitoba at $12,417 per capita (followed by Nova Scotia) and lowest in British Columbia at $9,499 per capita. Non-profit expenditures for households were highest in Manitoba ($1,173 per capita) and were lowest in Newfoundland and Labrador ($681 per capita).
Household actual final consumption in Nova Scotia (including market, government and non-profit) amounted to $48,992 per capita, which was $74 more than the national average of $48,918 per capita. The highest household actual final consumption was in British Columbia at $52,960 and lowest in Quebec at $45,860.
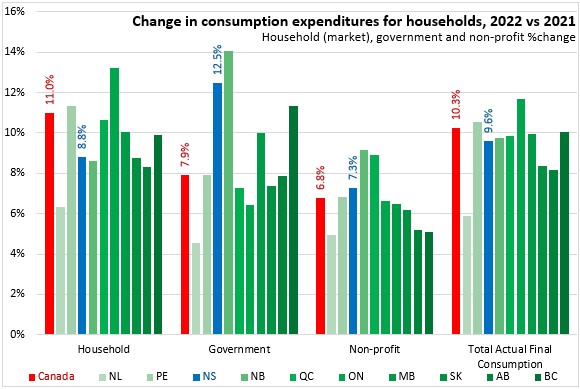
Compared with 2021, the value of total actual household consumption expenditures increased by 9.6% in Nova Scotia and by 10.3% nationally (fastest growth: Ontario, slowest: Newfoundland and Labrador). There was rapid growth for all three categories of actual final consumption expenditures in every province.
Household (market) consumptions expenditures grew fastest in Ontario and slowest in Newfoundland and Labrador. Government in-kind consumption expenditures grew fastest in New Brunswick (followed by Nova Scotia) and slowest in Newfoundland and Labrador. Non-profit consumption expenditures for households grew fastest in New Brunswick and slowest in Newfoundland and Labrador.
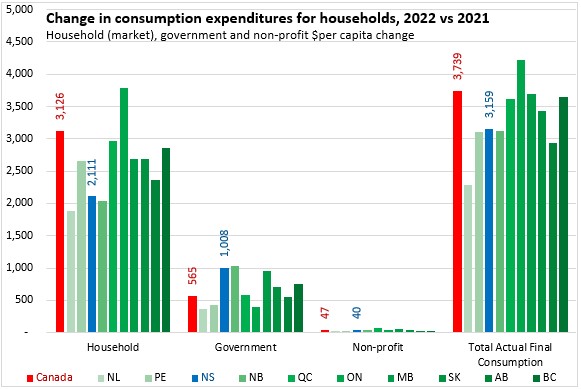
On a per capita basis, household (market) consumption accounts for the bulk of actual consumption growth, followed by government expenditures. Non-profit consumption growth contributed little to overall actual consumption growth.
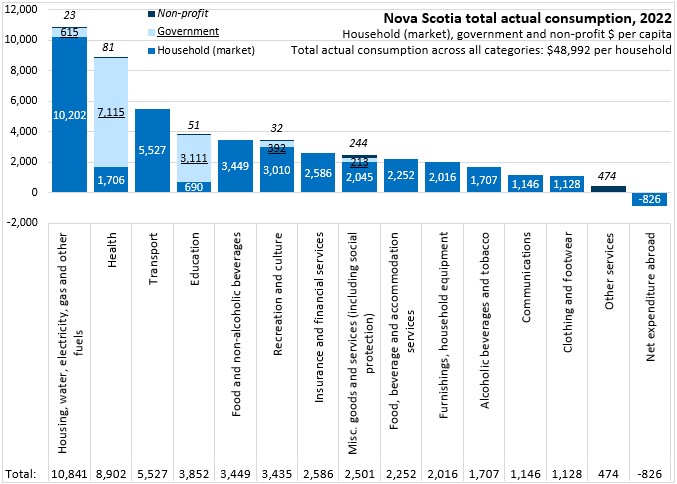
Looking across all household consumption categories in Nova Scotia, housing and utilities was the largest expenditure category. Most of these expenditures were market-based expenditures by households themselves, with small additions from government and non-profit expenditures on behalf of Nova Scotia households. Health care, transportation, education and food were the next largest categories of total actual household consumption. The bulk of health and education expenditures on behalf of Nova Scotia households were made by governments while food and transportation were entirely household expenditures. There were smaller government and non-profit contributions to recreation and culture expenditures as well as miscellaneous goods and services (including social protection). All the smaller categories of household final consumption, except other services, were made entirely by households. The other service category includes services offered by political parties, labour, professional, environmental protection organizations, and religious groups with expenditures only made by the non-profit sector.
Nova Scotia's actual consumption expenditure growth accelerated from 2016-2019 before declining during the first waves of COVID-19 in 2020. In 2021 and 2022, final actual consumption expenditure per capita rebounded strongly (including the effects of elevated inflation over this period).
Non-market expenditures that benefit households fall into a few different categories: health, education, recreation/culture, housing, miscellaneous goods and services (including social protection), and other services.
The largest non-market expenditures that benefit households were government expenditures on health. Health spending by governments is considerably larger than private, market-based expenditures on health care for households.
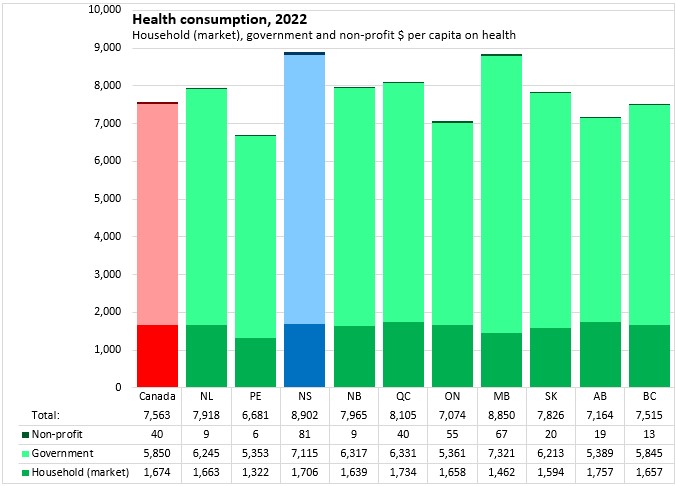
Nova Scotia's government expenditure for household health amounted to $7,115 per capita in 2022 - second highest in the country after Manitoba at $7,321. Nationally government health expenditures for households were $5,850 per capita. The lowest government expenditures for household health were in Prince Edward Island ($5,353 per capita), Ontario ($5,361 per capita) and Alberta ($5,389 per capita).
Non-profit expenditures on health for households were at $81 per capita in Nova Scotia, highest among the provinces. National non-profit health expenditures for households were $40 per capita in 2022 with the lowest values in the other Atlantic provinces.
Combining market, government and non-profit health expenditures for households, Nova Scotia had the highest household health expenditures per capita at $8,902 per capita with Prince Edward Island the lowest at $6,681 per capita.
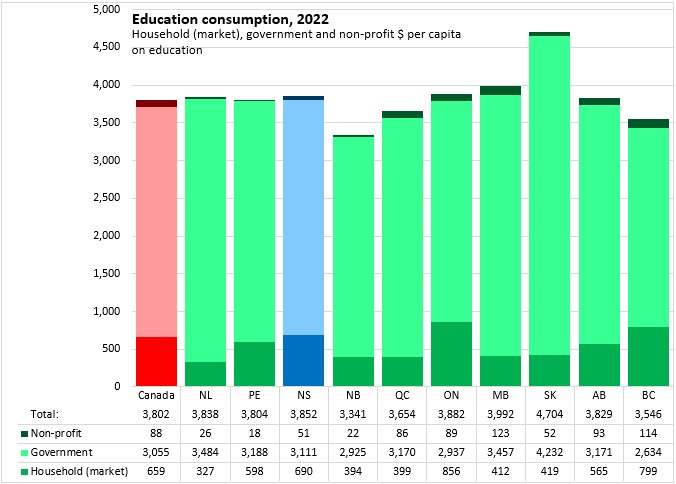
Education expenditures were the second largest category of non-market spending that benefitted households. Nova Scotia's government education expenditures for households were $3,111 per capita (considerably larger than the $690 per capita in market expenditures). National government education expenditures for households were $3,055 per capita with a high of $4,232 in Saskatchewan and a low of $2,634 in British Columbia.
As with health care, non-profit education expenditures for households were smaller at $88 per capita nationally and $51 per capita in Nova Scotia.
Household actual final consumption expenditures on education from all sectors were $3,852 in Nova Scotia for 2022, just above the national average of $3,802 per capita (highest value in Saskatchewan, lowest in New Brunswick).
The next three largest categories of non-market expenditures for households were miscellaneous (including social protection), other services, recreation/culture and housing/utilities.
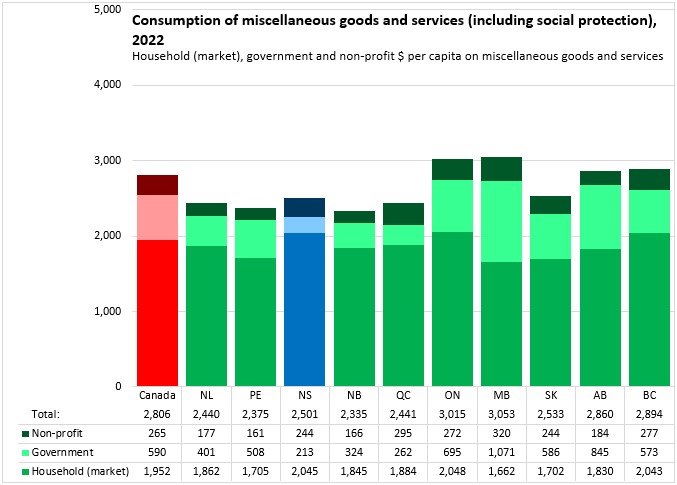
Government expenditures on miscellaneous/social protection amounted to $213 per capita in Nova Scotia in 2022 - the lowest among provinces ($590 per capita nationally) while non-profit expenditures amounted to $244 per capita in 2021 ($265 per capita nationally).
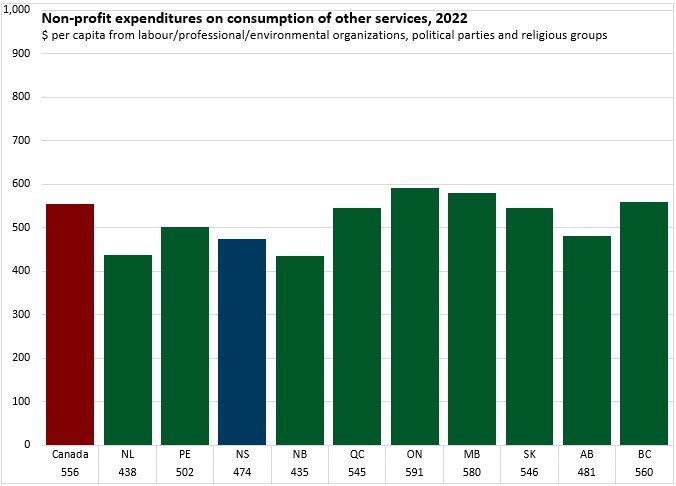
Other services offered by non-profit sector amounted to $474 per capita in Nova Scotia and $556 per capita in Canada in 2022. The consumption of their services offered by political parties, labour, professional, environmental protection organizations, and religious groups was highest in Ontario ($591 per capita) and Manitoba ($580 per capita). The lowest consumption values were reported in in New Brunswick ($435 per capita) as well as in Newfoundland and Labrador ($438 per capita).
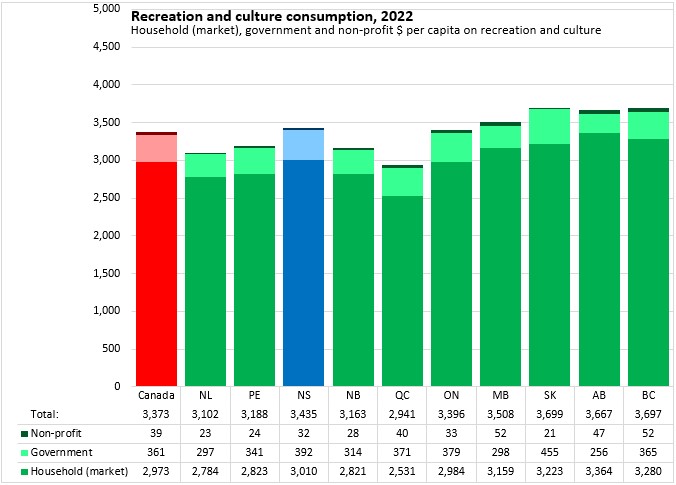
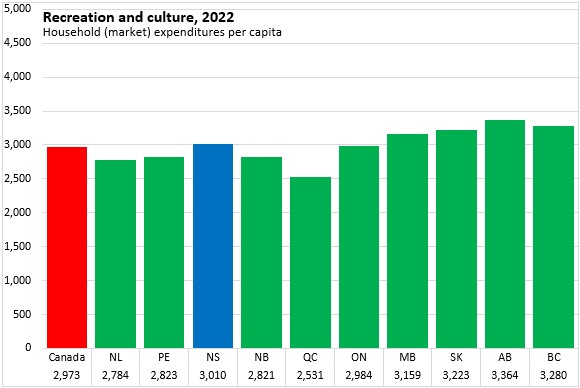
Recreation and culture expenditures by governments for households amounted to $392 per capita in Nova Scotia in 2022; non-profit expenditures were $32 per capita. These were considerably less than the $3,010 in household expenditures in the market for recreation and culture. Nationally, government recreation and culture expenditures for households were $361 per capita; non-profit expenditures were $39 per capita and private market expenditures were $2,973.
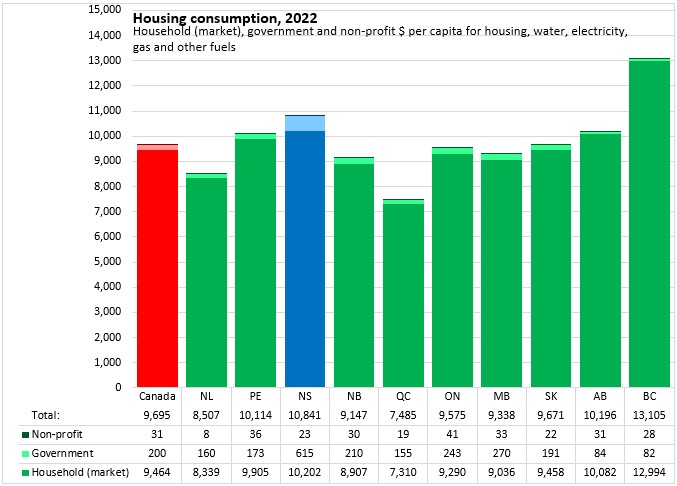
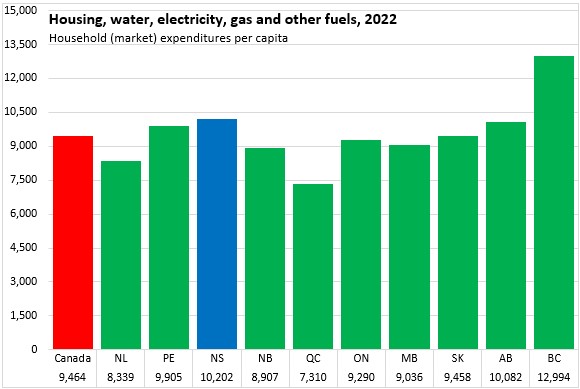
Housing consumption expenditures (including water and energy) were primarily private market expenditures in 2022 - ranging from $7,310 per capita in Québec to $12,994 per capita in British Columbia. Nova Scotia household market spending on housing/utilities was $10,202 per capita, which were the second highest after British Columbia. Government housing/utilities expenditures for households were $615 per capita in Nova Scotia in 2022 - the highest among provinces ($200 per capita nationally). Non-profit housing/utilities expenditures for households were $23 per capita in Nova Scotia in 2021 ($31 per capita nationally).
In household consumption from private market sources, Nova Scotia averaged $36,642 per capita in 2022. This was higher than the other Maritime provinces as well as Québec and Manitoba, but lower than in Newfoundland and Labrador, Ontario and the three westernmost provinces. National private market household consumption amounted to $37,843 per capita in 2022.
Nova Scotia reported the second highest private market expenditures for housing and residential utilities in 2022 at $10,202. British Columbia reported the highest value while Québec reported the lowest.
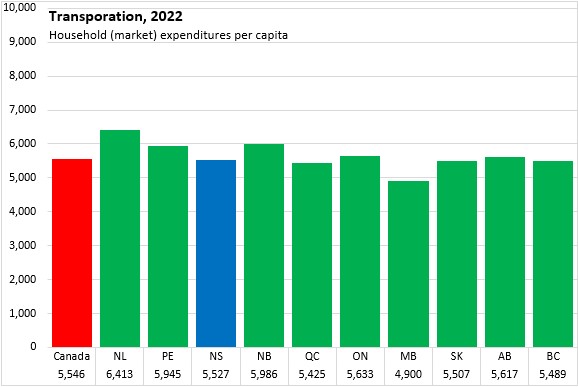
Nova Scotia household (market) expenditures on transportation amounted to $5,527 per capita - just below the national average of $5,546 per capita. Transportation expenditures were highest in Newfoundland and Labrador and lowest in Manitoba.
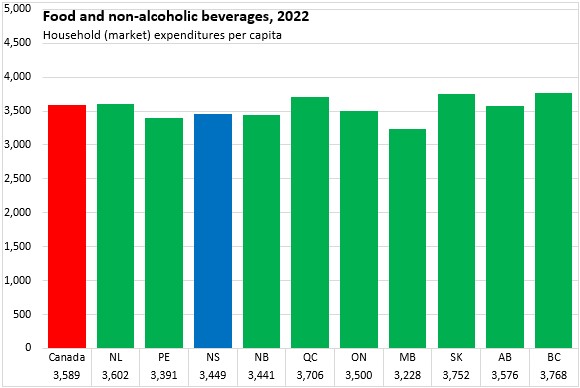
Food and non-alcoholic beverage purchases from stores were the next largest category of household (market) expenditures in Nova Scotia at $3,449 per capita. This was $140 below the national average ($3,589 per capita). Food expenditures were highest in British Columbia and Saskatchewan and lowest in Manitoba.
Private market household spending on recreation and culture amounted to $3,010 per capita in Nova Scotia, which was above the national average of $2,973 per capita. Alberta reported the highest recreation and culture expenditures per capita in 2022 while Québec reported the lowest values.
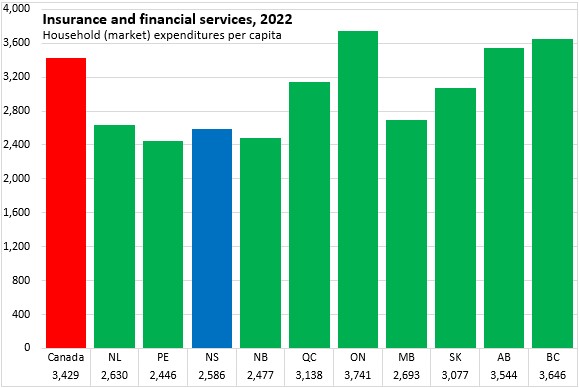
Nova Scotia's household spending on insurance and financial services amounted to $2,586 per capita in 2022 - third lowest after the other Maritime provinces. Ontario reported the highest household spending on insurance and financial services followed by British Columbia. National household expenditures on insurance and financial services amounted to $3,429 per capita in 2022.
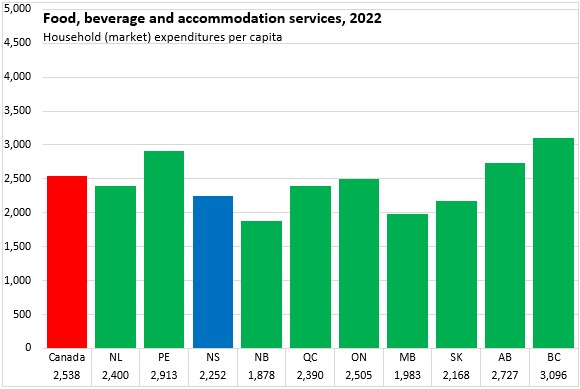
In addition to food purchased from stores, Nova Scotian households spend an average of $2,252 per capita on food and accommodation services. This was below the national average of $2,538 per capita. The highest food service and accommodation expenditures were in British Columbia while the lowest values were reported in New Brunswick.
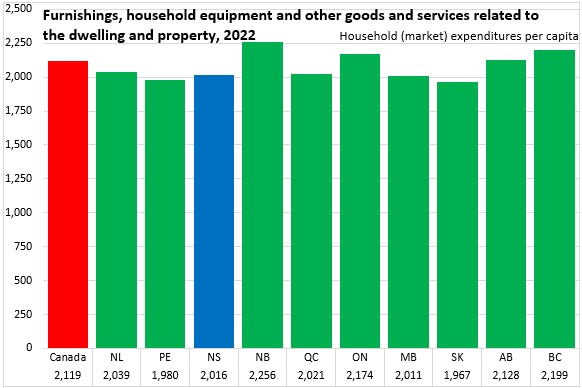
Nova Scotia household expenditures on furnishings and other property-related goods and services amounted to $2,016 per capita - below the national average of $2,119 per capita. New Brunswick reported the highest expenditures per capita on furnishings and property-related products while Saskatchewan and Prince Edward Island reported the lowest per capita spending.
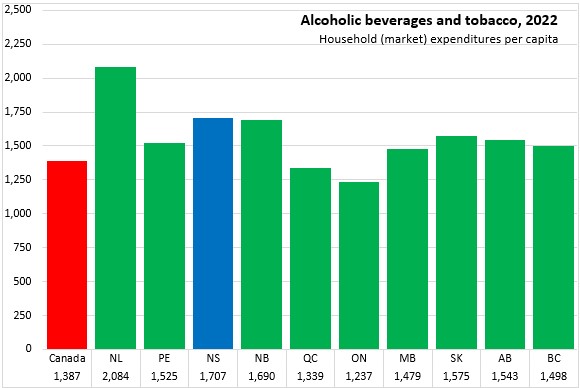
Nova Scotians spent $1,707 per capita on alcohol and tobacco (2nd highest after Newfoundland and Labrador). National expenditures were $1,387 per capita with the lowest value in Ontario.
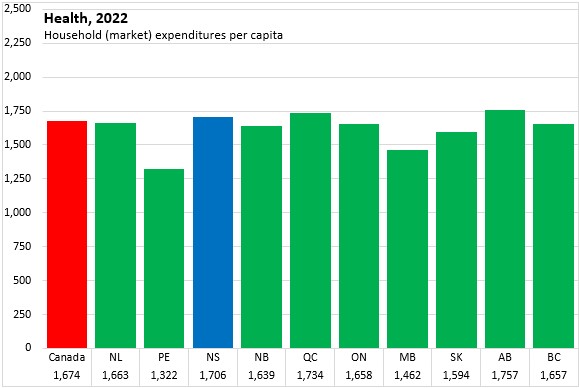
Nova Scotians spend $1,706 per capita for private market health care (as opposed to government or non-profit provision of health). This was above the national average of $1,674 per capita. Alberta reported the highest private market health spending per capita while Prince Edward Island reported the lowest.
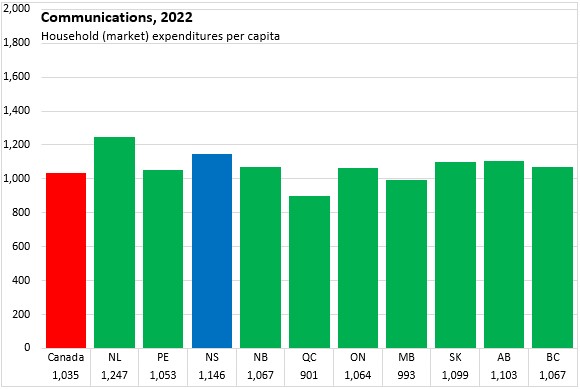
Nova Scotians reported the second highest per capita expenditures on communications at $1,146 (after Newfoundland and Labrador). National communications expenditures were $1,035 per capita with the lowest value in Québec.
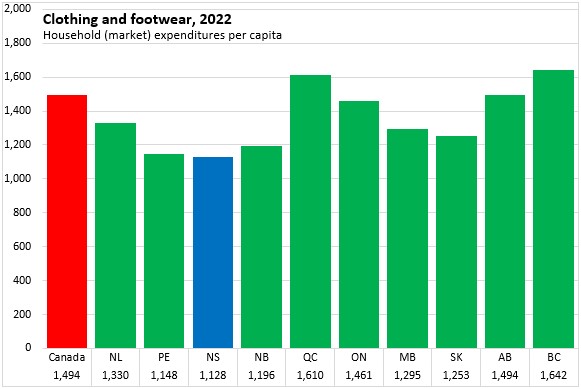
Nova Scotians reported the lowest per capita expenditures on clothing and footwear in 2022 at $1,128 per capita. National clothing and footwear expenditures were $1,494 per capita with the highest value in British Columbia.
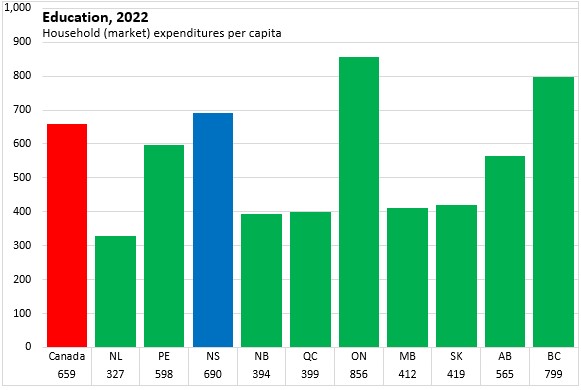
Nova Scotians spend $690 per capita on private market education (as opposed to government or non-profit provided education). This was above the national average of $659 per capita (highest value in Ontario, lowest in Newfoundland and Labrador).
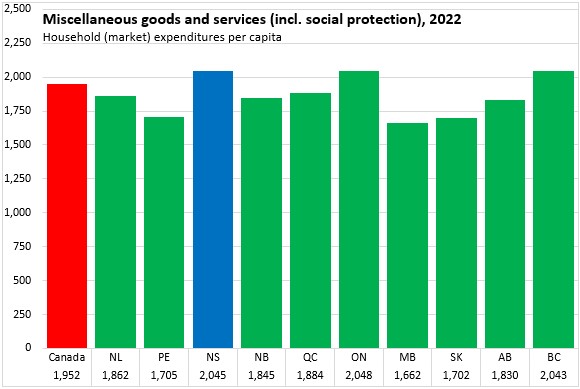
The highest household (market) expenditures for other miscellaneous goods and services were in Nova Scotia ($2,045) as well as in Ontario and British Columbia. Nationally, miscellaneous household expenditures were $1,952 per capita with the lowest value in Manitoba.
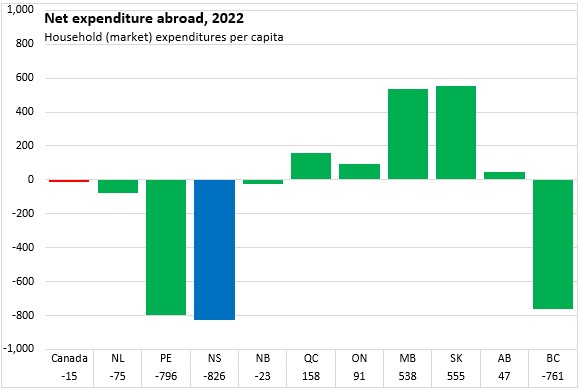
Nova Scotia had the largest negative net expenditures abroad (Nova Scotians' expenditures outside the province net of visitors expenditures in-province) at -$826 per capita. National net expenditures abroad were mostly balanced with the highest net positive values in Manitoba and Saskatchewan.
Notes: Household actual final consumption consists of the consumption of goods and services by households. The value of household actual final consumption is given by summing the following three components:
- The value of household expenditures on consumption of goods or services including expenditures on non-market good or services sold at prices that are not economically significant
- The value of the expenditures incurred by government units on individual consumption of goods or services provided to households as social transfers in kind
- The value of the expenditures incurred by non-profit institutions serving households on individual consumption of goods or services provided to households as social transfers in kind.
Source: Statistics Canada. Table 17-10-0005-01 Population estimates on July 1st, by age and sex; Table 36-10-0609-01 Household actual final consumption, Canada, provincial and territorial, annual (x 1,000,000)
<--- Return to Archive