The Economics and Statistics Division maintains archives of previous publications for accountability purposes, but makes no updates to keep these documents current with the latest data revisions from Statistics Canada. As a result, information in older documents may not be accurate. Please exercise caution when referring to older documents. For the latest information and historical data, please contact the individual listed to the right.
<--- Return to Archive
For additional information relating to this article, please contact:
March 26, 2024LIFE SATISFACTION AND QUALITY OF LIFE, Q3 2023 Statistics Canada has updated and expanded data about how Canadians perceive their quality of life. This information is collected as part of the Canadian Social Survey, conducted from July-August, 2023. This survey reports on Canadians' overall satisfaction with life, sense of meaning and purpose, perceived overall health, perceived mental health, difficulty meeting financial needs, satisfaction with family and friend relationships, trust in family/friends/neighbours/strangers and trust in media. National data does not include any results from the Territories.
Life satisfaction
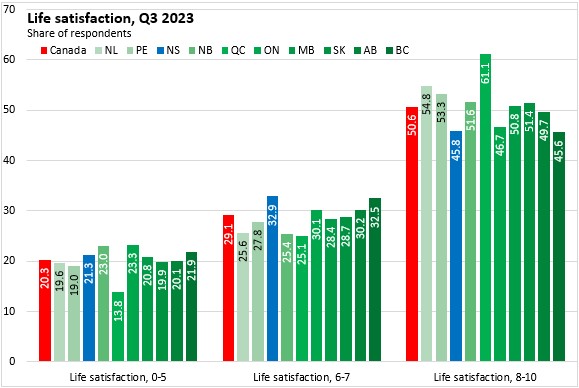
Respondents were asked "How do you feel about your life as a whole right now?, " where 0 meant "Very dissatisfied" and 10 meant "Very satisfied."
In Nova Scotia, 45.8% of respondents rated their life satisfaction in the most satisfied categories (8-10) while 21.3% responded with the least satisfied categories (0-5). Across Canada, 50.6% of the respondents were in the most satisfied categories while 20.3% were in the least satisfied categories. High life satisfaction (8-10) was most prevalent in Québec and Newfoundland and Labrador while it was least prevalent in Nova Scotia and British Columbia, where moderate levels of life satisfaction (6-7) were more prevalent. Low levels of life satisfaction (0-5) were more prevalent in Ontario and New Brunswick.
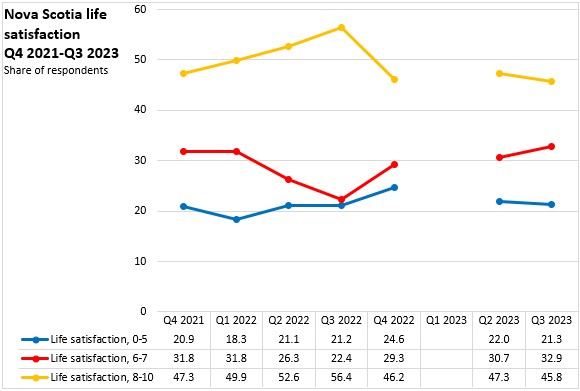
In Nova Scotia, levels of life satisfaction deteriorated after peaking in Q3 2022 (note: life satisfaction and quality of life indicators were not reported for Q1 2023). Since then, more of the population reports satisfaction levels 6 or 7.
Sense of Meaning and Purpose
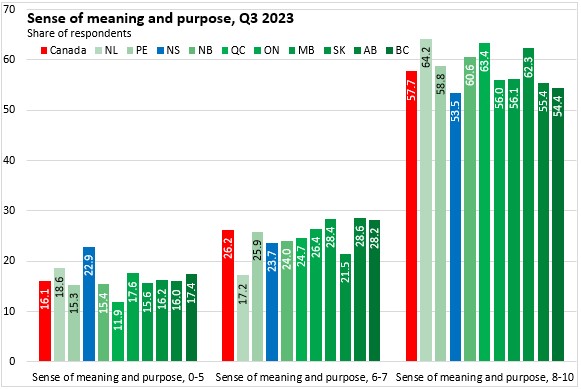
Respondents were asked whether the things to do in life felt worthwhile, ranked on a scale of 0 to 10 where '0' indicated 'not at all worthwhile' and '10' indicated 'completely worthwhile'.
In Nova Scotia, 53.5% of respondents replied in the three strongest categories (8-10) for sense of meaning and purpose - the lowest among provinces. Across Canada, 57.7% reported the strongest sense of meaning and purpose. The highest share of respondents in these categories were in Newfoundland and Labrador and Québec.
22.9% of Nova Scotians responded that their sense of meaning and purpose in the things they do in life were in the lowest categories (0-5) - most among provinces. The national average response in the lowest categories was 16.1%.
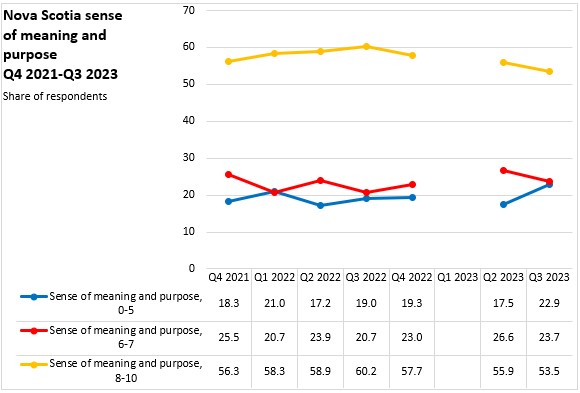
In Nova Scotia, there has been an erosion in respondents reporting high sense of meaning and purpose in life since Q3 2022.
Perceived overall health and mental health
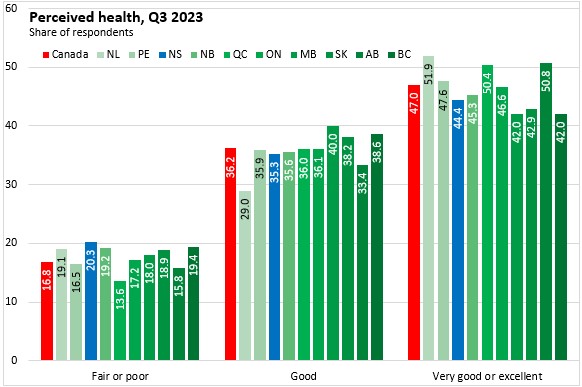
Respondents were asked, “In general, how is your health?”, where possible response categories included “Excellent,” “Very good,” “Good,” “Fair” and “Poor.”
More Nova Scotians reported fair or poor health (20.3%) than in any other province (national average: 16.8%). Strong overall health perceptions were most prevalent in Newfoundland and Labrador as well as in Québec and Alberta.
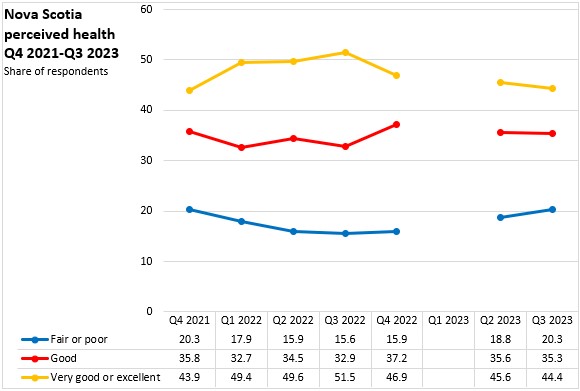
Perceptions of overall health have been trending down in Nova Scotia since Q2 2022.
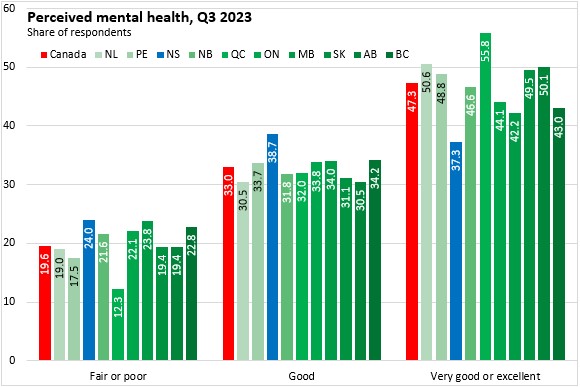
Respondents were asked, “In general, how is your mental health?”, where possible response categories included “Excellent,” “Very good,” “Good,” “Fair” and “Poor.”
Nova Scotians were the most likely to report fair or poor mental health (24.0%), the least likely to report very good or excellent mental health (37.3%) and the most likely to report good mental health (38.7%).
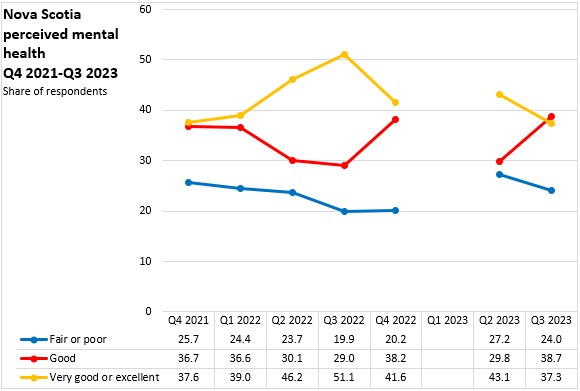
Perceptions of very good or excellent mental health have been trending down since Q3 2022 while good, fair and poor mental health reports have been rising.
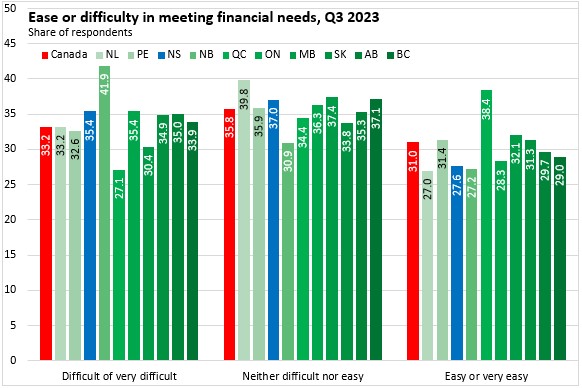
Meeting Financial Needs
Respondents were asked, “In the past 12 months, how difficult or easy was it for your household to meet its financial needs in terms of transportation, housing, food, clothing and other necessary expenses?”, where possible response categories included “Very difficult,” “Difficult,” “Neither difficult nor easy,” “Easy” and “Very easy.”
Nova Scotians were more likely to report that meeting their financial needs was difficult or very difficult (35.4%) than other Canadians (33.2%). Easy or very easy satisfaction of financial needs was reported by 27.6% of Nova Scotians, which was third lowest among provinces (ahead of New Brunswick and Newfoundland and Labrador).
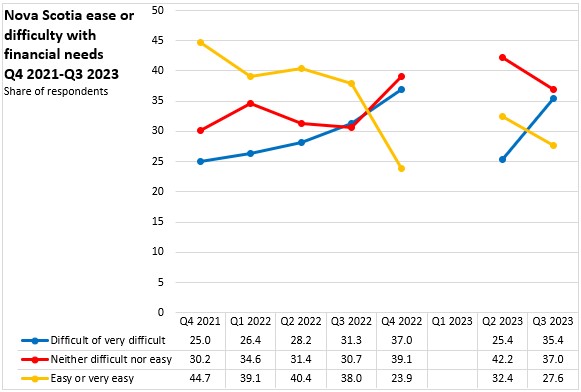
There was a notable deterioration in ease of meeting financial needs in Q4 2022, though this has since moderated.
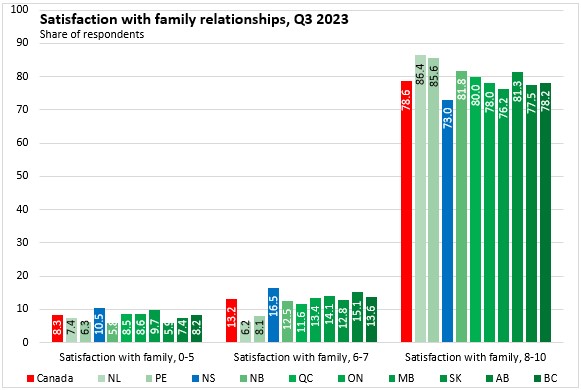
Satisfaction with family and friend relationships
Respondents were asked to rate their satisfaction in relationships with family, rated on a scale of 0 (least satisfied) to 10 (most satisfied).
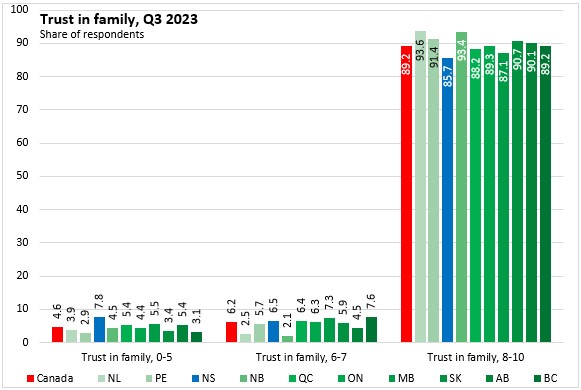
Over 9/10 respondents reported being satisfied (6-7) or very satisfied (8-10) with their family relationships, with the exception of Nova Scotia (89.5%). In Nova Scotia, there was a notably lower portion that reported the highest level of satisfaction with family relationships (73.0%).
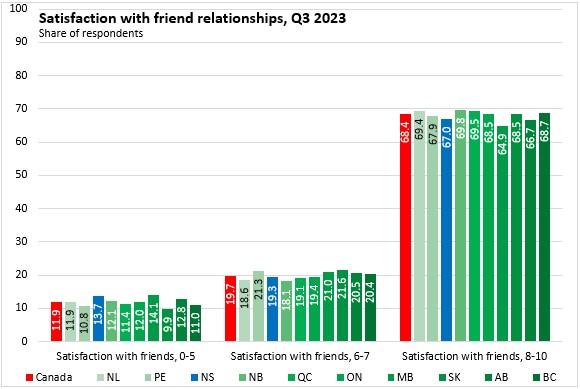
Nova Scotia's reported satisfaction (86.3% from 6-10) with friend relationships was also the lowest among provinces.
Trust in family, friends, neighbours and strangers
More than 9 in 10 Canadians in every province reported moderate (6-7) or strong (8-10) levels of trust in family. Nova Scotia reported the lowest prevalence of strong trust in family, though this was still 85.7% of respondents in the province.
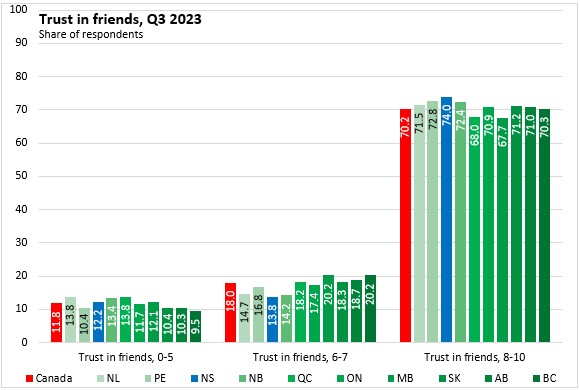
Nova Scotians reported the strongest levels of trust friends (74.0%) compared with other provinces.
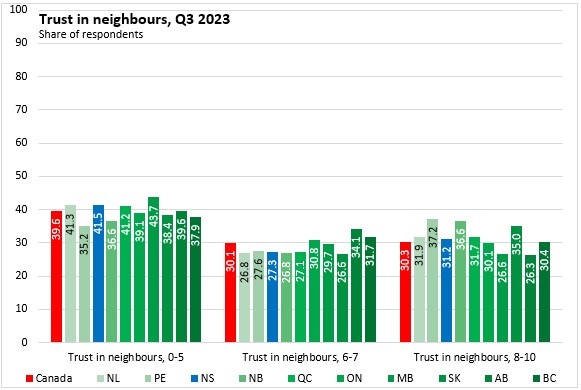
Trust in neighbours was generally lower than trust in friends and family, though more than half of respondents in every province had moderate (6-7) or strong (8-10) trust in neighbours.
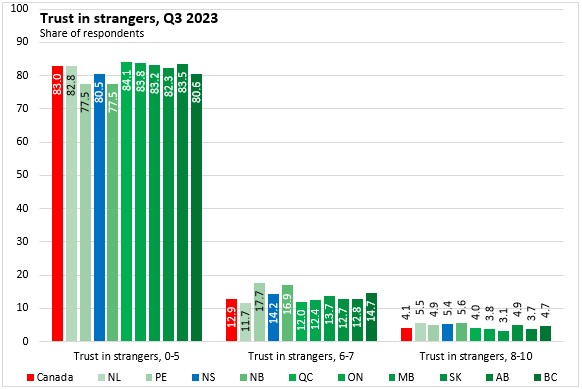
Canadians generally reported the lowest levels of trust in strangers - though in the Maritime provinces, moderate levels of trust in strangers (6-7) was more common.
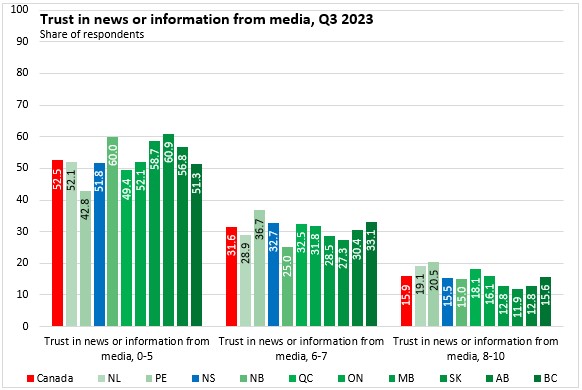
Trust in news and information received from media
More than half of respondents in every province except Prince Edward Island and Québec reported low levels of trust in news and information from media.
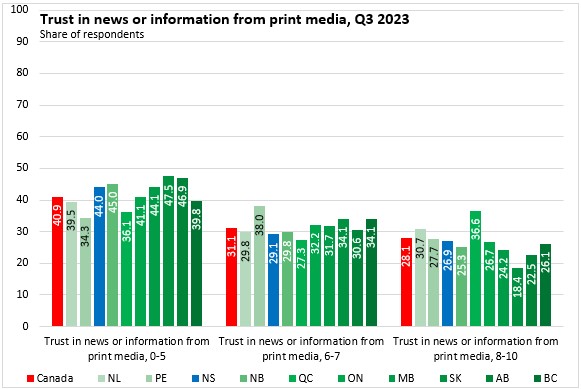
Print media enjoyed stronger levels of trust than overall media, particularly in Québec and Prince Edward Island.
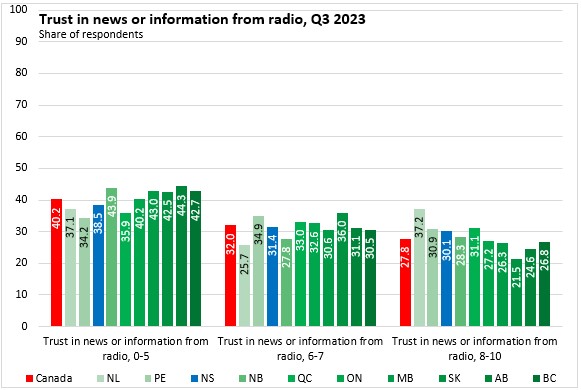
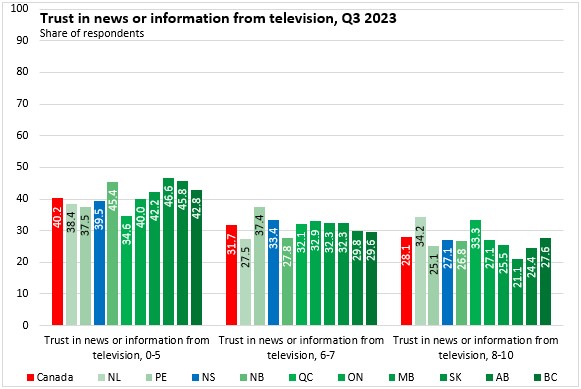
Trust levels in news and information from both radio and television were stronger in Newfoundland and Labrador, Prince Edward Island and Québec.
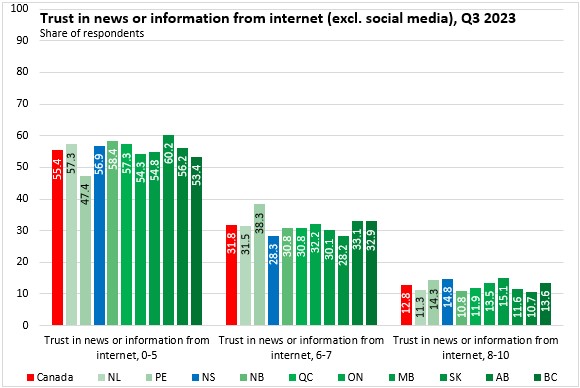
More than half of respondents in every province except Prince Edward Island reported the lowest levels of trust in news or information from the internet (excluding social media).
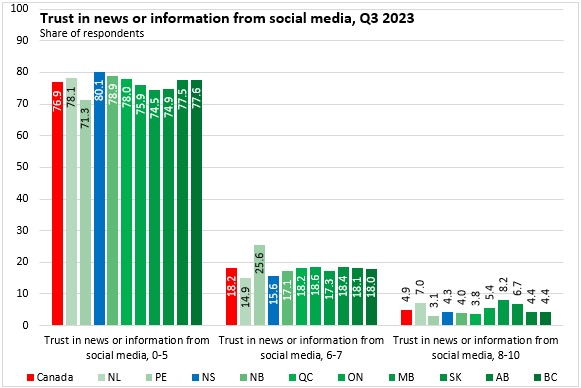
A large majority of respondents in every province reported the lowest levels of trust in news or information from social media. Nova Scotians reported the lowest levels of trust in social media while respondents in Prince Edward Island, Manitoba and Saskatchewan reported slightly higher levels of trust in news or information from social media.
Source: Statistics Canada. Table 13-10-0843-01 Life satisfaction by gender and province; Table 13-10-0845-01 Sense of meaning and purpose by gender and province; Table 45-10-0079-01 Perceived mental health, by gender and province; Table 45-10-0081-01 Perceived health, by gender and province; Table 45-10-0086-01 Difficulty meeting financial needs, by gender and province; Table 45-10-0090-01 Satisfaction with family relationships by gender and province; Table 45-10-0092-01 Satisfaction with friend relationships by gender and province; Table 45-10-0094-01 Trust in people by gender and province; Table 45-10-0096-01 Trust in news or information from media by gender and province
<--- Return to Archive