The Economics and Statistics Division maintains archives of previous publications for accountability purposes, but makes no updates to keep these documents current with the latest data revisions from Statistics Canada. As a result, information in older documents may not be accurate. Please exercise caution when referring to older documents. For the latest information and historical data, please contact the individual listed to the right.
<--- Return to Archive
For additional information relating to this article, please contact:
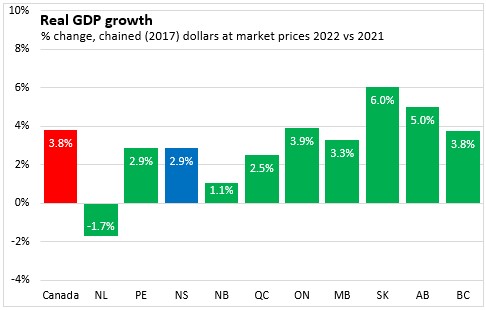
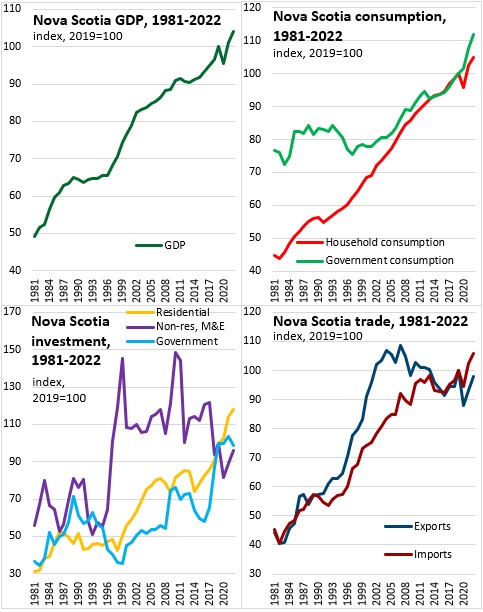
November 08, 2023PROVINCIAL GDP BY INCOME AND EXPENDITURE ACCOUNTS 2022 Nova Scotia's real GDP grew by 2.9% in 2022 following a 5.9% increase in 2021. Canada's real GDP increased by 3.8% with gains reported in nine provinces. Newfoundland and Labrador recorded the only decline, while Saskatchewan, Alberta and Ontario had the largest annual increases in GDP.
Data for 2020 and 2021 were also revised.
The impacts of the pandemic on Nova Scotia's economy in 2020 were more severe than previously estimated. Nova Scotia's real GDP is now estimated to have contracted by 4.5% in 2020. This was better than the national average decline of 5.0%, but worse than reported in Prince Edward Island, New Brunswick, Manitoba, Saskatchewan and British Columbia. Nova Scotia's real GDP growth for 2021 was revise downward from 6.2% to 5.9%.
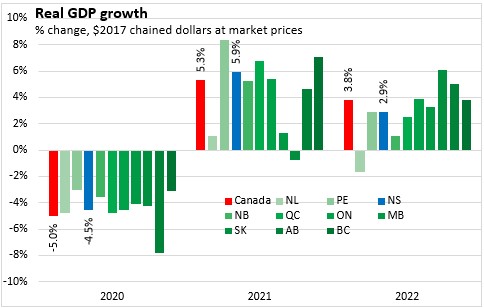
Growth generally slowed for all provinces in 2022 after the strong economic rebound in 2021.
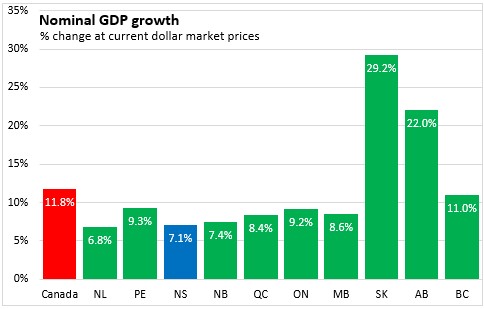
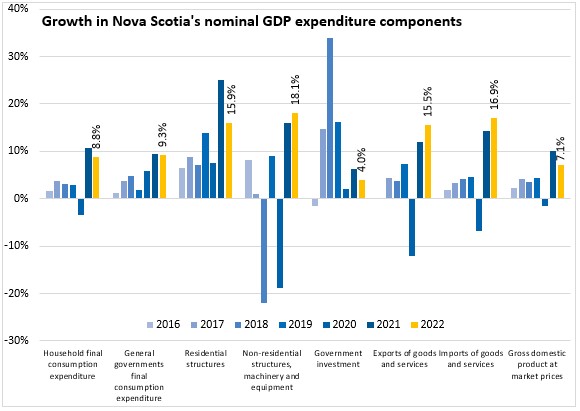
Nova Scotia's nominal GDP growth was 7.1% in 2022, including the increase in value associated with both price and volume changes. National nominal GDP growth was 11.8% with strong gains in all provinces. Saskatchewan and Alberta reported the largest increases in nominal GDP (partially attributable to recovery in prices for oil produced in these jurisdictions). The slowest gains in nominal GDP were reported in New Brunswick, Nova Scotia and Newfoundland and Labrador.
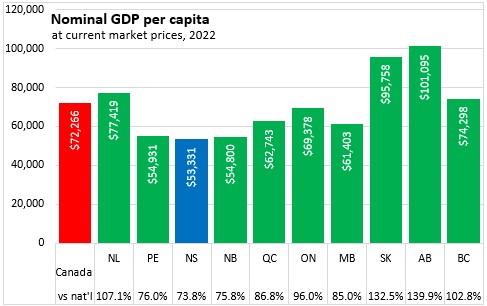
Nova Scotia's per capita nominal GDP amounted to $53,331 per person, or 73.8% of the national average. Nova Scotia's nominal GDP per capita was the lowest among provinces - just behind the other Maritime provinces. Canada's major resource-producing provinces (Alberta, Saskatchewan, Newfoundland and Labrador) reported the largest nominal values of GDP per capita.
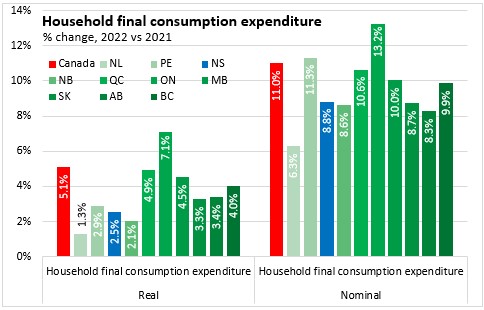
Nova Scotia's household consumer expenditures grew by 2.5% in real terms (third slowest among provinces) and 8.8% in nominal terms. Higher spending on services was a major contributor to the 5.1% growth in national real household spending, with the easing of restrictions allowing increased spending on travel, air transport, and food and non-alcoholic beverage services.
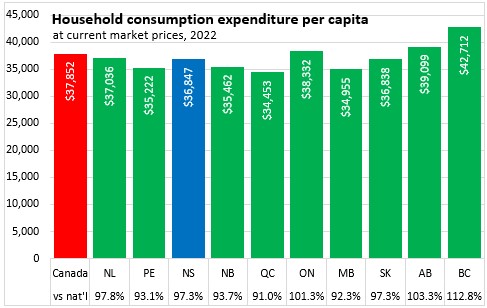
Despite nominal GDP per capita of 73.8% of the national average, Nova Scotia's nominal household consumer expenditures were $36,847 in 2022 or 97.3% of the national average.
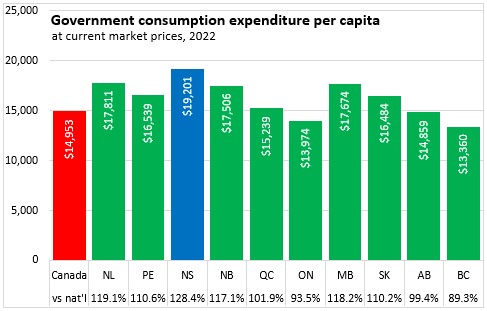
Final consumption expenditures from all levels of government were up 4.0% in real terms for Nova Scotia and 9.3% in nominal terms. Government expenditure growth was strong coming out of the pandemic and has remained elevated across all provinces.
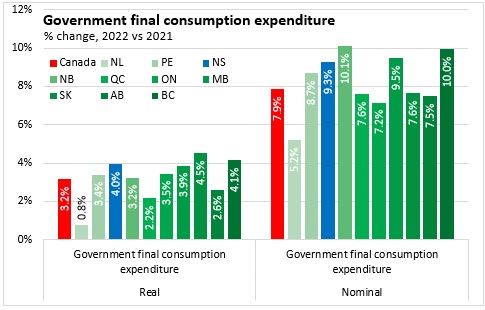
Nova Scotia reported the highest level of nominal government expenditures per capita among provinces at $19,201. As these expenditures include all levels of government, Nova Scotia's large military presence increases government expenditures per capita to 128.4% of the national average. Government consumption expenditures per capita were lowest in British Columbia and Ontario.
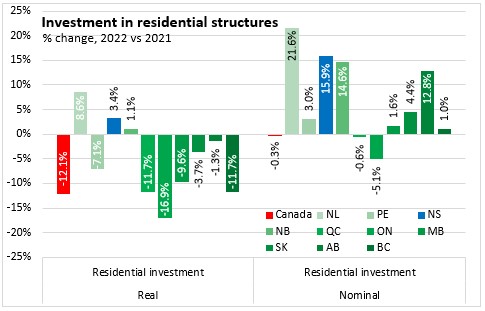
Nova Scotia's investment in residential structures (including both new and renovation spending) was up 3.4% in real terms and 15.9% in nominal terms. Nova Scotia reported the second highest growth in residential construction investments in both nominal and real terms, with most provinces reporting real declines after strong growth in 2021. Investment declines were more pronounced in Ontario and British Columbia, where ownership transfer costs from resale activity fell sharply.
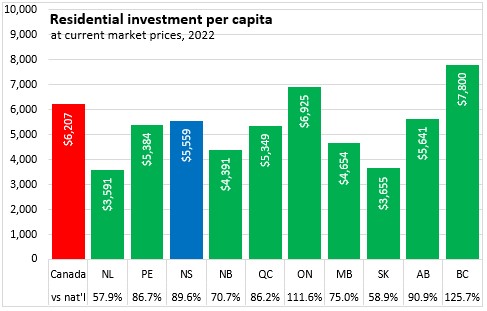
Nova Scotia's residential investments amounted to $5,559 per capita in 2022 or 89.6% of the national average. Residential investments per capita shown here are in nominal terms and elevated home prices in Ontario and British Columbia contribute to higher investments per capita in these provinces. Newfoundland and Labrador reported the lowest per capita investments in residential structures.
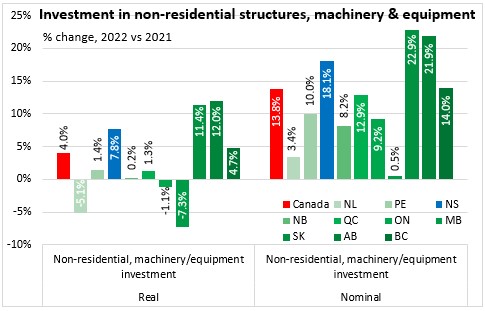
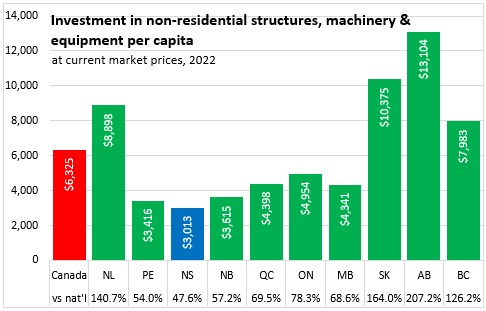
Nova Scotia had the third highest growth in business investment for non-residential structures as well as machinery and equipment, with 7.8% growth in real terms and 18.1% in nominal terms. National growth in investment for non-residential structures, machinery and equipment was 4.0% in real terms and 13.8% in nominal terms, with oil and gas engineering projects, utilities and pipeline construction in Alberta and British Columbia being major contributors to growth. Manitoba, Ontario and Newfoundland and Labrador reported the largest declines in real investment.
Despite strong growth, Nova Scotia's overall level of per capita business investment in non-residential structures, machinery and equipment was the lowest among provinces at $3,013. Canada's major resource-producing provinces all reported substantially higher per capita business investments in non-residential structures, machinery and equipment.
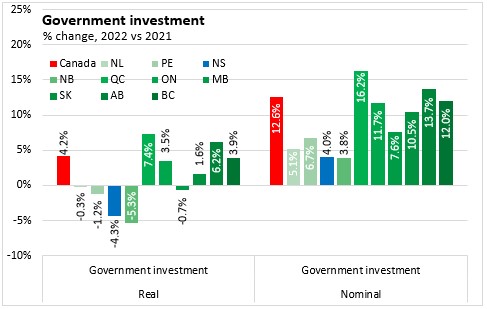
Government (as opposed to business) investment in Nova Scotia decreased by 4.3% in real terms and 4.0% in nominal terms. With a falling real investment, price growth was responsible for higher nominal government investments in 2022. Government investment growth was notably faster in Quebec and Alberta, and weaker in Atlantic Canada in 2022.
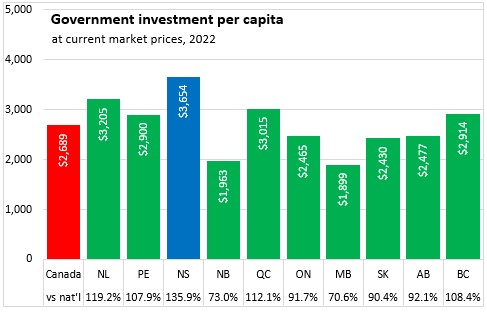
On a per capita basis, Nova Scotia reported the highest level of nominal government investments in 2022 at $3,654 or 135.9% of the national average. Manitoba reported the lowest level of government investment per capita in 2022.
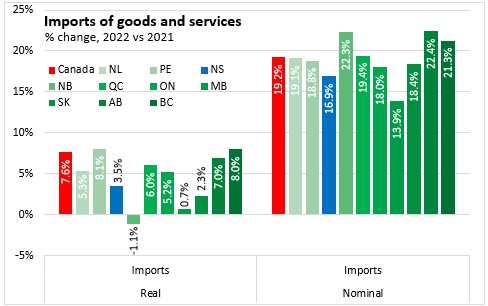
Nova Scotia's exports of goods and services - which includes both international and interprovincial destinations - increased by 5.3% in real terms and 15.5% in nominal terms. Nova Scotia had the third highest export growth in real terms, and the fourth highest nominal growth behind Saskatchewan, Alberta and British Columbia.
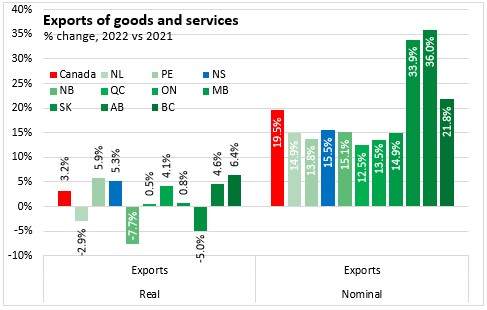
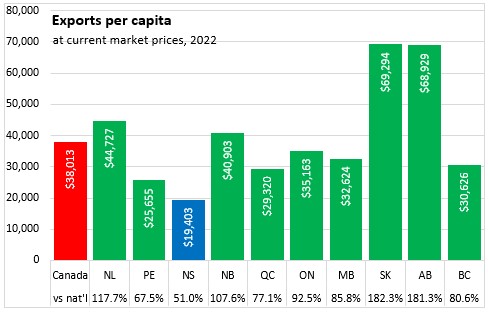
Nova Scotia's per capita exports were the lowest among provinces - by a substantial margin. The $19,403 in per capita interprovincial and international exports from Nova Scotia amounted to 51.0% of the national average. The next lowest province (Prince Edward Island) had exports of $25,655 per capita or 67.5% of the national average. All three major resource-producing provinces reported the strongest exports per capita, along with New Brunswick.
Nova Scotia's imports grew by 3.5% in real terms (slower than export growth) and 16.9% in nominal terms. Canada's imports rose faster than exports at 7.6% in 2022, weighing on GDP for the year. Imports grew in real terms for all provinces except New Brunswick. Alberta reported the largest nominal increase, followed closely by New Brunswick, which imports a substantial volume of crude oil for refining.
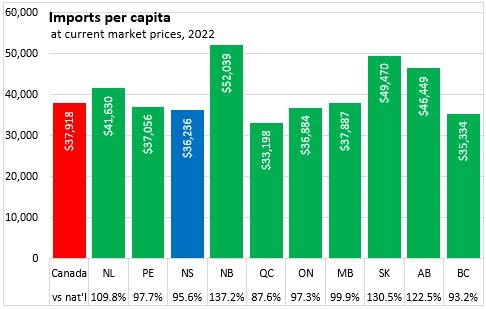
Nova Scotia's per capita imports amounted to $36,236 or 95.6% of the national average. Quebec reported the smallest imports per capita while New Brunswick reported the largest imports per capita.
Nova Scotia's overall economic growth in 2022 was supported by strong export and business investment growth. Household consumer spending, government consumption, residential investment all contributed to growth as well, though these were partially offset by rising imports and a decline in government investment. All expenditure components that positively impact GDP had slower growth in 2022 compared to 2021, with notably slower growth in household consumption and residential structures as well as the decline in government investment.
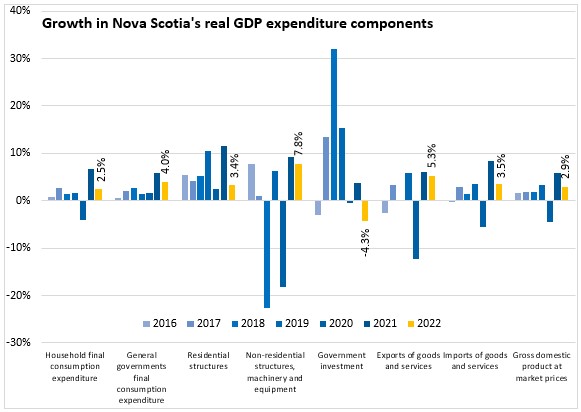
In nominal terms, the increases in Nova Scotia's exports and business investments, including residential, stand out in their contribution to nominal GDP growth. The sizable gap between real and nominal expenditures reflects substantial price gains on top of higher real volumes.
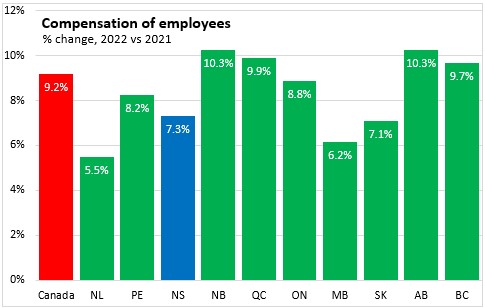
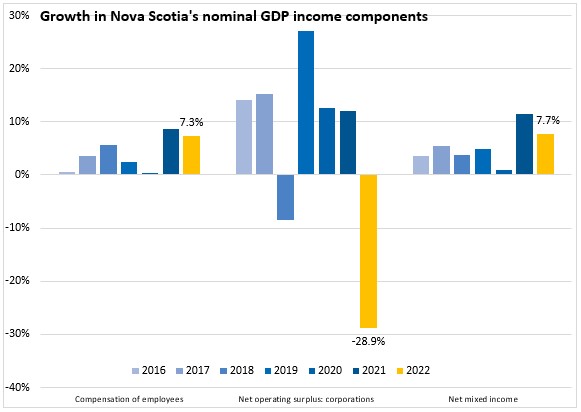
Compensation of employees for all industries was up 7.3% in Nova Scotia in 2022, below the national pace of 9.2% and the fourth slowest growth among provinces. The fastest growth in employee compensation was reported for Alberta and New Brunswick. Employee compensation growth was slowest in Newfoundland and Labrador, Manitoba, and Saskatchewan.
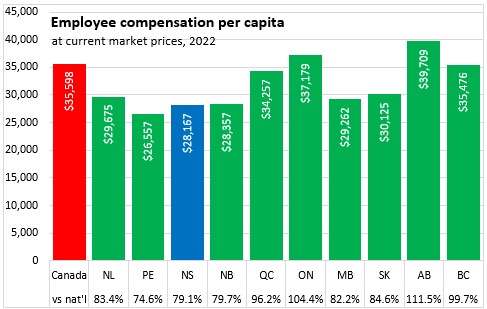
Nova Scotia's employee compensation per capita was $28,167 in 2022 or 79.1% of the national average. The Martime provinces had the lowest compensation per capita, with Prince Edward Island below and New Brunswick above the average compensation in Nova Scotia. Employee compensation per capita was highest in Alberta, followed by Ontario.
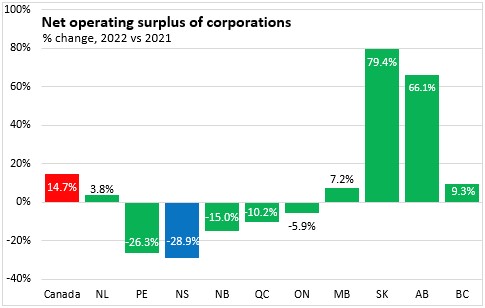
Growth in net operating surplus of corporations is typically volatile from one year to the next. Saskatchewan's net operating surplus of corporations was up 79.4% from 2021 to 2022, followed by Alberta at 66.1%. After growth of 12.1% in 2021, Nova Scotia's net operating surplus dropped 28.9% in 2022, the fastest decline among provinces. Nationally, corporate net operating surplus increased 14.7% in 2022, with the gains concentrated in resource producing provinces.
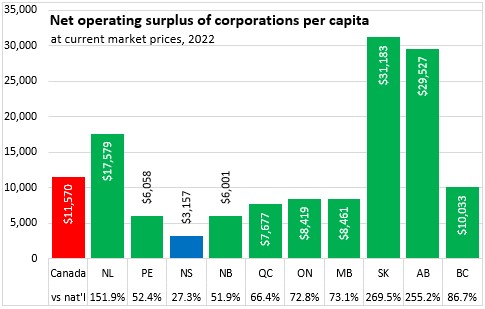
Nova Scotia reported by far the lowest corporate net operating surplus per capita at $3,157 in 2022 - just 27.3% of the national per capita average. The Maritime provinces had the lowest per capita corporate net operating surplus in 2022, while the three major resource-producing provinces (Alberta, Saskatchewan and Newfoundland and Labrador) all reported substantially higher corporate net operating surplus per capita.
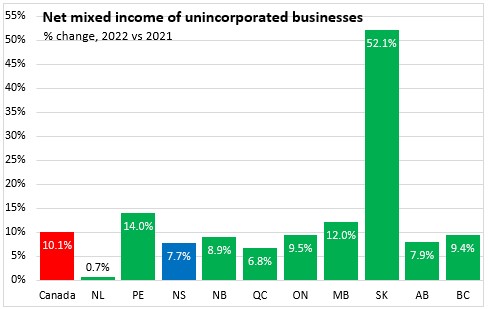
Nova Scotia reported a 7.7% increase in net mixed income of unincorporated businesses in 2022 - below the national average at 10.1%. Saskatchewan reported notably faster growth than other provinces with farm self-employment income rebounding on improved growing conditions and higher grain prices.
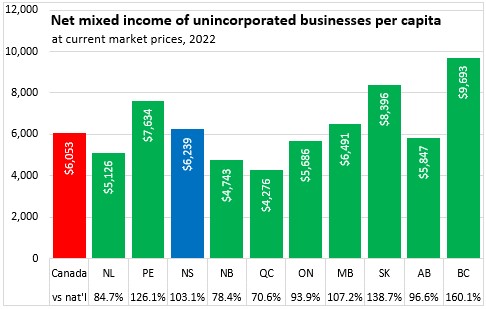
Unlike corporate net operating surplus, Nova Scotia's net mixed income per capita exceeds the national average at $6,239 (103.1% of national). British Columbia reported much higher per capita net mixed income of unincorporated businesses. Quebec reported the lowest per capita net mixed income.
Growth in employee compensation and net mixed income contributed to Nova Scotia's overall nominal GDP growth in 2022. While growth in these income components is down from 2021, the increases in 2022 were faster compared to pre-pandemic growth.
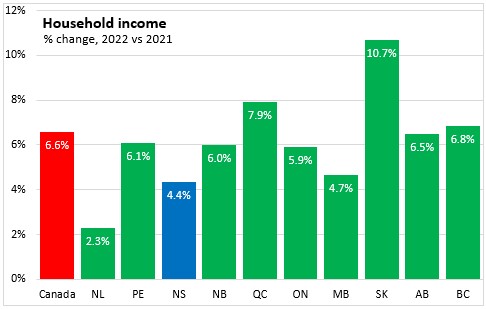
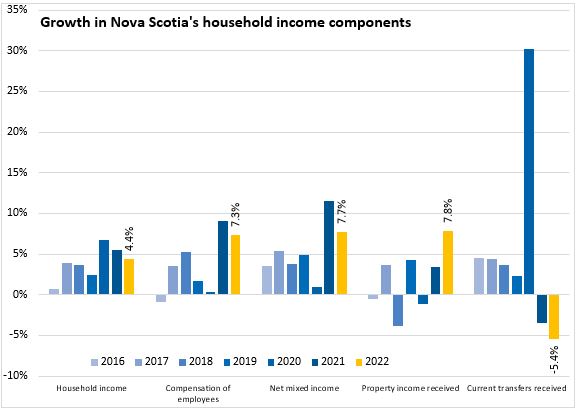
Household income grew by 4.4% in Nova Scotia in 2022, below the national growth of 6.6%. Nova Scotia reported the second slowest growth, behind Manitoba at 4.7% and above Newfoundland and Labrador at 2.3%. Saskatchewan reported the fastest growth in 2022.
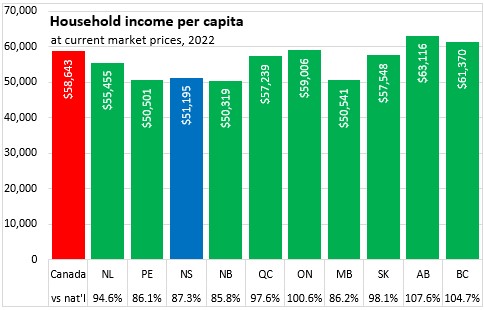
Nova Scotia's per capita household income was $51,195 in 2022 or 87.3% of the national average. Alberta reported the highest per capita household income. The gap between lowest (New Brunswick, 85.8% of national) and highest (Alberta, 107.6% of national) per capita household income is substantially narrower than reported for per capita nominal GDP.
Household income includes employee compensation, net mixed income, property income received and current transfers received. It is reported on a national rather than a domestic basis.
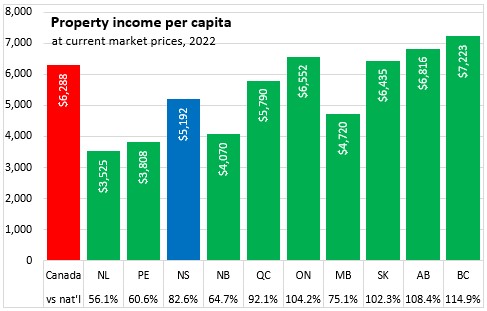
Property income received by households (such as interest, dividends, pensions) increased by 7.8% in Nova Scotia in 2022, slower than the national average of 10.7%. Only New Brunswick reported a slower increase (+7.7%), while the fastest gain occurred in Saskatchewan.
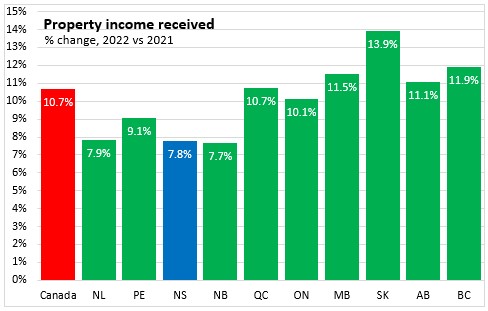
Nova Scotia's property income receipts were $5,192 per capita or 82.6% of the national average. Receipts were highest in British Columbia, Alberta and Ontario and lowest in the three Atlantic provinces outside Nova Scotia.
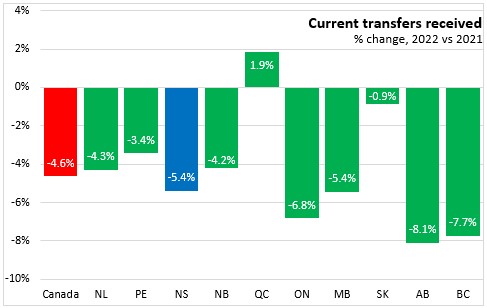
Current transfers received declined by 5.4% in Nova Scotia, faster than the national decline of 4.6% in 2022. The fastest declines were reported for Ontario, Alberta and British Columbia. Quebec was the only province to report an increase in transfers for 2022.
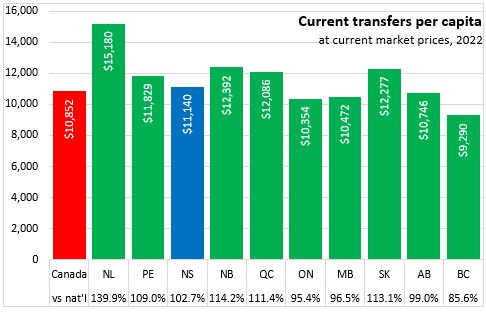
Current transfers per capita were highest in Newfoundland and Labrador and lowest in British Columbia. Nova Scotia's current transfers per capita were $11,140 or 102.7% of the national average.
Nova Scotia's growth in household income in 2022 came substantially from rising employee compensation and net mixed income, while property income growth was minimal and current transfers declined.
The GDP deflator is the implicit price index that establishes the difference between nominal GDP growth (which includes both price and volume gains) and real GDP growth (which includes only volume changes). This implicit price index is a broader measure of price growth than the consumer price index, which only considers a fixed basket of household consumption items.
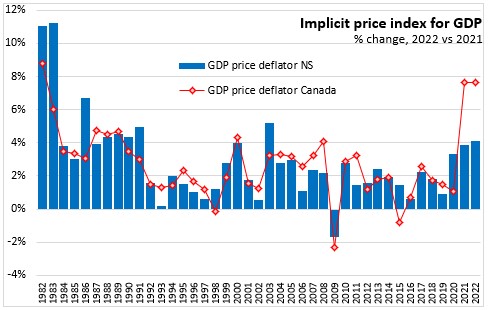
Nova Scotia reported the slowest growth among provinces in the GDP deflator at 4.1% in 2022, up from 3.9% in 2021. The three resource-producing provinces, which are more impacted by rising energy export and prices, reported the largest increases in their respective price indices for GDP.
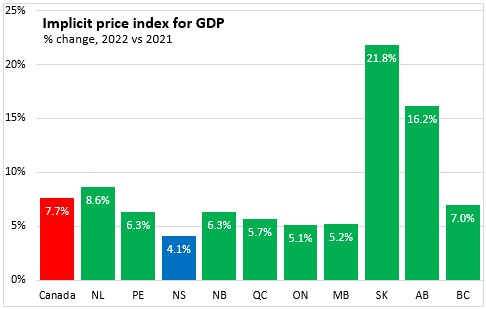
Nova Scotia's 4.1% increase in the implicit price index for GDP was the fastest since 2003. The national GDP deflator gain of 7.7% was the fastest since 1982.
Notes: Income and expenditure accounts provide the official estimates of Nova Scotia's gross domestic product (GDP) and select indicators. The estimates released today include revisions for the years 2020 and 2021 and the first estimate of expenditure and income for 2022. GDP as measured by the expenditure account refers to all final consumption and investment spending not bound for further production in the Nova Scotia economy in the year. Exports are added to this whether these are final or intermediate goods they are not bound for further production in Nova Scotia in the year. Imports are subtracted from this value (regardless of whether they are final or intermediate products) as any final expenditure that includes direct or embedded imports would not generate income for Nova Scotia factors of production in the year.
In the income accounts, GDP represents the generation of income from production activities. This income is spread across compensation of employees (in all industries), operating surplus of corporations (including both net operating surplus and consumption of fixed capital), mixed income of unincorporated businesses (including net mixed income as well as consumption of fixed capital by unincorporated businesses) along with adjustments to taxes on products and taxes on production. The analysis below focuses on employee compensation, net operating surplus of corporations and net mixed income of unincorporated businesses - all measured in nominal terms.
Household income includes components from the income account of GDP: employee compensation net mixed income (but measured on a 'national' as opposed to 'domestic' basis). The rest of household income is made up of earnings that are not derived from current production: property income received from ownership of real or financial assets as well as current transfers received from governments and corporations.
Source: Statistics Canada. Table 36-10-0221-01 Gross domestic product, income-based, provincial and territorial, annual (x 1,000,000); Table 36-10-0222-01 Gross domestic product, expenditure-based, provincial and territorial, annual (x 1,000,000); Table 36-10-0482-01 Property income of households, provincial and territorial (x 1,000,000); Table 36-10-0226-01 Household sector, selected indicators, provincial and territorial; Table 36-10-0223-01 Implicit price indexes, gross domestic product, provincial and territorial
<--- Return to Archive