The Economics and Statistics Division maintains archives of previous publications for accountability purposes, but makes no updates to keep these documents current with the latest data revisions from Statistics Canada. As a result, information in older documents may not be accurate. Please exercise caution when referring to older documents. For the latest information and historical data, please contact the individual listed to the right.
<--- Return to Archive
For additional information relating to this article, please contact:
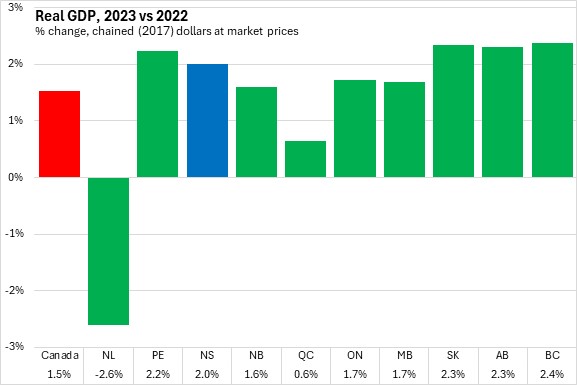
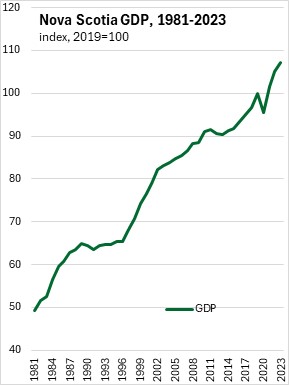
November 07, 2024PROVINCIAL GDP BY INCOME AND EXPENDITURE ACCOUNTS 2023 Nova Scotia's real GDP grew by 2.0% in 2023 following a revised 3.5% increase in 2022. Canada's real GDP increased by 1.5% with gains reported in all provinces except Newfoundland and Labrador. British Columbia, Saskatchewan, Alberta and Prince Edward Island had the fastest annual increases in GDP.
Data for 2021 and 2022 were also revised. Nova Scotia's real GDP growth for 2021 was revised up from 5.9% to 6.4% while growth in 2022 was revised up from 2.9% to 3.5%. Nominal GDP growth was revised from 10.0% in 2021 to 11.3% and from 7.1% in 2022 to 7.4%. As a result of these revisions, nominal GDP in 2022 increased from the previous estimate of $54.38 billion up to $55.17 billion.
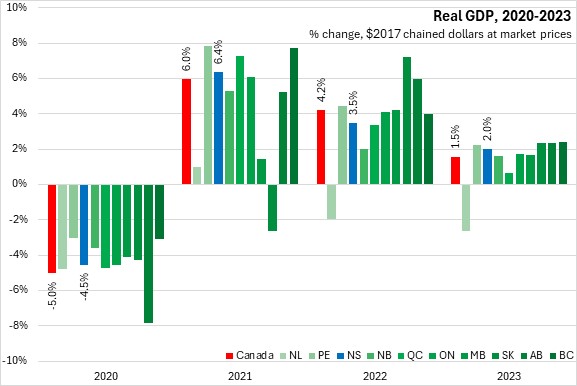
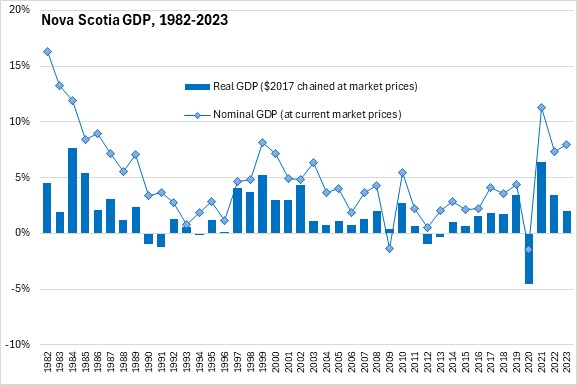
Nova Scotia's real GDP growth slowed again following the post-pandemic economic rebound of 2021. However, nominal GDP growth accelerated 8.0% owing to broad price growth (beyond consumer price inflation).
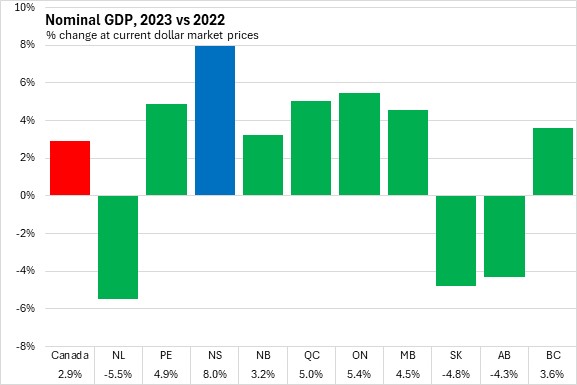
Nova Scotia's nominal GDP growth was 8.0% in 2023, including the increase in value associated with both price and volume changes. Nova Scotia reported the fastest nominal GDP growth among provinces, outpacing the second fastest growing nominal GDP (Ontario) by 2.6 percentage points.
National nominal GDP growth was 2.9% with gains in seven provinces. Newfoundland and Labrador, Saskatchewan and Alberta all reported declining nominal GDP (partially attributable to prices for natural resource produced in these jurisdictions).
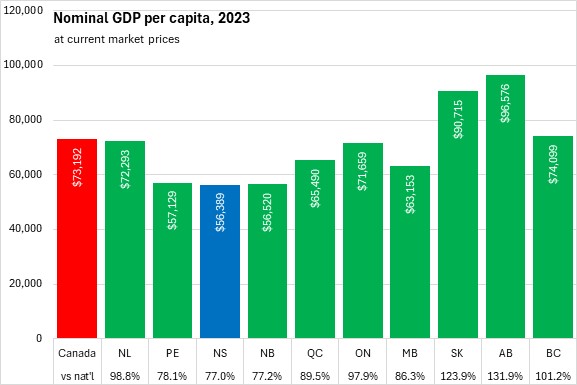
Nova Scotia's per capita nominal GDP amounted to $56,389 per person, or 77.0% of the national average. Nova Scotia's nominal GDP per capita was the lowest among provinces - just behind the other Maritime provinces. Alberta and Saskatchewan reported the largest nominal values of GDP per capita.
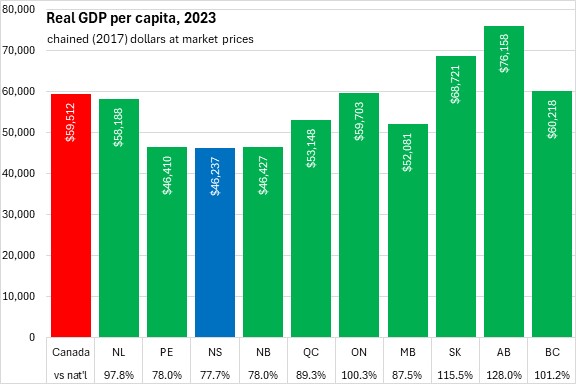
Nova Scotia's real GDP per capita was 77.7% of the national average - also the lowest value among provinces, just behind the other Maritime provinces. Alberta reported the highest real GDP per capita among provinces.
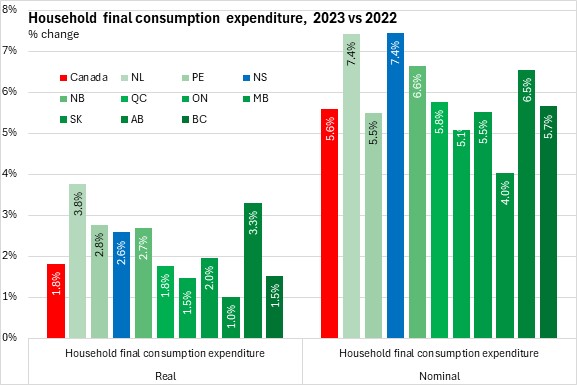
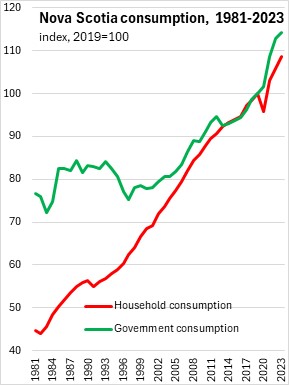
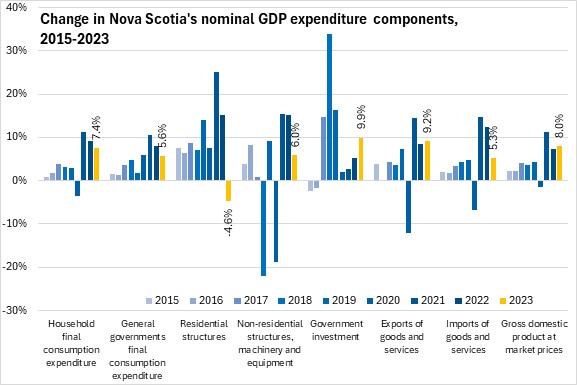
Nova Scotia's household consumer expenditures grew by 2.6% in real terms and 7.4% in nominal terms (tied for fastest among provinces). Higher spending on services was a major contributor to the 1.8% growth in national real household spending. Real consumer spending growth was fastest in Newfoundland and Labrador and slowest in Saskatchewan. Nominal household spending grew more rapidly in Nova Scotia as well as Newfoundland and Labrador (slowest in Saskatchewan).
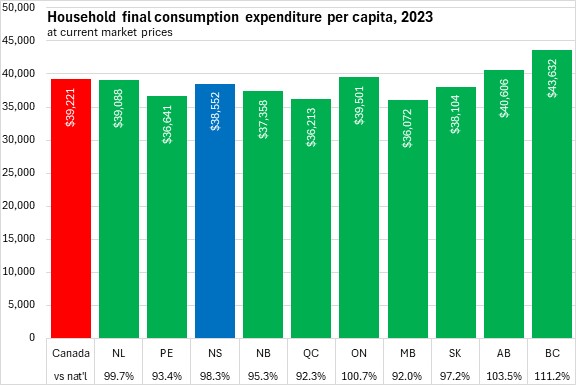
Despite nominal GDP per capita of 77.0% of the national average, Nova Scotia's nominal household consumer expenditures per capita were $38,552 in 2023 or 98.3% of the national average.
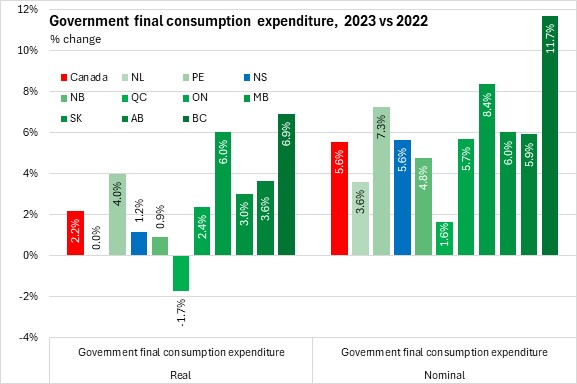
Final consumption expenditures from all levels of government were up 1.2% in real terms for Nova Scotia and 5.6% in nominal terms. National government expenditures grew 2.2% in real terms and 5.6% in nominal terms. British Columbia reported the fastest growth in government spending (both in real and nominal terms) while Québec reported the slowest growth in nominal terms and the only decline in real terms.
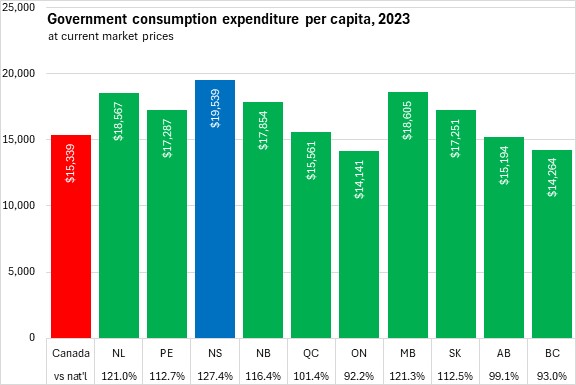
Nova Scotia reported the highest level of nominal government expenditures per capita among provinces at $19,539. As these expenditures include all levels of government, Nova Scotia's large military presence increases government expenditures per capita to 127.4% of the national average. Government consumption expenditures per capita were lowest in British Columbia and Ontario.
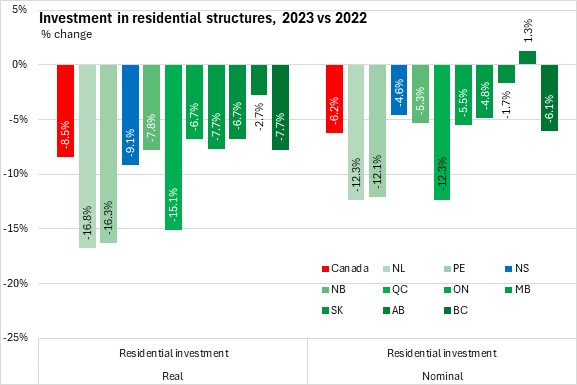
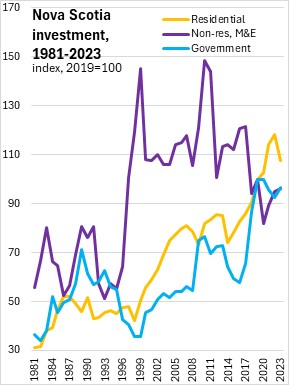
Nova Scotia's investment in residential structures (including both new and renovation spending) was down 9.1% in real terms and 4.6% in nominal terms. All provinces reported real declines in residential investment in 2023 with a national decline of 8.5%. Only Alberta reported an increase in nominal residential investment in 2023.
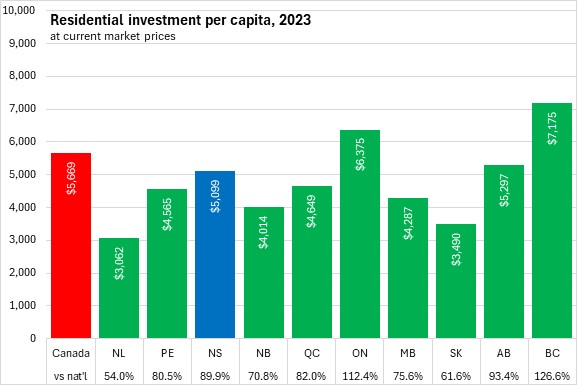
Nova Scotia's residential investments amounted to $5,099 per capita in 2023 or 89.9% of the national average. Residential investments per capita shown here are in nominal terms and elevated home prices in Ontario and British Columbia contribute to higher investments per capita in these provinces. Newfoundland and Labrador reported the lowest per capita investments in residential structures.
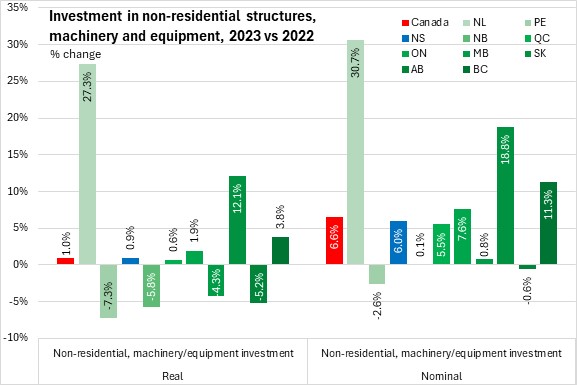
Nova Scotia had 0.9% growth in business investment for non-residential structures as well as machinery and equipment (6.0% in nominal terms). National growth in investment for non-residential structures, machinery and equipment was 1.0% in real terms and 6.6% in nominal terms. Oil and gas projects (particularly in Saskatchewan and Newfoundland and Labrador) contributed to growth while machinery and equipment investment fell.
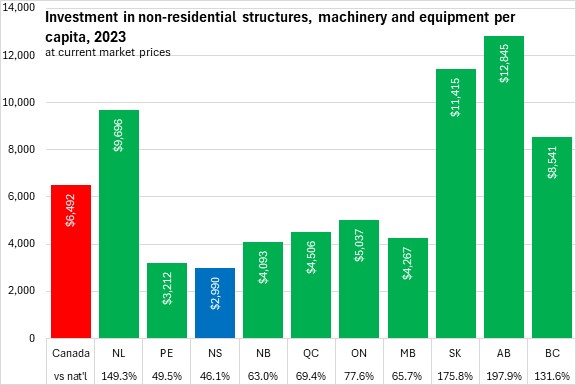
Nova Scotia's overall level of per capita business investment in non-residential structures, machinery and equipment was the lowest among provinces at $2,990. Canada's major resource-producing provinces (Alberta, Saskatchewan, Newfoundland and Labrador) all reported substantially higher per capita business investments in non-residential structures, machinery and equipment.
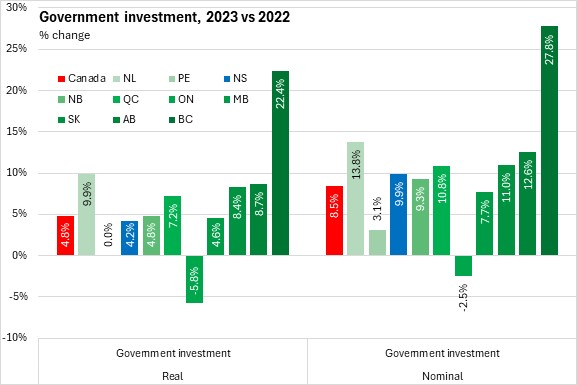
Government (as opposed to business) investment in Nova Scotia increased by 4.2% in real terms and 9.9% in nominal terms. Nationally, government investments increased 4.8% in real terms and 8.5% in nominal terms. Government investment growth was notably faster in British Columbia while Ontario reported lower government investments (both in real and nominal terms).
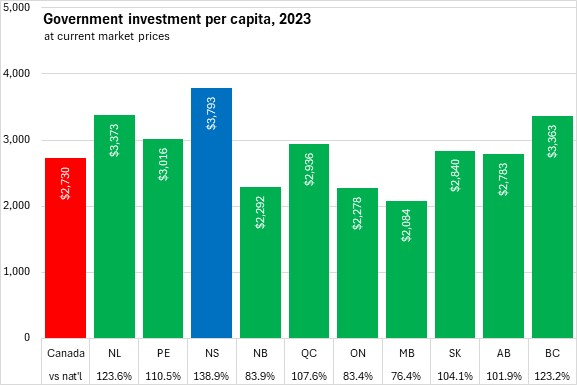
On a per capita basis, Nova Scotia reported the highest level of nominal government investments in 2023 at $3,793 or 138.9% of the national average. Manitoba reported the lowest level of government investment per capita in 2023.
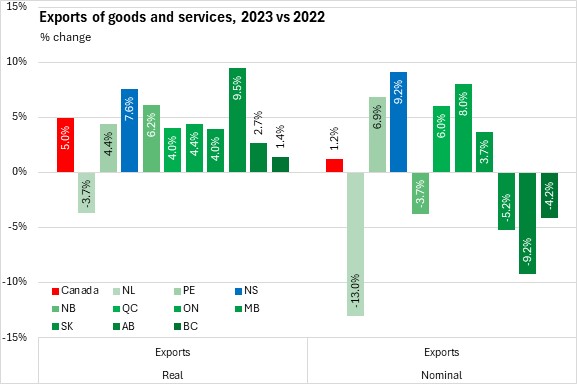
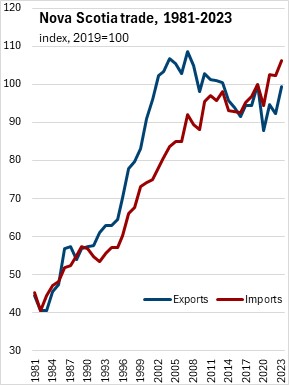
Nova Scotia's exports of goods and services - which includes both international and interprovincial destinations - increased by 7.6% in real terms and 9.2% in nominal terms. Nova Scotia had the second highest export growth in real terms, and fastest nominal growth, primarily driven by strong gains in both interprovincial and international services. Although real exports increased in every province except Newfoundland and Labrador (+5.0 nationally), nominal exports were down - including the effects of falling commodity prices - for Newfoundland and Labrador, New Brunswick and the three western provinces.
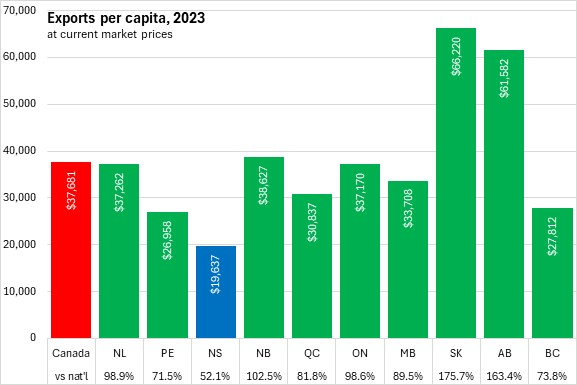
Nova Scotia's per capita exports were the lowest among provinces - by a substantial margin. The $19,637 in per capita interprovincial and international exports from Nova Scotia amounted to 52.1% of the national average. The next lowest province (Prince Edward Island) had exports of $26,958 per capita or 71.5% of the national average. Alberta and Saskatchewan reported the highest exports per capita.
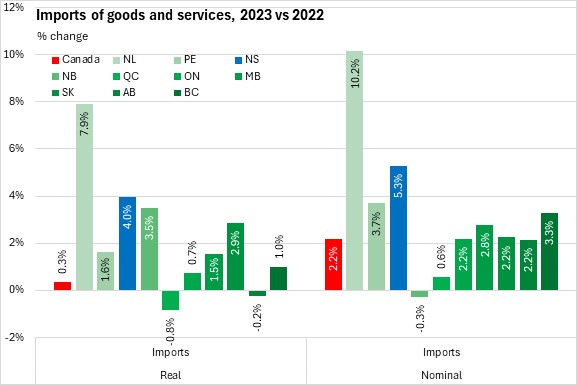
Nova Scotia's imports grew by 4.0% in real terms and 5.3% in nominal terms. Canada's real imports rose just 0.3% in 2023 (+2.2% in nominal terms). Imports grew in real terms for all provinces except Québec and Alberta. Newfoundland and Labrador reported the largest nominal growth in imports. New Brunswick reported the only nominal decline in imports (which includes the effects of falling crude oil prices destined for the province's refinery).
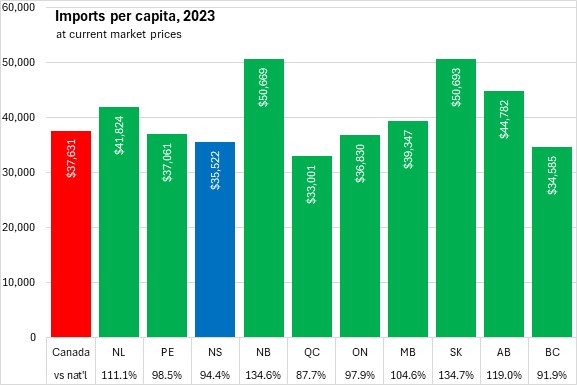
Nova Scotia's per capita imports amounted to $35,522 or 94.4% of the national average. Québec reported the smallest imports per capita while New Brunswick and Saskatchewan reported the highest imports per capita.
Nova Scotia's overall economic growth in 2023 was supported by strong export growth, rising household spending and elevated government investments. Overall GDP growth decelerated on more modest contributions from higher real government spending and weaker business investments in non-residential structures, machinery and equipment as well as falling real residential investment and rising imports.
Notably, Nova Scotia real government spending slowed for the second consecutive year. Real residential investment declined for the first time since 2014. Real government investment rebounded after three straight years of decline. Both exports and imports rebounded in 2023 after contractions in 2022.
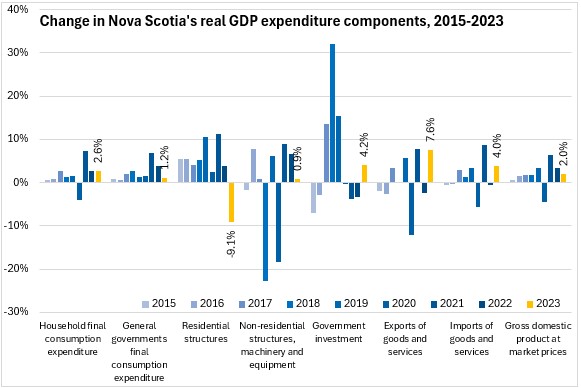
In nominal terms, contributions to growth slowed for household spending, government consumption, business investment in non-residential structures/machinery/equipment and residential investment (which was negative). There were rising contributions from government investment and exports along with a more modest drag from import growth.
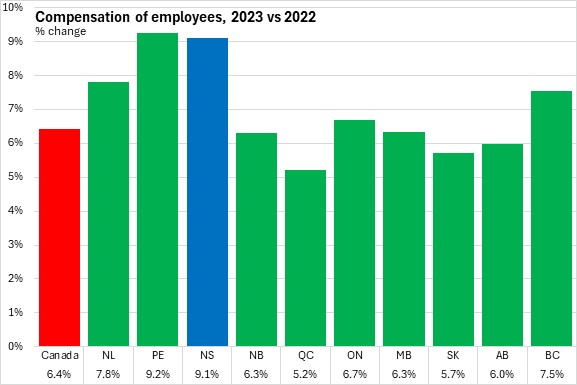
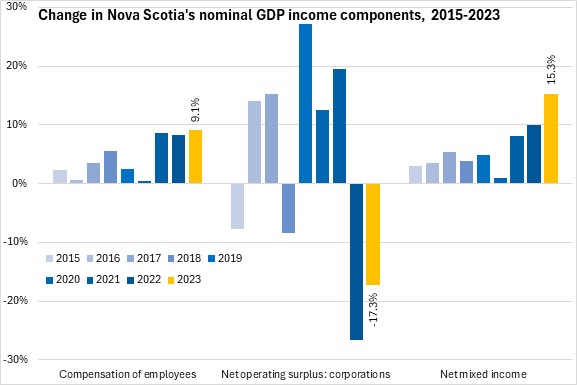
Compensation of employees for all industries in Nova Scotia was up 9.1% in 2023, the second fastest increase (behind Prince Edward Island). National employee compensation growth was 6.4% with gains in all provinces. Québec had the slowest growth, though this was still over 5%.
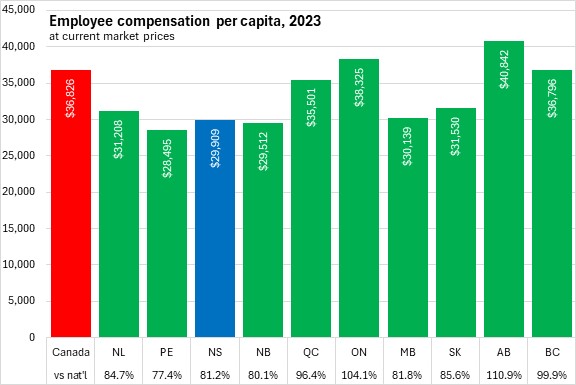
Nova Scotia's employee compensation per capita was $29,909 in 2023 or 81.2% of the national average. The Martime provinces had the lowest compensation per capita. Employee compensation per capita was $36,826 nationally with the highest values in Alberta and Ontario.
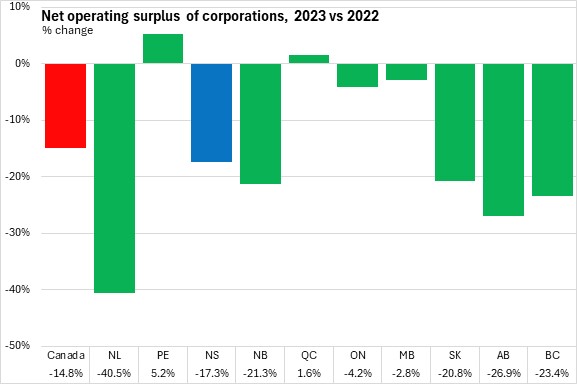
Growth in net operating surplus of corporations is typically volatile from one year to the next. Nova Scotia's net operating surplus of corporations was down 17.3% from 2022 to 2023. Nationally, net operating surplus of corporations fell 14.8% with declines in all provinces except Prince Edward Island and Québec. Newfoundland and Labrador reported the steepest decline in corporate net operating surplus.
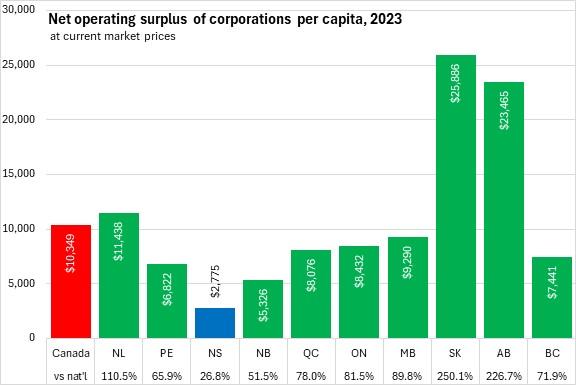
Nova Scotia reported by far the lowest corporate net operating surplus per capita at $2,775 in 2022 - just 26.8% of the national per capita average. The Maritime provinces had the lowest per capita corporate net operating surplus in 2022, while Alberta and Sasaktchewan reported substantially higher corporate net operating surplus per capita.
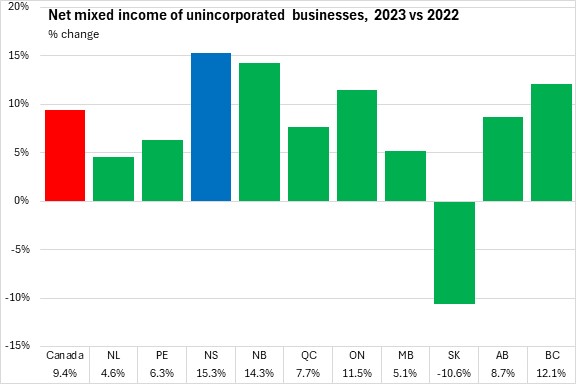
Nova Scotia reported a 15.3% increase in net mixed income of unincorporated businesses in 2023 - the fastest increase among provinces. Saskatchewan reported the only decline (after notably strong growth in 2022).
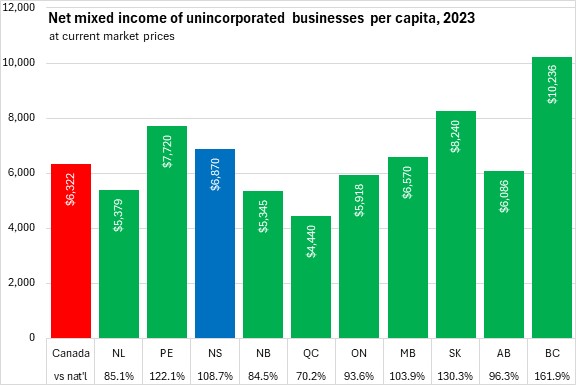
Unlike corporate net operating surplus, Nova Scotia's net mixed income per capita exceeds the national average at $6,870 (108.7% of national). British Columbia reported much higher per capita net mixed income of unincorporated businesses. Québec reported the lowest per capita net mixed income.
Growth in employee compensation made steady contributions to Nova Scotia's overall nominal GDP growth in 2023. Contributions from net mixed income continue to rise while net operating surplus of corporations has been a drag on growth in each of the last two years.
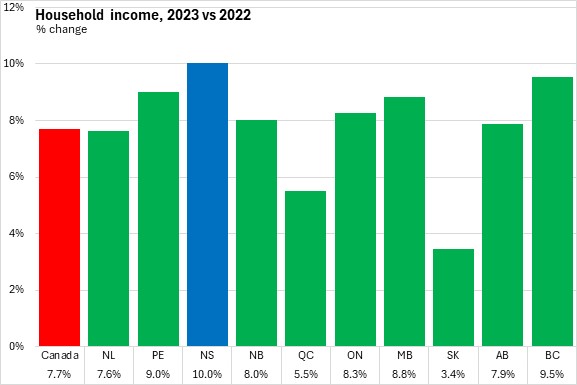
Household income grew by 10.0% in Nova Scotia in 2023, the fastest rise among provinces. Nationally, household income was up 7.7% with increases in all provinces. Saskatchewan reported the slowest growth in household income in 2023.
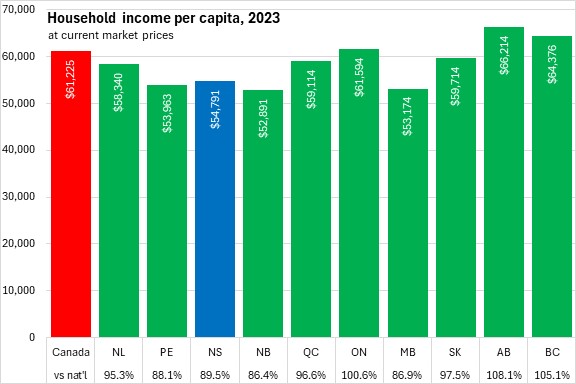
Nova Scotia's per capita household income was $54,791 in 2023 or 89.5% of the national average. Alberta reported the highest per capita household income. The gap between lowest (New Brunswick, 86.4% of national) and highest (Alberta, 108.1% of national) per capita household income is substantially narrower than reported for per capita nominal GDP.
Household income includes employee compensation, net mixed income, property income received and current transfers received. It is reported on a national basis for all resident households rather than a domestic basis for all income paid in the province (regardless of household residency).
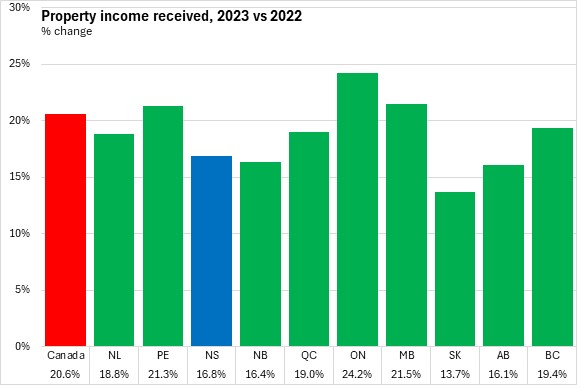
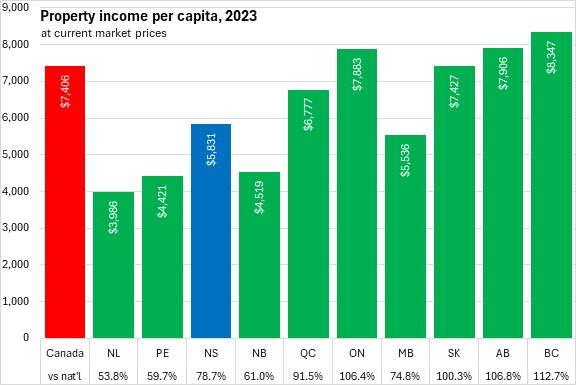
Property income received by households (such as interest, dividends, pensions) increased by 16.8% in Nova Scotia in 2023, slower than the national average growth of 20.6%. All provinces reported double digit gains in property income receipts for 2023, led by Ontario (Saskatchewan lagging).
Nova Scotia's property income receipts were $5,831 per capita or 78.7% of the national average. Receipts were highest in British Columbia, Alberta and Ontario and lowest in the three Atlantic provinces outside Nova Scotia.
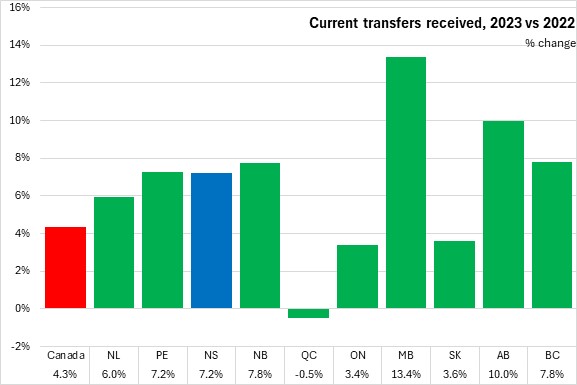
Current transfers received grew by 7.2% in Nova Scotia, faster than the national increase of 4.3% in 2023. Manitoba reported the fastest growth in income from current transfer receipts while Québec reported the only decline.
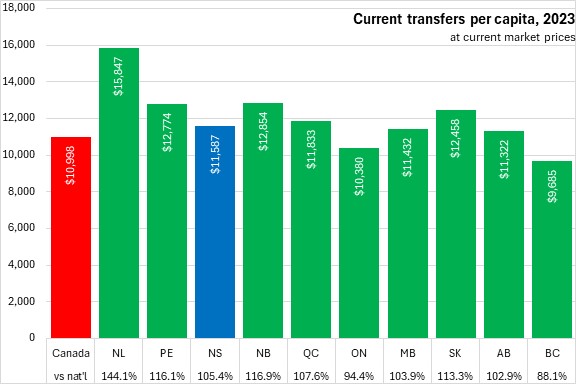
Current transfers per capita were highest in Newfoundland and Labrador and lowest in British Columbia. Nova Scotia's current transfers per capita were $11,587 or 105.4% of the national average.
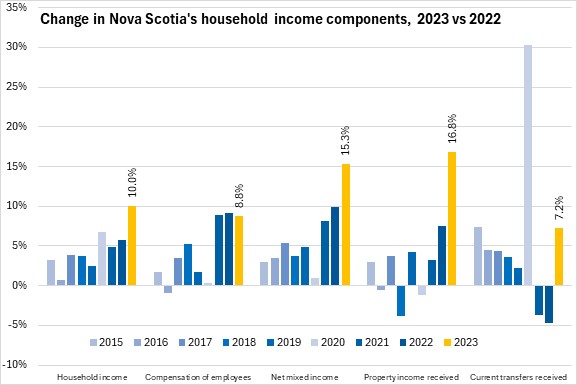
Nova Scotia's growth in household income in 2023 came from all components, with rising contributions from mixed income, property income and current transfers.
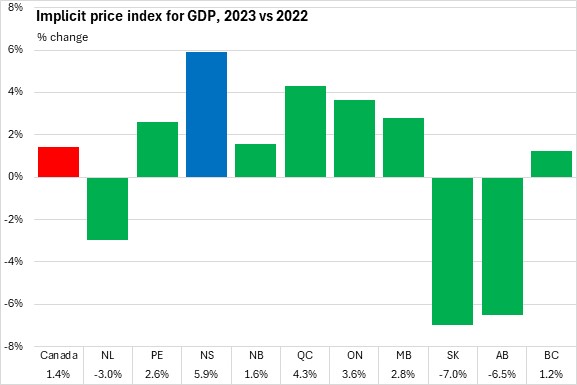
The GDP deflator is the implicit price index that establishes the difference between nominal GDP growth (which includes both price and volume gains) and real GDP growth (which includes only volume changes). This implicit price index is a broader measure of price growth than the consumer price index, which only considers a fixed basket of household consumption items.
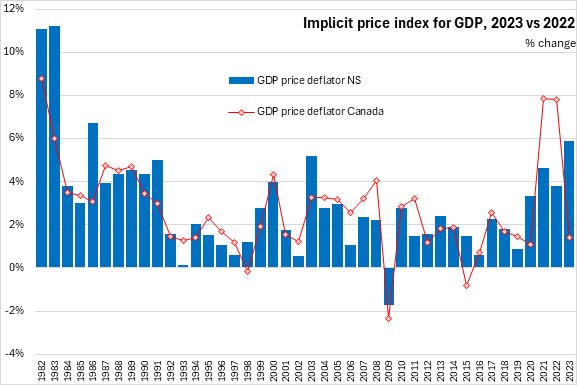
Nova Scotia reported the fastest growth among provinces in the GDP deflator at 5.9% in 2023, up from 3.8% in 2022. Nationally, the GDP deflator grew by 1.4% in 2023. The three major resource-producing provinces, which are more impacted by commodity price declines all reported broad price declines in 2023.
Nova Scotia's 5.9% increase in the implicit price index for GDP was the fastest since 1986.
Notes: Income and expenditure accounts provide the official estimates of Nova Scotia's gross domestic product (GDP) and select indicators. The estimates released today include revisions for the years 2021 and 2022 and the first estimate of expenditure and income for 2023. GDP as measured by the expenditure account refers to all final consumption and investment spending not bound for further production in the Nova Scotia economy in the year. Exports are added to this whether these are final or intermediate goods they are not bound for further production in Nova Scotia in the year. Imports are subtracted from this value (regardless of whether they are final or intermediate products) as any final expenditure that includes direct or embedded imports would not generate income for Nova Scotia factors of production in the year.
In the income accounts, GDP represents the generation of income from production activities. This income is spread across compensation of employees (in all industries), operating surplus of corporations (including both net operating surplus and consumption of fixed capital), mixed income of unincorporated businesses (including net mixed income as well as consumption of fixed capital by unincorporated businesses) along with adjustments to taxes on products and taxes on production. The analysis below focuses on employee compensation, net operating surplus of corporations and net mixed income of unincorporated businesses - all measured in nominal terms.
Household income includes components from the income account of GDP: employee compensation net mixed income (but measured on a 'national' basis for all resident households as opposed to 'domestic' basis for all activities inside Nova Scotia). The rest of household income is made up of earnings that are not derived from current production: property income received from ownership of real or financial assets as well as current transfers received from governments and corporations.
Source: Statistics Canada. Table 36-10-0221-01 Gross domestic product, income-based, provincial and territorial, annual (x 1,000,000); Table 36-10-0222-01 Gross domestic product, expenditure-based, provincial and territorial, annual (x 1,000,000); Table 36-10-0482-01 Property income of households, provincial and territorial (x 1,000,000); Table 36-10-0226-01 Household sector, selected indicators, provincial and territorial; Table 36-10-0223-01 Implicit price indexes, gross domestic product, provincial and territorial
<--- Return to Archive