The Economics and Statistics Division maintains archives of previous publications for accountability purposes, but makes no updates to keep these documents current with the latest data revisions from Statistics Canada. As a result, information in older documents may not be accurate. Please exercise caution when referring to older documents. For the latest information and historical data, please contact the individual listed to the right.
<--- Return to Archive
For additional information relating to this article, please contact:
November 27, 2024GDP BY CENSUS METROPOLITAN AREA, 2021 Statistics Canada has released Gross Domestic Product (GDP) data for Canada's Census Metropolitan Areas (CMAs) and the areas outside of CMAs for 2021. All data are benchmarked to provincial nominal GDP at basic prices. Note that CMA geographies reflect 2016 Census of Population boundaries.
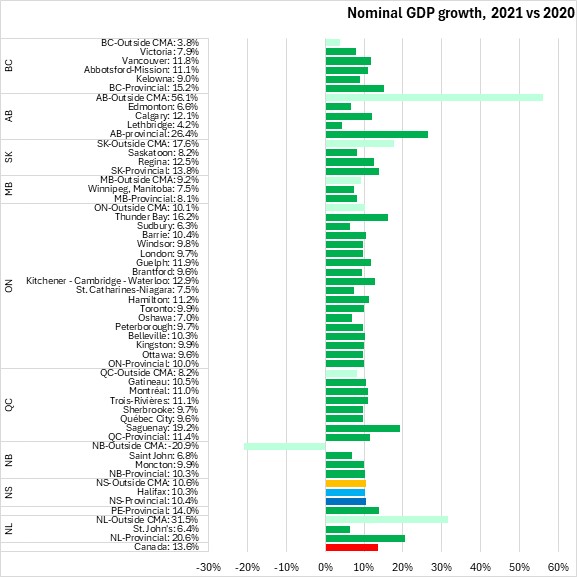
The results for 2021 continue to show that just over half (51.5%) of Canada's GDP was generated in six CMAs: Toronto, Montréal, Vancouver, Calgary, Edmonton and Ottawa. In 2021, CMAs generated 74.9% of Canadian GDP.
In Nova Scotia, Halifax generated 57.8% of provincial GDP in 2021.
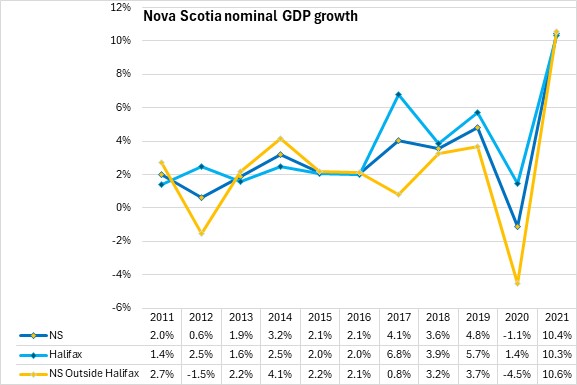
From 2020 to 2021, Nova Scotia's nominal GDP grew 10.4%. Halifax GDP grew by 10.3% while GDP outside the city grew by 10.6%. Across Canada, nominal GDP rebounded 13.6% in 2021, with all CMAs reporting improvements after pandemic-related slowdowns in most cities in 2020. The only contraction was in non-CMA New Brunswick. Among CMAs, the strongest growth was in Saguenay and Thunder Bay.
Nova Scotia's nominal GDP in 2021 was $46.6 billion, of which $27.0 billion was generated in Halifax and $19.7 billion was generated outside of Halifax.
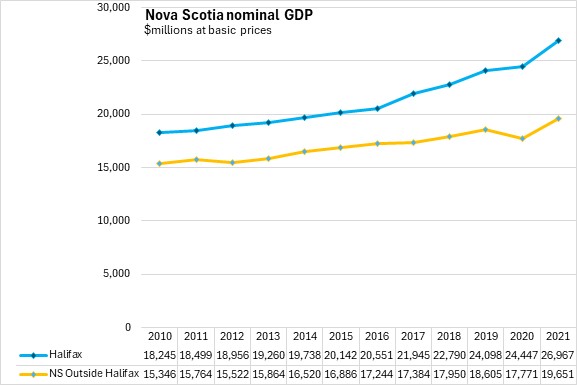
Nominal GDP both in Halifax and outside Halifax CMA grew in 2021 following contractions in 2020.
 Source: Statistics Canada. Table 36-10-0468-01 Gross domestic product (GDP) at basic prices, by census metropolitan area (CMA) (x 1,000,000); Table 17-10-0135-01 Population estimates, July 1, by census metropolitan area and census agglomeration, 2016 boundaries; Table 17-10-0005-01 Population estimates on July 1st, by age and sex
<--- Return to Archive