The Economics and Statistics Division maintains archives of previous publications for accountability purposes, but makes no updates to keep these documents current with the latest data revisions from Statistics Canada. As a result, information in older documents may not be accurate. Please exercise caution when referring to older documents. For the latest information and historical data, please contact the individual listed to the right.
<--- Return to Archive
For additional information relating to this article, please contact:
January 30, 2025HOUSEHOLD INCOME AND CONSUMPTION, Q3 2024 Household Income and Outlay
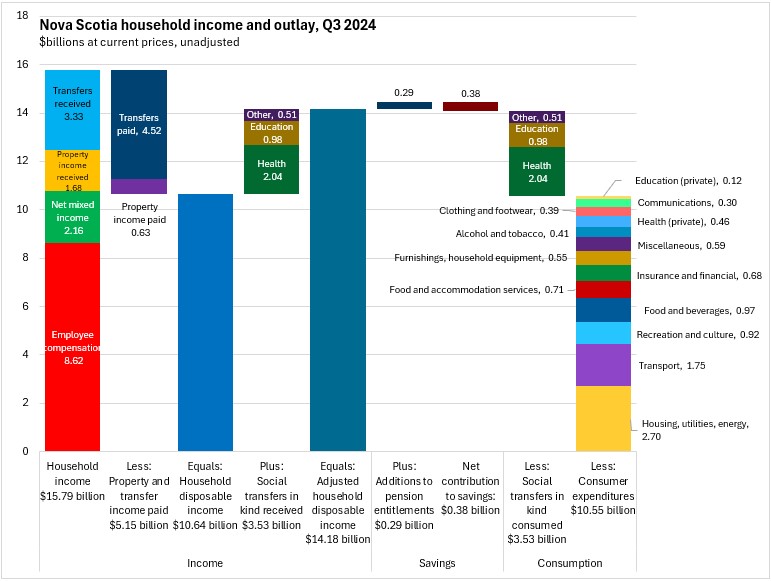
In addition to compensation of employees, household income also includes net mixed income (generated from unincorporated businesses), property income received (generated as the result of ownership of assets) and current transfers received (generally from government).
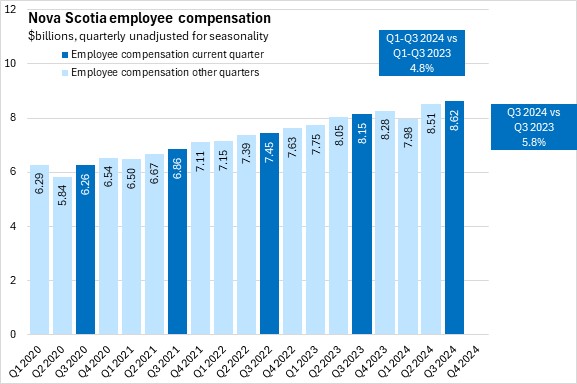
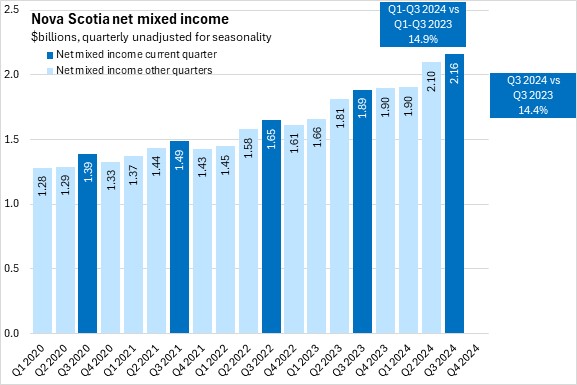
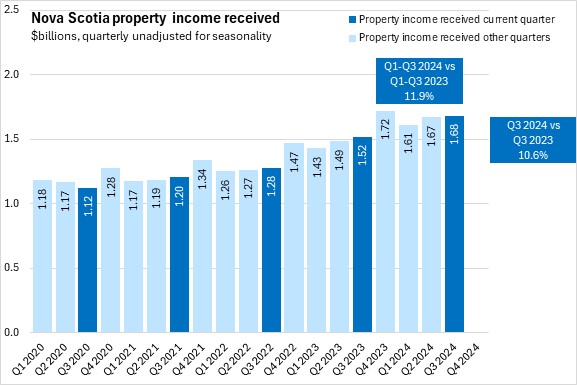
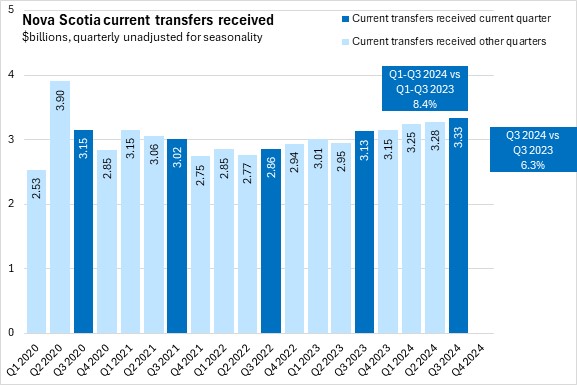
Nova Scotians received $15.79 billion in household income in Q3 2024, including $8.62 billion in employee compensation, $2.16 billion in net mixed income, $1.68 billion in property income received and $3.33 in current transfers received.
After paying current transfers (including income taxes) of $4.52 billion and property income of $0.63 billion, Nova Scotia disposable income was $10.64 billion in Q3 2024. Including the $3.53 billion value of social transfers in kind received from governments or non-profits in the form of services provided for households, Nova Scotia had adjusted disposable income of $14.18 billion.
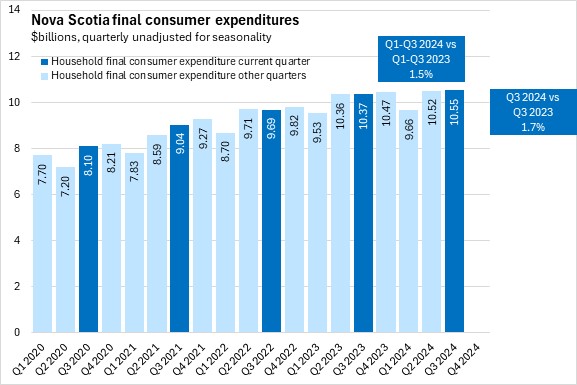
The consumption of social transfers in kind matches the value of social transfers received ($3.53 billion), while households spent $10.55 billion on consumer expenditures. The value of household final consumption expenditures and social transfers in kind was less than the adjusted household disposable income, with the surplus resulting in an increase in savings of $0.38 billion in household savings and a $0.29 billion change in pension entitlements.
Household income
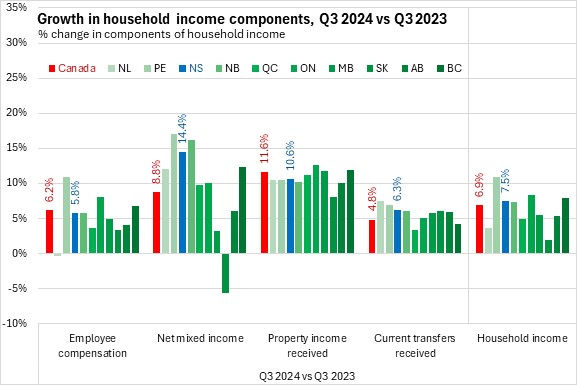
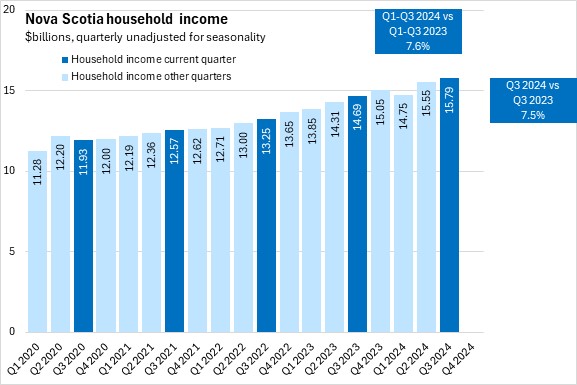
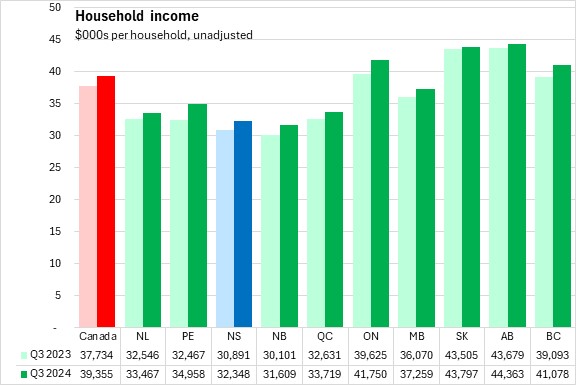
Nova Scotia's overall household income growth from Q3 2023 to Q3 2024 was 7.5%, which was faster than the national growth of 6.9%. All provinces reported rising household income year-over-year, with the fastest increase in Prince Edward Island and the slowest gain in Saskatchewan.
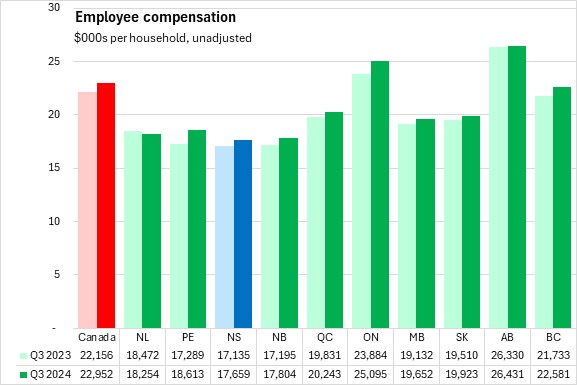
Nova Scotia's rising household income reflected employee compensation growth of 5.8%. Nationally, employee compensation was up 6.2% year-over-year with gains in all provinces except Newfoundland and Labrador. Prince Edward Island had the fastest rise in employee compensation.
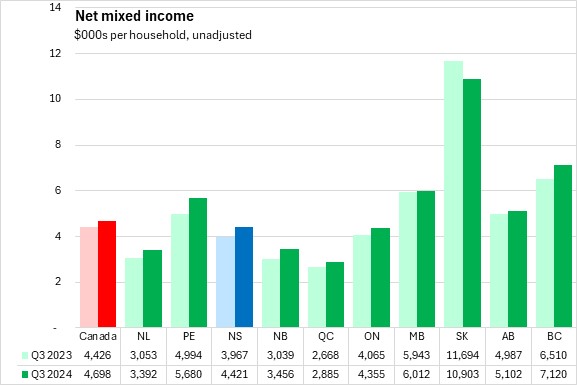
Nova Scotia's net mixed income from unincorporated businesses grew 14.4% from Q3 2023 to Q3 2024. National net mixed income was up 8.8%. The three Maritime provinces reported the fastest growth rates from Q3 2023 to Q3 2024 while Saskatchewan reported the only decline.
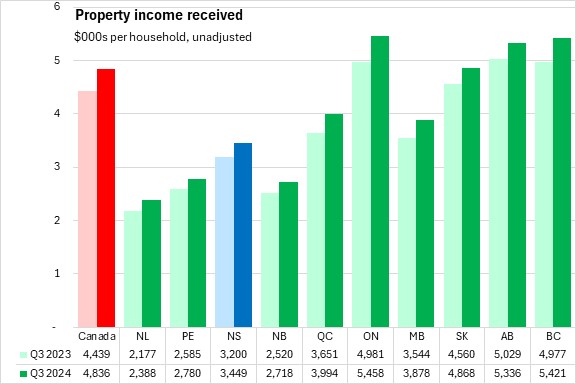
Nova Scotia's growth in property income receipts was 10.6%. The national average gain in property income received was 11.6% with the fastest growth rate in Ontario. Saskatchewan reported the weakest growth in property income receipts.
Current transfers received were up 6.3% in Nova Scotia from Q3 2023 to Q3 2024, the third fastest rise among provinces after Newfoundland and Labrador and Prince Edward Island. The national pace of transfer growth was 4.8%. All provinces reported higher transfers, with Québec reporting the slowest rise.
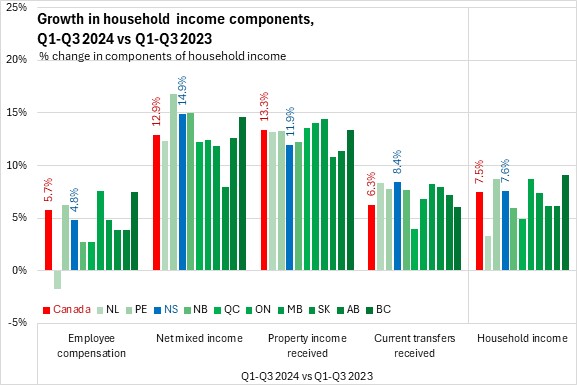
Through the first three quarters of 2024, Nova Scotia's household income increased by 7.6% compared with the same period in 2023, which was slightly faster than the national pace of 7.5%. British Columbia reported the fastest year-to-date growth in household income while Québec reported the slowest growth.
Nova Scotia's employee compensation growth of 4.8% year-to-date lagged the national pace of 5.7%. All provinces except Newfoundland and Labrador reported rising employee compensation with the fastest gains in Ontario and British Columbia.
Net mixed income grew by 14.9% year-to-date in Nova Scotia. Net mixed income was up 12.9% nationally. The fastest growth was in Prince Edward Island while Saskatchewan reported the slowest growth in net mixed income.
Nova Scotia's property income receipts also grew by 11.9%, slower than the national rise of 13.3%. All provinces reported rising property income receipts year-to-date with the fastest gain in Manitoba and the slowest in Saskatchewan.
Nova Scotia reported an 8.4% increase in current transfer income, the fastest year-to-date increase among provinces (just ahead of Newfoundland and Labrador and Manitoba). National current transfers grew 6.3% with the slowest gain in Québec.
In Q3 2024, Nova Scotia's household income was $32,348 per household or 82.2% of the national average ($39,355). The highest income per household was in Alberta and lowest in New Brunswick (followed by Nova Scotia).
Nova Scotia's employee compensation $17,659 per household, amounting to 76.9% of the national average per household ($22,952). Alberta reported the highest employee compensation per household and Nova Scotia the lowest.
Nova Scotia's net mixed income generated by unincorporated businesses amounted to $4,421 per household, which was 94.1% of the national average per household of $4,698. Across Canada, the highest value of net mixed income per household was in Saskatchewan and the lowest was in Québec.
Nova Scotia property income received in Q3 2024 was $3,449 per household, which was 71.3% of the national average ($4,836 per household). The highest property income values were in British Columbia, Alberta, and Ontario. The lowest property income per household was in Newfoundland and Labrador.
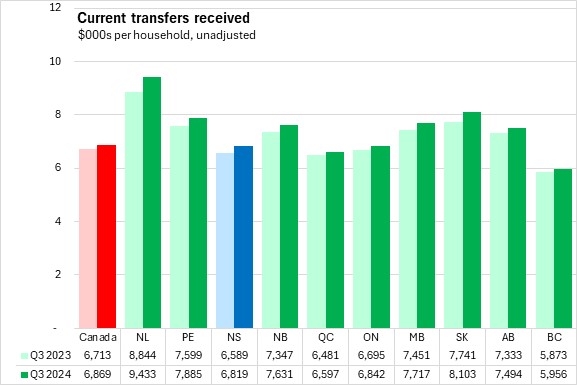
Current transfers received in Nova Scotia were $6,819 per household in Q3 2024. Current transfers received in Nova Scotia were 99.3% of the national average per household ($6,869). Transfers per household were highest in Newfoundland and Labrador and lowest in British Columbia.
Household Consumer Expenditures
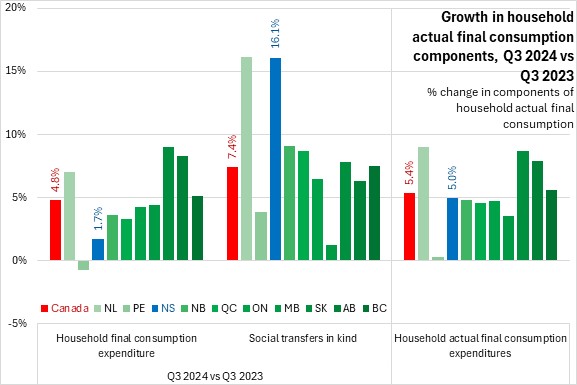
Comparing Q3 2024 with Q3 2023, Nova Scotia's household consumer expenditures increased by 1.7%, slower than the national pace of 4.8%. Year-over-year growth in consumer expenditures was notably stronger in Saskatchewan and Alberta. Prince Edward Island reported the only year-over-year decline in household consumption expenditures.
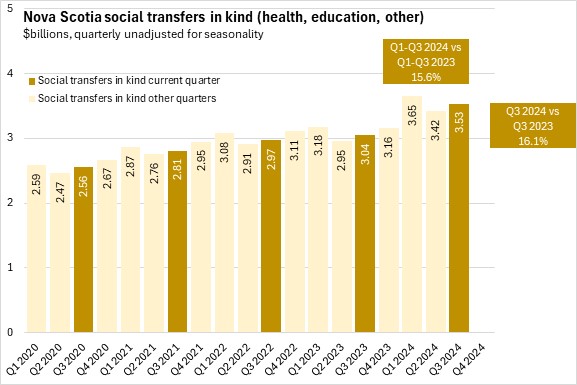
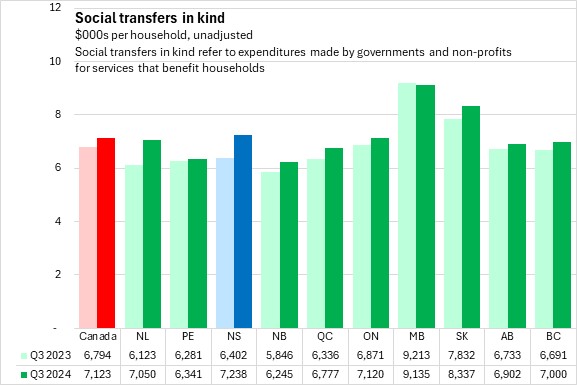
Social transfers in kind refer to services that are provided for the benefit of households but are paid for by governments and non-profits. These are primarily health and education expenditures, which add to private expenditures made on these services. Social transfers in kind increased by 16.1% in Nova Scotia, the second fastest gain after Newfoundland and Labrador from Q3 2023 to Q3 2024. Social transfers in kind were up in every province with Manitoba reporting the slowest rise.
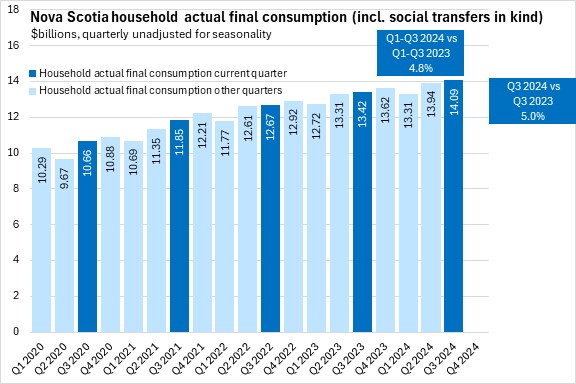
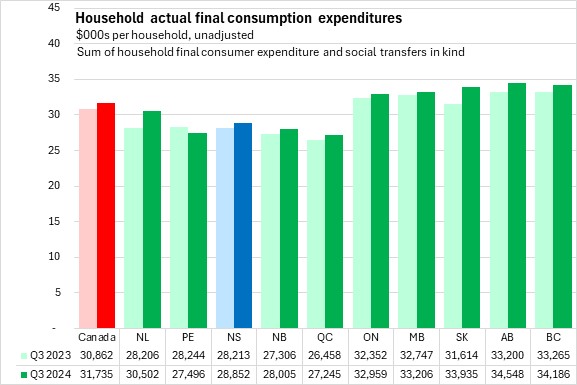
The sum of household final consumer expenditures and social transfers in kind is termed 'household actual final consumption expenditures', which reflects the benefits to households from both private expenditures as well as services provided by governmens and non-profits. Combining these two components led to household actual final consumption growth of 5.0% for Nova Scotia, which slowest than the nationa gain of 5.4%. Newfoundland and Labrador and Saskatchewan reported the fastest growth in household actual final consumption year-over-year while Prince Edward Island reported the slowest growth.
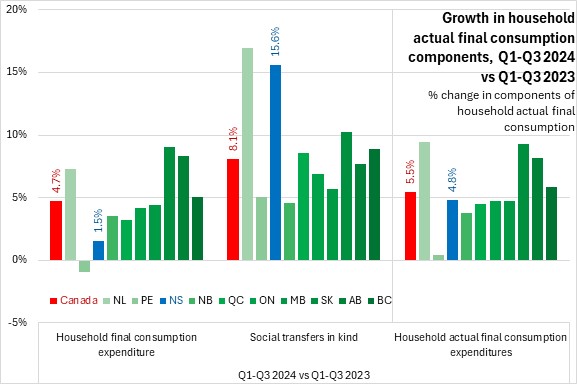
Year-to-date (Q1-Q3 2024 vs Q1-Q3 2023) household consumption grew by 1.5% in Nova Scotia, the second weakest performance (after a decline in Prince Edward Island). Nationally, household consumption expenditures were up 4.7% with faster gains in Alberta and Saskatchewan. Nova Scotia's social transfers in kind rose by 15.6%, outpacing all other provinces except Newfoundland and Labrador. In total, Nova Scotia's household actual final consumption grew by 4.8% year-to-date. National growth in household actual final consumption was 5.5%, with the fastest gains in Saskatchewan and Newfoundland and Labrador. The slowest rise in household actual final consumption was reported in Prince Edward Island.
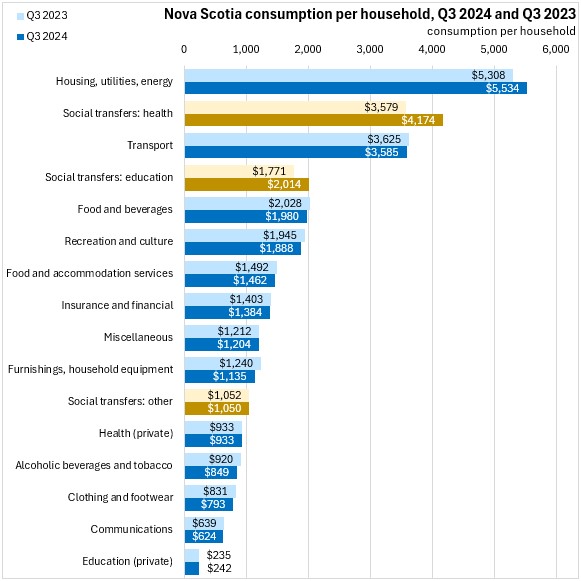
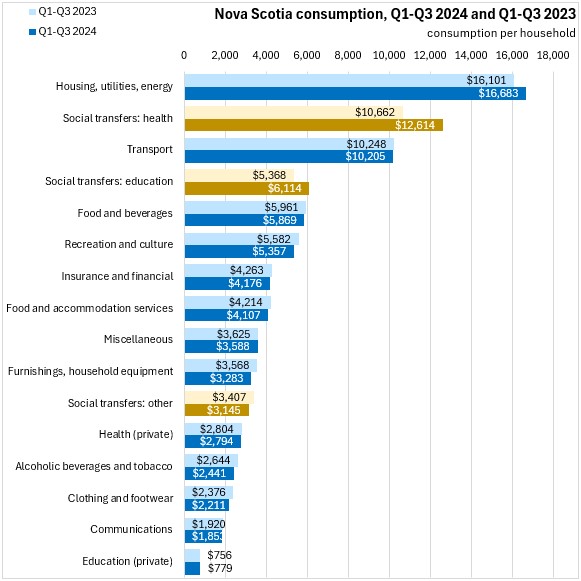
Among the categories of actual final consumption expenditures, housing/utilities/energy made up the largest category of household consumer expenditures, followed by social transfers in kind for health care, transportation, social transfers in kind for education, food/beverages and recreation/culture.
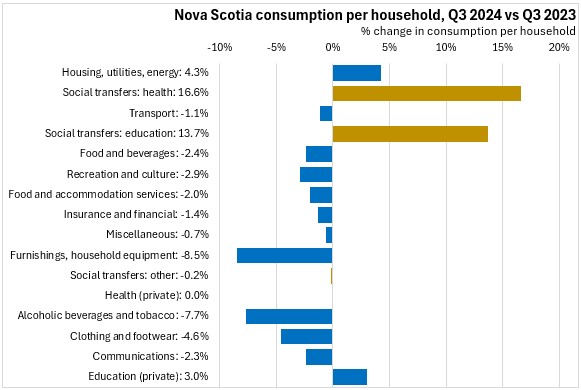
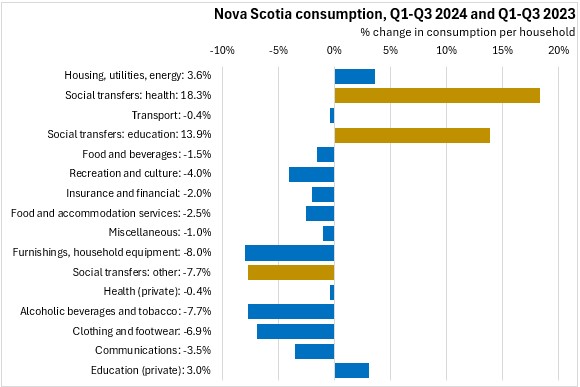
From Q3 2023 to Q3 2024, growth in per household spending was fastest in social transfers for health and for education, followed by housing/utilities/energy. Expenditures were down for 11 categories with the largest percentage declines in alcoholic beverages/tobacco and household furnishings/equipment.
Year-to-date expenditures per household in Nova Scotia were largest for housing/utilities/energy, social transfers for health, transportation, social transfers for education, food/beverages and recreation/culture.
Nova Scotia per household expenditures grew fastest for health and educaiton social transfers along with housing/utilities/energy. Year-to-date per household spending on most other categores were down in Nova Scotia, with the steepest percentage declines in furnishings/household equipment, alcoholic beverages/tobacco and other social transfers in kind.
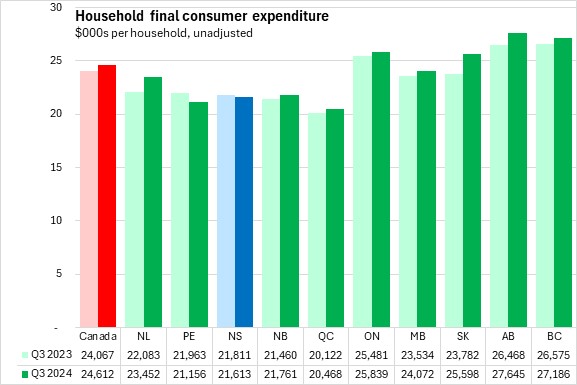
Nova Scotia's final consumer expenditures (paid for private by households) amounted $21,613 per household (87.8% of the national average per household). Across Canada, final consumer expenditures per household were $24,612 with the highest values in British Columbia and Alberta and the lowest value in Québec.
In Q3 2024, Nova Scotian households received $7,238 per household worth of social transfers in kind (101.6% of the national average per household). Across Canada, social transfers in kind were $7,123 per household with the highest value in Manitoba and the lowest value in New Brunswick.
Nova Scotia's household actual final consumption expenditures in Q3 2024 were $28,852 per household (90.9% of the national average per household). National household actual final consumption expenditures were $31,735 per household with the highest value in Alberta and the lowest value in Québec.
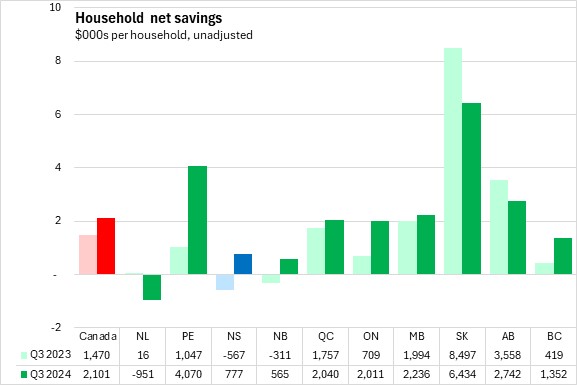
In Q3 2024, Nova Scotia's net savings per household were +$777, an improvement from the net negative savings of -$567 per household in Q3 2023. Only Newfoundland and Labrador reported negative net savings in Q3 2024. Nationally, savings averaged $2,101 per household in Q3 2024 with notably higher savings in Saskatchewan
Source: Statistics Canada. Table 36-10-0663-01 Distributions of household economic accounts, income, consumption and saving, Canada, provinces and territories, quarterly (x 1,000,000)
<--- Return to Archive