The Economics and Statistics Division maintains archives of previous publications for accountability purposes, but makes no updates to keep these documents current with the latest data revisions from Statistics Canada. As a result, information in older documents may not be accurate. Please exercise caution when referring to older documents. For the latest information and historical data, please contact the individual listed to the right.
<--- Return to Archive
For additional information relating to this article, please contact:
February 26, 2025CAPITAL EXPENDITURES, 2023 (ACUTAL), 2024 (PRELIMINARY) AND 2025 (INTENTIONS) Statistics Canada has released preliminary estimates for 2024 and intentions for 2025 (along with revised actuals for 2023) from the annual survey of capital expenditures for non-residential construction and machinery and equipment.
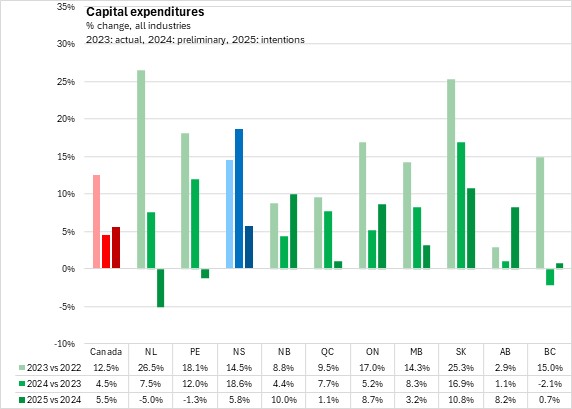
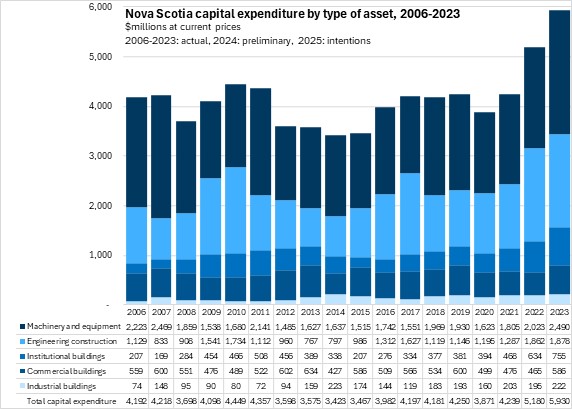
Nova Scotia's capital expenditures were $5.93 billion in 2023, a 14.5% gain over 2022. Nova Scotia's preliminary estimates for capital expenditures in 2024 were $7.03 billion, a further 18.6% increase over 2023. For 2025, capital investment intentions amounted to $7.44 billion, a 5.8% rise over 2024 preliminary values.
Across Canada, capital expenditure growth decelerated from 12.5% growth in 2023 to 4.5% in 2024, with intentions showing a slight acceleration to 5.5% in 2025.
In 2023, all provinces reported rising capital investments, led by increases in Newfoundland and Labrador and Saskatchewan. Alberta reported the slowest gain in capital expenditures in 2023. For 2024, preliminary investment data indicate gains in all provinces except British Columbia. Nova Scotia was estimated to have the fastest investment growth in 2024 preliminary results. All province except Newfoundland and Labrador and Prince Edward Island reported increasing investment intentions fort 2025 compared with 2024. Saskatchewan and New Brunswick reported the largest gains in capital investment intentions for 2025.
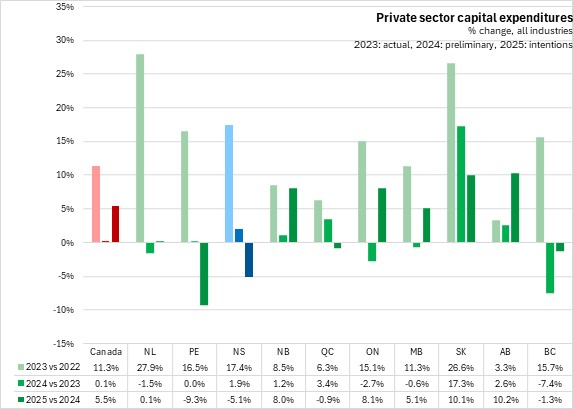
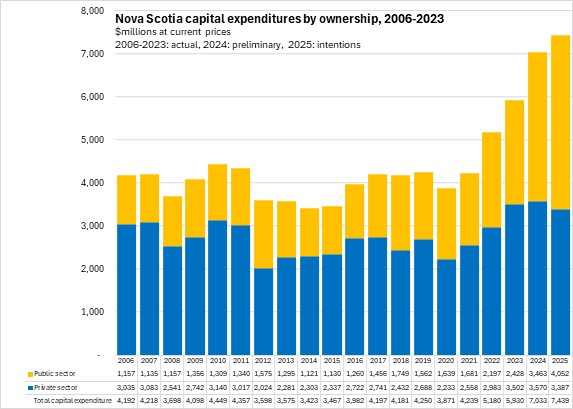
Nova Scotia's private capital expenditures were $3.50 billion in 2023, up 17.4% from 2022. Nova Scotia private capital expenditures increased by 1.9% to $3.57 billion in 2024 with investment intentions slated to decline (-5.1%) to $3.39 billion for 2025.
Nationally, private capital expenditure growth slowed accelerated to 11.3% in 2023 before plateauing at 0.1% growth in 2024 with 5.5% growth in investment intentions for 2025. Newfoundland and Labrador led private capital expenditure growth in 2023 (all provinces reported gains), while Alberta reported the slowest growth. Saskatchewan is estimated to have led all provinces in private investment growth in 2024 (six provinces reporting increases) while British Columbia reported the steepest decline. For 2025, six provinces are projected to experience private capital investment growth, led by Alberta and Saskatchewan. Prince Edward Island is projected to have the steepest decline in private capital investment in 2025.
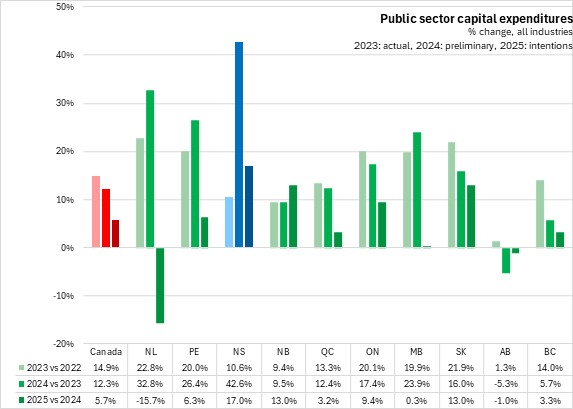
Nova Scotia's public capital expenditures reached $2.43 billion in 2023, up 10.6% from 2022. Public capital spending in Nova Scotia accelerated sharply with a further 42.6% increase in 2024, rising to $3.46 billion. For 2025, public capital expenditure intentions continue to grow strongly (+17.0%) to $4.05 billion.
National public capital spending increased by 14.9% in 2023 and by 12.3% in 2024. Public capital expenditure intentions in Canada are projected to slow to growth of 5.7% in 2025. With the exceptions of Newfoundland and Labrador in 2025 and Alberta in 2024 and 2025, public capital spending is up in each year. Newfoundland and Labrador reported the fastest growth in public capital expenditures in 2023. Nova Scotia reported the fastest growth in public capital expenditures in 2024 as well as in 2025 intentions.
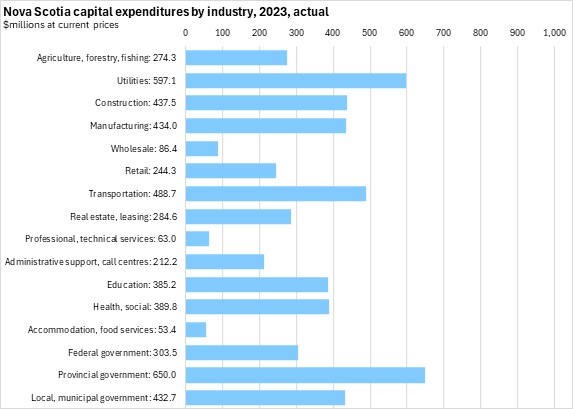
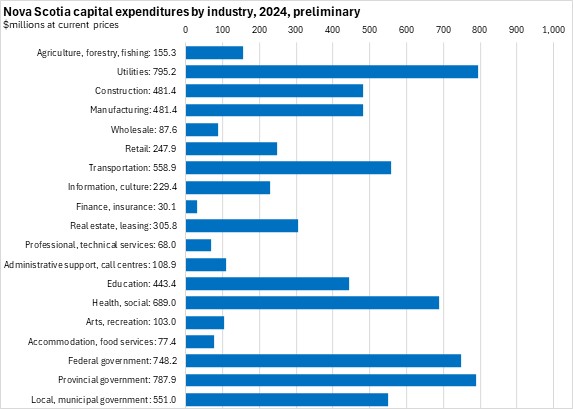
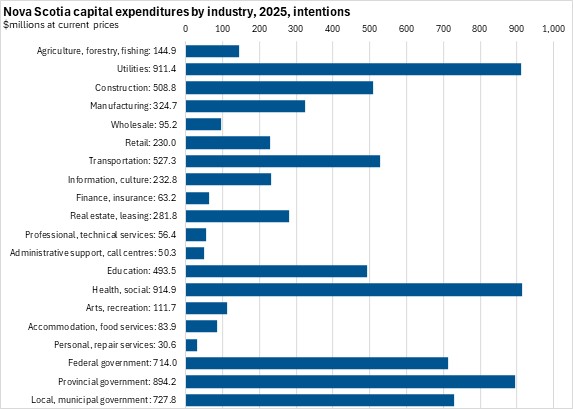
Among Nova Scotia's capital expenditures by detailed industry, the largest investments typically come from the governments (all three orders), utilities, transportation, construction, manufacturing, health care and education.
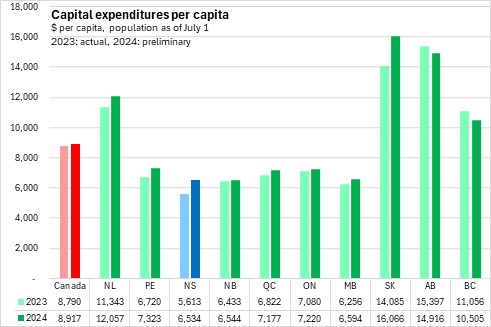
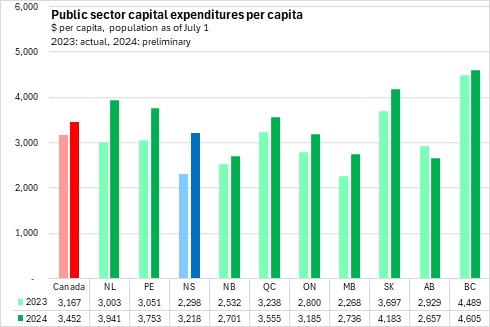
Despite continued growth in capital expenditures, Nova Scotia reported the lowest per capita capital spending of any provinces in either 2023 or 2024. Capital expenditures per capita were notably higher in resource-producing provinces (Alberta, Saskatchewan and Newfoundland and Labrador) as well as in British Columbia.
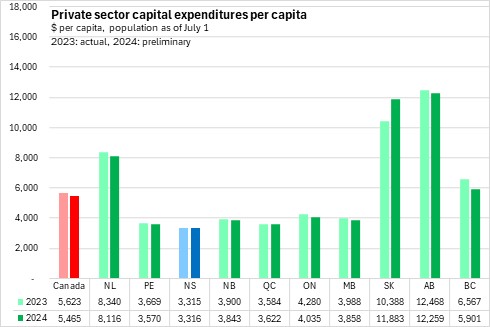
Nova Scotia's private capital expenditures were the lowest per capita values among provinces in each of 2023 and 2024. Private capital investments per capita were highest in Alberta, Saskatchewan and Newfoundland and Labrador.
In 2023, Nova Scotia's public capital expenditures were the second lowest per capita value among provinces (ahead of only Manitoba). With accelerating growth in 2024, Nova Scotia's per capita public investments moved up to fifth among provinces. British Columbia reported the highest per capita public investments in both 2023 and 2024.
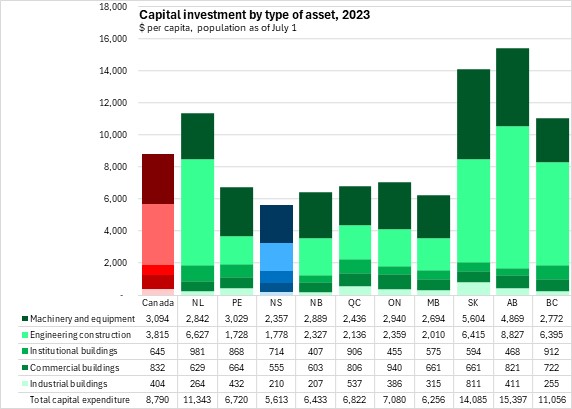
The difference in capital expenditures per capita among provinces is primarily explained by engineering construction (marine, transportation, water/sewage, communications, electric power, oil/gas and mining) as well as machinery and equipment (transportation equipment, industrial/processing equipment, computers, telecommunications equipment, commercial/service industry equipment and scientific instruments).
Trends
Nova Scotia's actual capital spending in 2023 was the highest reported in data going back to 2006, reflecting increases in both engineering construction and machinery spending. Intentions for 2025 suggest even larger capital expenditures.
Nova Scotia's private capital expenditures peaked in 2024. Public capital expenditures in 2024 were more than twice their levels from 2021. Intentions for 2025 public capital expenditures are even larger.
Source: Statistics Canada. Table 34-10-0035-01 Capital and repair expenditures, non-residential tangible assets, by industry and geography (x 1,000,000); Table 34-10-0038-01 Capital and repair expenditures, non-residential tangible assets, by type of ownership and geography (x 1,000,000);Table 34-10-0063-01 Capital expenditures, non-residential tangible assets, by type of asset and geography (x 1,000,000); Table 17-10-0009-01 Population estimates, quarterly
<--- Return to Archive