The Economics and Statistics Division maintains archives of previous publications for accountability purposes, but makes no updates to keep these documents current with the latest data revisions from Statistics Canada. As a result, information in older documents may not be accurate. Please exercise caution when referring to older documents. For the latest information and historical data, please contact the individual listed to the right.
<--- Return to Archive
For additional information relating to this article, please contact:
May 01, 2025US PERSONAL INCOME AND OUTLAY, MARCH 2025 Month over month (March vs February 2025, seasonally adjusted)
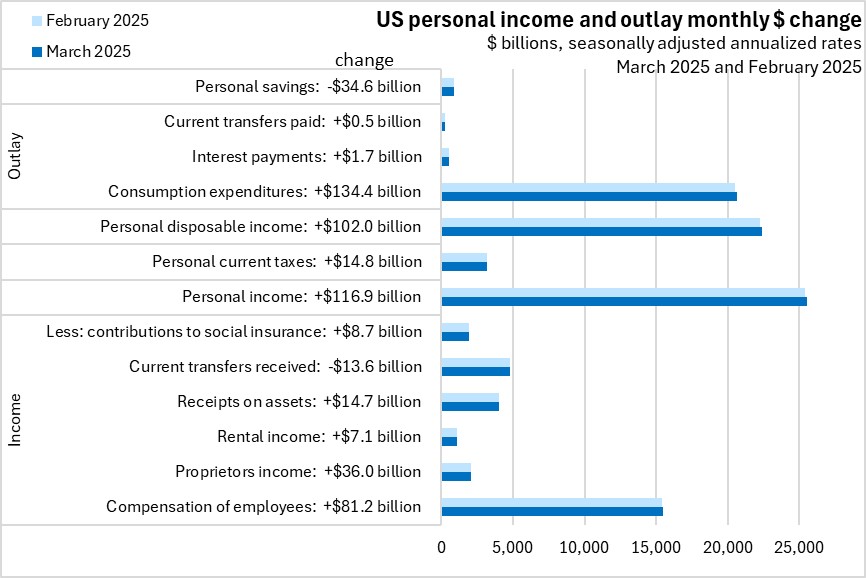
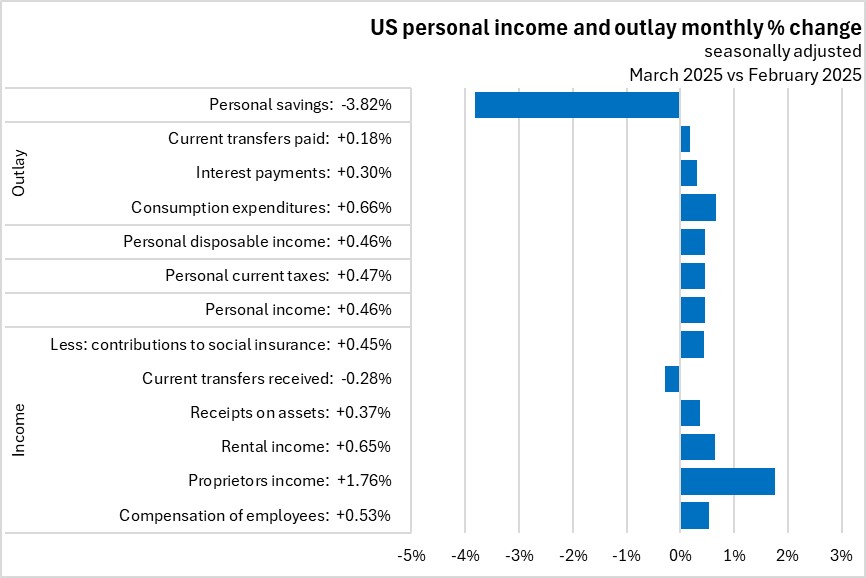
The US Bureau of Economic Analysis reported that US personal income increased by $116.9 billion (+0.46%). Employee compensation was up $81.2 billion (+0.53%). Personal disposable income was up $102.0 billion (+0.46%) while personal consumption expenditures (PCE) grew by $134.4 billion (+0.66%).
US personal savings decreased by $34.6 billion (-3.82%).
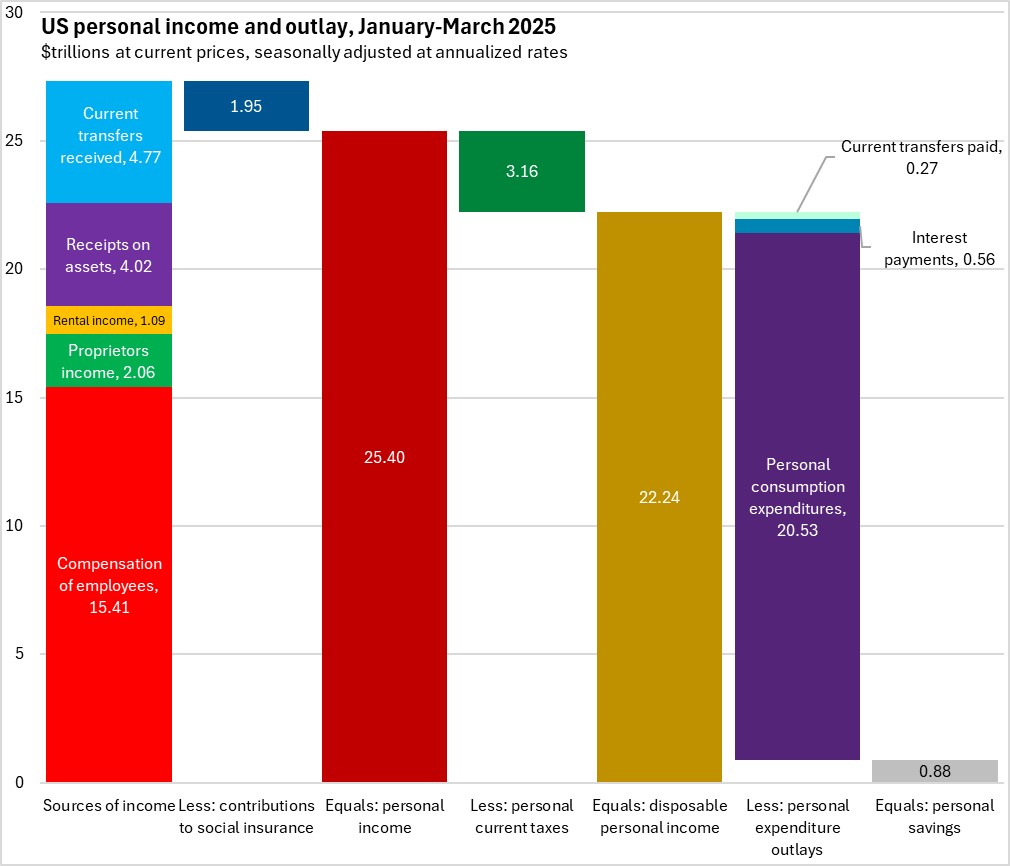
US personal income is calculated as the sum of employee compensation ($15.48 trillion), proprietors' income ($2.09 trillion), rental income ($1.10 trillion), receipts on assets ($4.03 trillion) and current transfers received ($4.79 trillion), less contributions to social insurance programs ($1.95 trillion). Personal income ($25.54 trillion) less personal current taxes ($3.18 trillion) equals disposable income ($22.36 trillion).
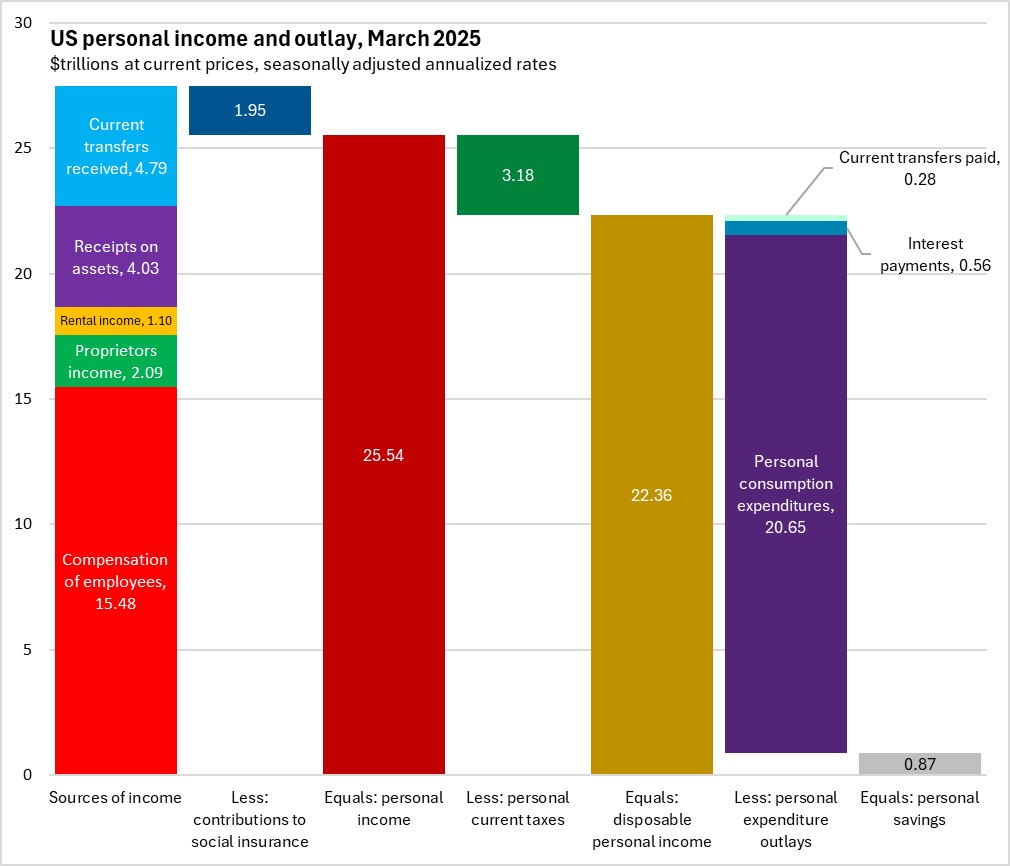
The outlay of US personal disposable income consists of personal consumption expenditures ($20.65 trillion), interest payments ($0.56 trillion) and current transfers paid ($0.28 trillion) with personal savings ($0.87 trillion) accounting for the remaining amount.
Trends
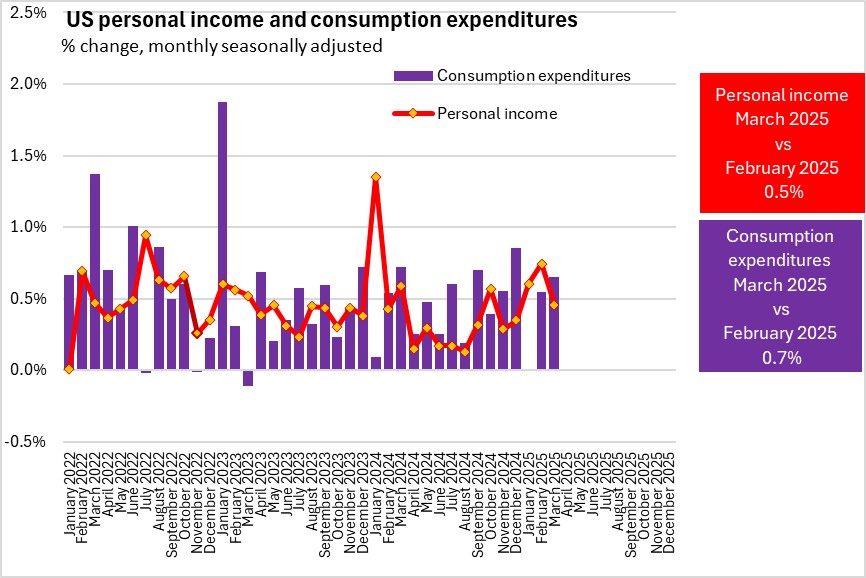
In the US, as personal income increases it is followed by an increase in personal consumption one or two months after. As personal income decreases, the reverse pattern occurs. US personal income has declined in March 2025, and we should expect a decline in personal consumption expenditures in one or two months. Spikes in personal consumption occur when the excess of personal income less personal consumption builds to a point where additional consumption may be justified.
Year over year (March 2025 vs March 2024, seasonally adjusted)
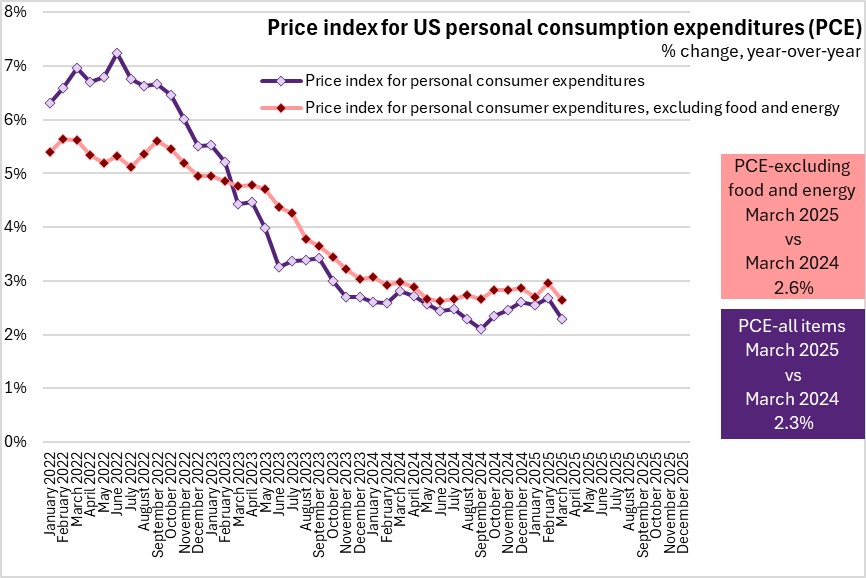
Growth in the price index for personal consumption expenditures (all items) was 2.3% year-over-year. Year-over-year growth in the price index for all items excluding food and energy was 2.6%, and outpaced all items PCE inflation for the 25th consecutive month.
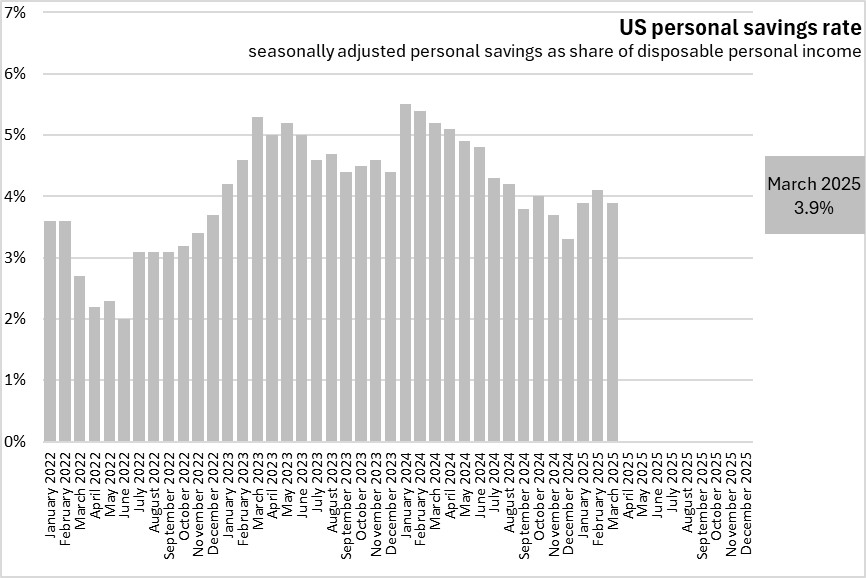
With growth in consumer spending lagging personal income, the US personal savings rate decreased to 3.9% of disposable personal income in March 2025.
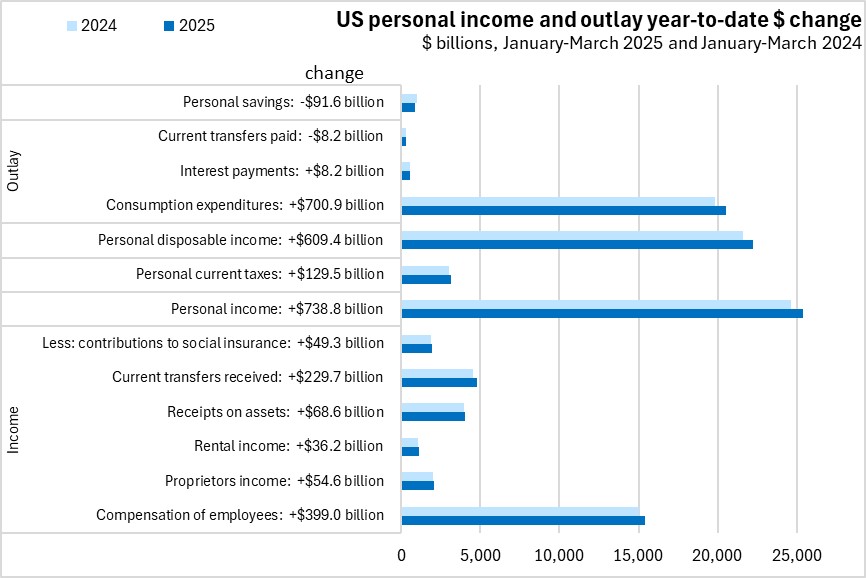
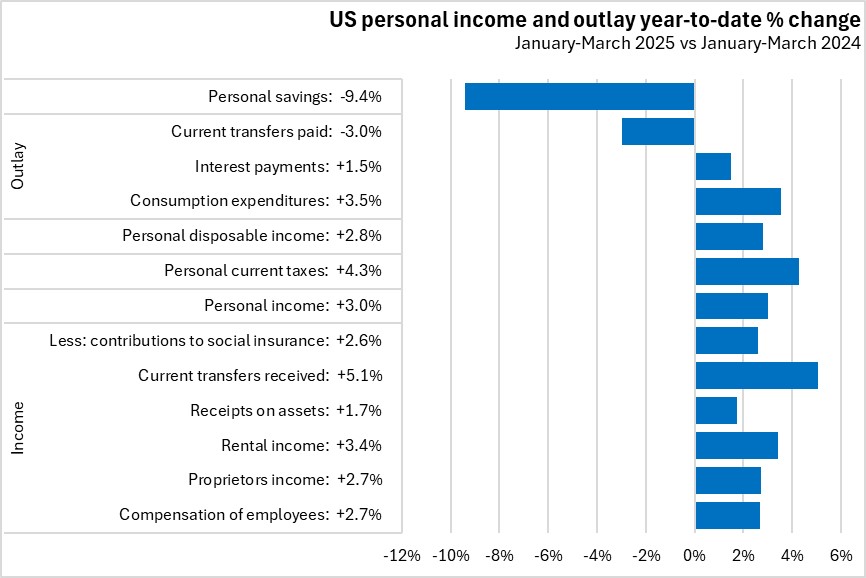
Year-to-date (January-March 2025 vs January-March 2024)
In the first three months 2025, US personal income increased by 3.0% from the same period in 2024. There were gains from all income sources led by growth in current transfers received (+5.1%). With an increase in personal current taxes (+4.3%), year-to-date growth in personal disposable income (+2.8%) is slower than growth in total personal income (+3.0%).
US interest payments increased by 1.5% from the first three months of 2024 to January-March 2025. This was outpaced by a 3.5% increase in personal consumption expenditures.
US Bureau of Economic Analysis. Press release, March 2025; Data retrieved Federal Bank of St Louis, Table 2.6. Personal Income and Its Disposition, Monthly NIPA
<--- Return to Archive