The Economics and Statistics Division maintains archives of previous publications for accountability purposes, but makes no updates to keep these documents current with the latest data revisions from Statistics Canada. As a result, information in older documents may not be accurate. Please exercise caution when referring to older documents. For the latest information and historical data, please contact the individual listed to the right.
<--- Return to Archive
For additional information relating to this article, please contact:
May 01, 2025CANADIAN INCOME SURVEY: FOOD SECURITY, 2023 Statistics Canada reports on food security and insecurity as part of the Canadian Income Survey. Food insecurity refers to households that have inadequate or insecure access to food due to financial constraints.
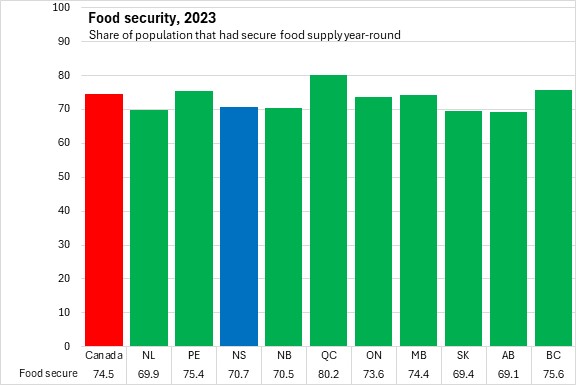
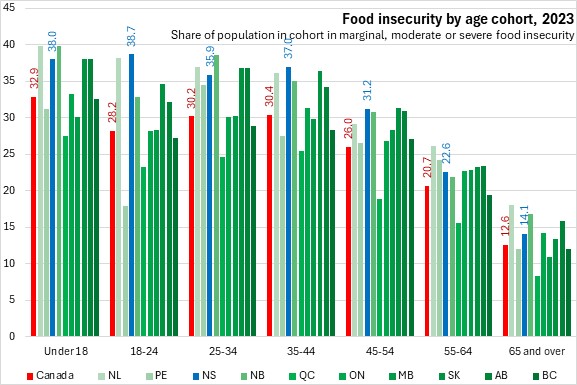
In Nova Scotia, 70.7% of the population was classified as 'food secure' in 2023. This was below the national average. Food security was highest in Québec and lowest in Alberta.
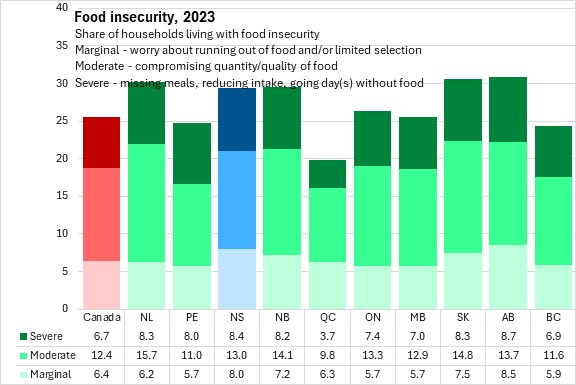
Food insecurity in Nova Scotia was 29.3%. Food insecurity is categorized as: marginal, moderate or severe. Nova Scotia's marginal, moderate and severe food insecurity in Nova Scotia were above the national average.
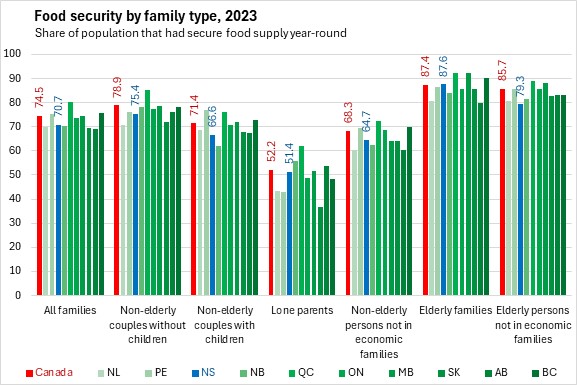
Food security was strongest for elderly persons (whether in economic families or not) as well as for non-elderly couples without children.
Food insecurity was highest for Nova Scotia's lone parent families (48.6%) as well as for non-elderly persons not in an economic family (35.3%) and couple families with children (33.4%).
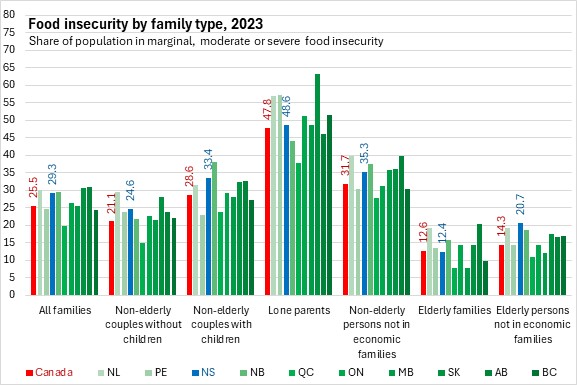
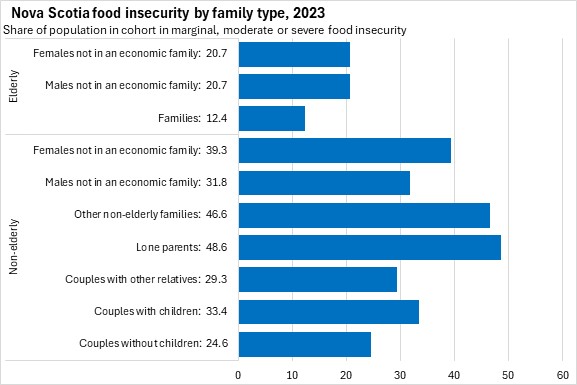
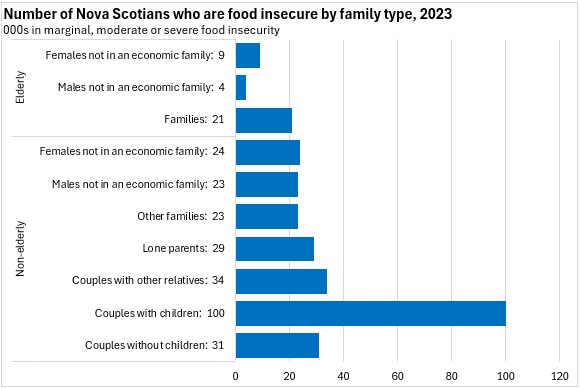
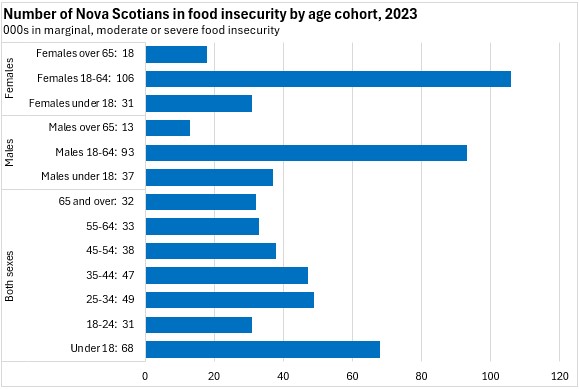
Although the portion of couple families with children that experience food insecurity was lower than for lone-parent families, this is a much larger cohort of the population and accounts for the largest cohort of persons living with food insecurity.
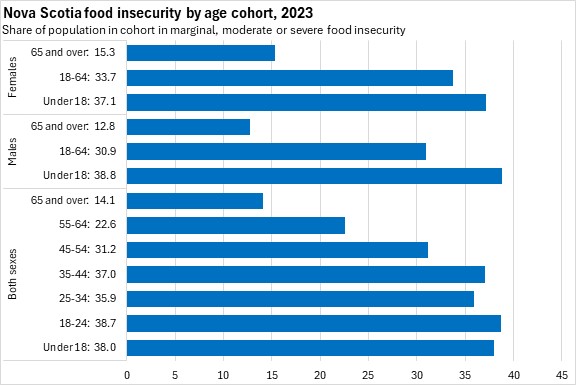
Food insecurity in Nova Scotia was highest for those aged 18-24 as well as for those under 18 years old. Food insecurity diminished with age.
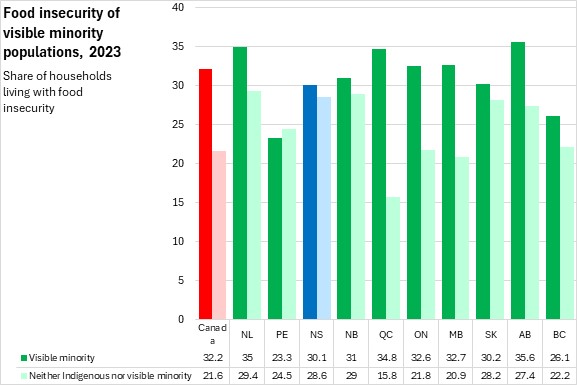
The gap in food insecurity between visible minority populations (30.1%) and those who identify neither as Indigenous nor a visible minority (28.6%) is smaller than the national gap. All provinces except Prince Edward Island reported food insecurity among visible minority populations as higher than the rate among the population that was neither Indigenous nor visible minority. Québec reported the largest gap in food insecurity between visible minority populations and those who identified neither as Indigenous nor a visible minority. Nova Scotia reported the smallest gap in food insecurity.
Sources: Statistics Canada, Canadian Income Survey. Table 13-10-0835-01 Food insecurity by selected demographic characteristics; Table 13-10-0834-01 Food insecurity by economic family type
<--- Return to Archive