The Economics and Statistics Division maintains archives of previous publications for accountability purposes, but makes no updates to keep these documents current with the latest data revisions from Statistics Canada. As a result, information in older documents may not be accurate. Please exercise caution when referring to older documents. For the latest information and historical data, please contact the individual listed to the right.
<--- Return to Archive
For additional information relating to this article, please contact:
May 21, 2025SURVEY OF HOUSEHOLD SPENDING, 2023 Statistics Canada has released the 2023 results of the Survey of Household Spending (no data were collected in 2022). This survey tracks average household spending by a number of categories of current consumption and other expenditures.
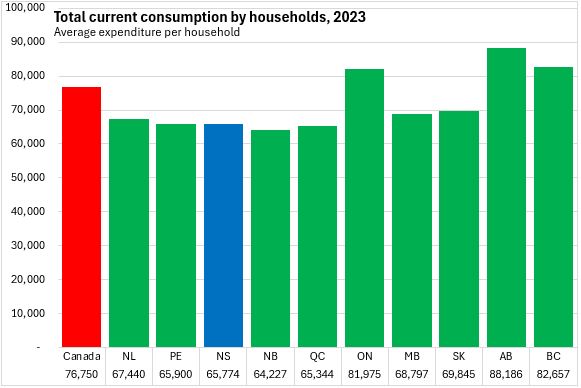
In 2023, Nova Scotian households made an average of $65,774 in expenditures for current consumption. This was 85.7% of the national average of $76,750. Average household current consumption in 2023 was highest in Alberta and lowest in New Brunswick.
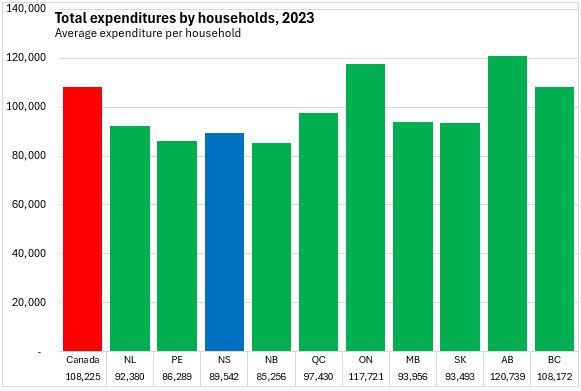
Including tax, insurance, pension, support payments and giving (which are not part of current consumption), Nova Scotia household expenditures averaged $89,542 in 2023 (82.7% of the national average). National household expenditures averaged $108,225 with the highest spending in Alberta and the lowest spending in New Brunswick.
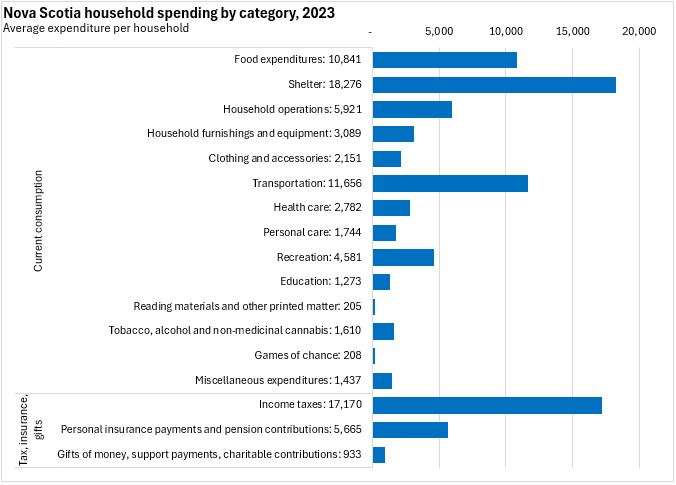
The largest expenditure items in Nova Scotia were shelter (including energy and insurance), income taxes, transportation and food purchased from stores.
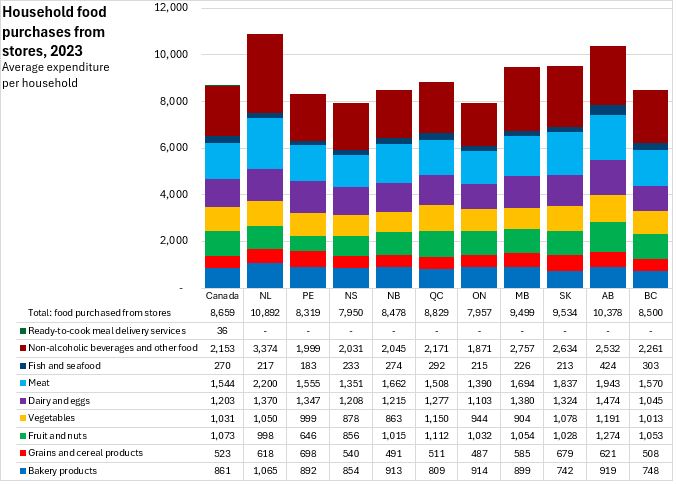
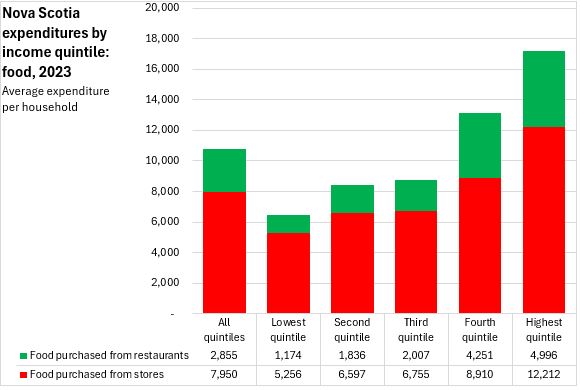
Compared with other provinces, Nova Scotia had the lowest average purchases of food from stores in 2023 at $7,950 per household, just behind Ontario. The largest specific components of food purchased from stores were meat and dairy/eggs, which was consistent across provinces.
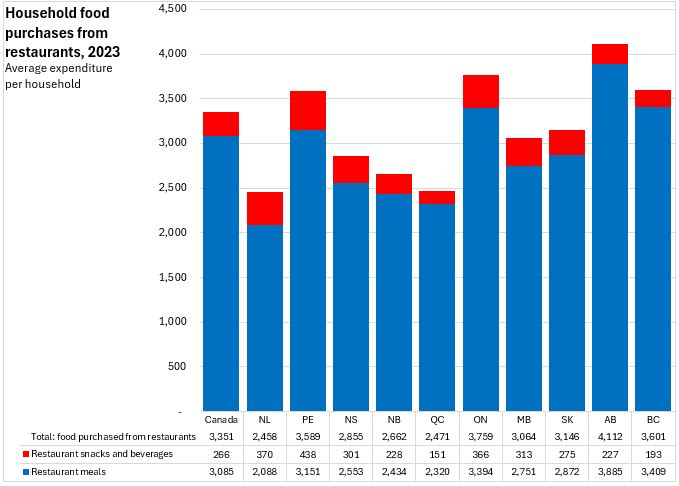
Nova Scotians purchased an average of $2,855 in food from restaurants in 2023, which was below the national average. The bulk of these purchases were for meals (as opposed to snacks and beverages).
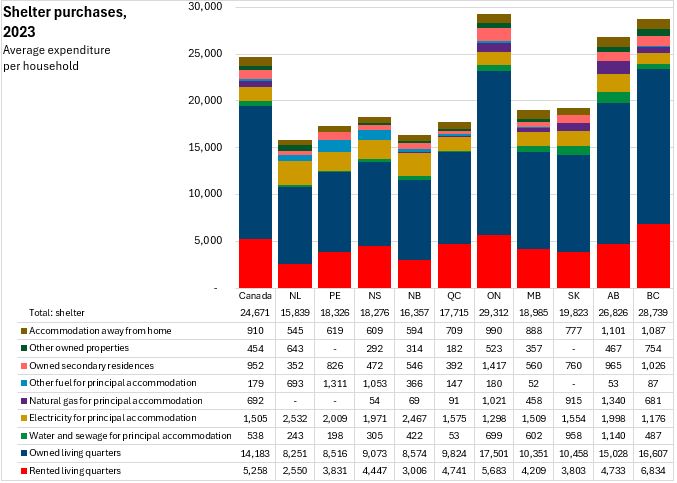
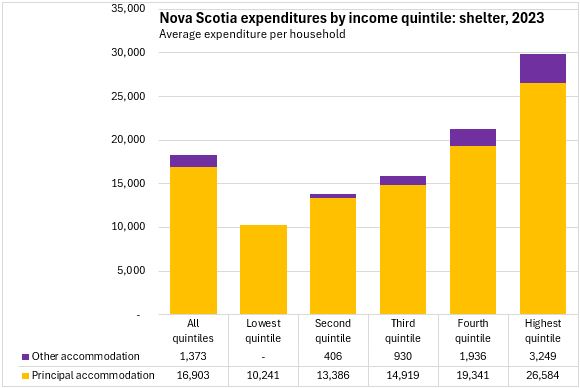
Shelter expenditures averaged $18,276 among Nova Scotia households in 2023. This was 74.1% of the national average. Owned and rented living quarters as well as electricity were the largest items in shelter expenditures.
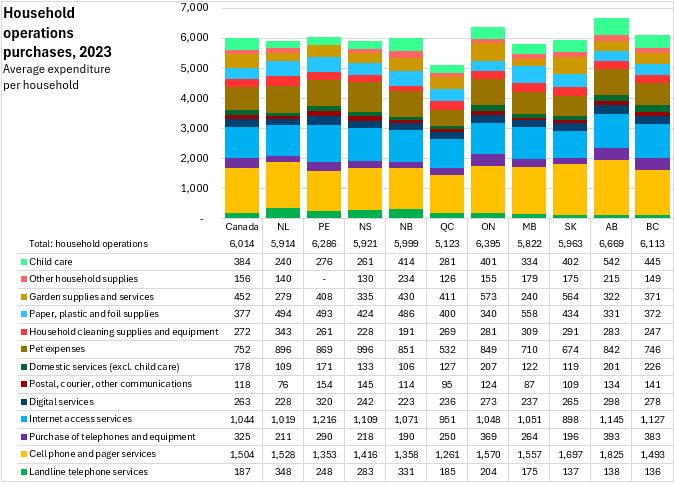
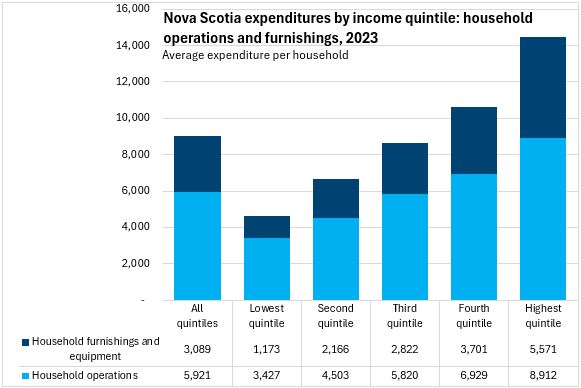
Household operation expenditures averaged $5,921 in Nova Scotia in 2023 - just below the national average ($6,014). The largest items in household operations expenditures were cell phone service, internet service, and pet expenses.
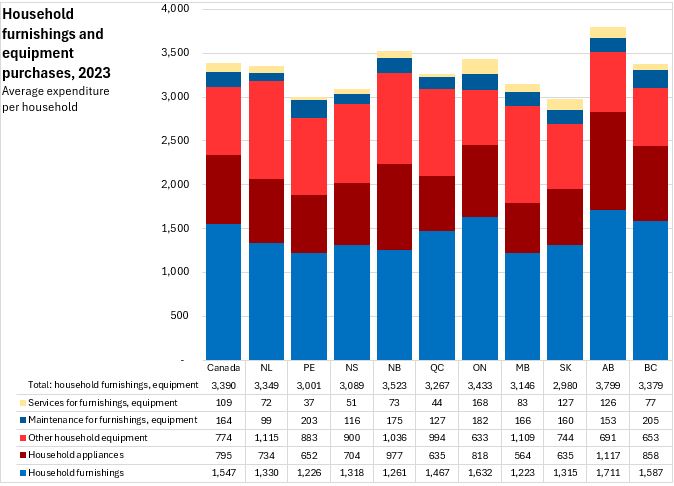
Household furnishing and equipment expenditures averaged $3,089 per household in Nova Scotia in 2023, below the national average. Only households in Prince Edward Island spent less than Nova Scotians on furnishings, appliances and household equipment/services. Expenditures on household furnishings, equipment and appliances were notably higher in Alberta.
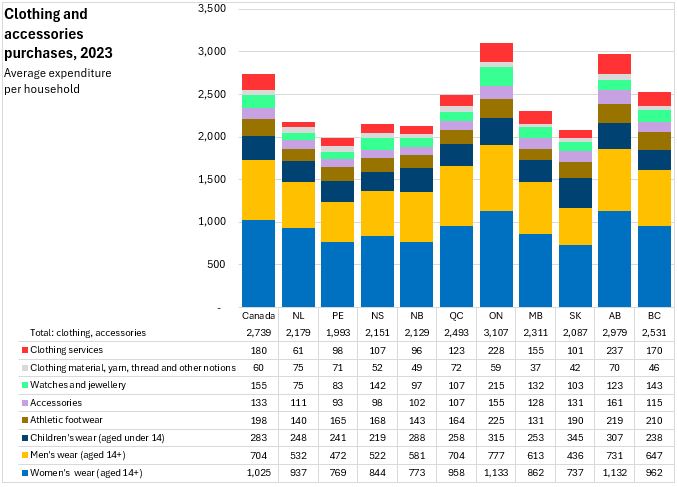
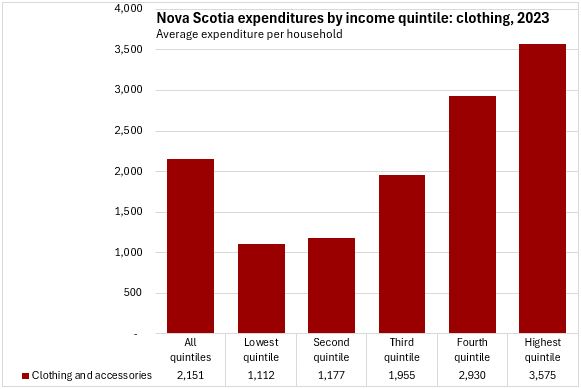
Nova Scotian households spent an average of $2,151 on clothing, footwear and accessories, well below the national average ($2,739). Clothing was the largest component of this expenditure. Ontario and Alberta reported notably higher expenditures on clothing, footwear and accessories in 2023.
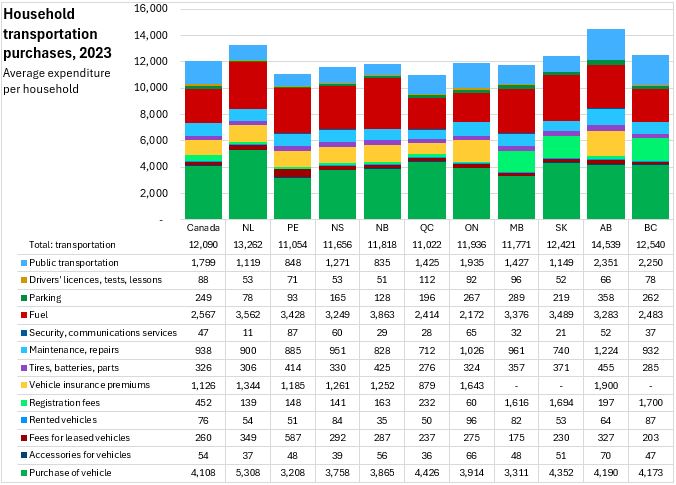
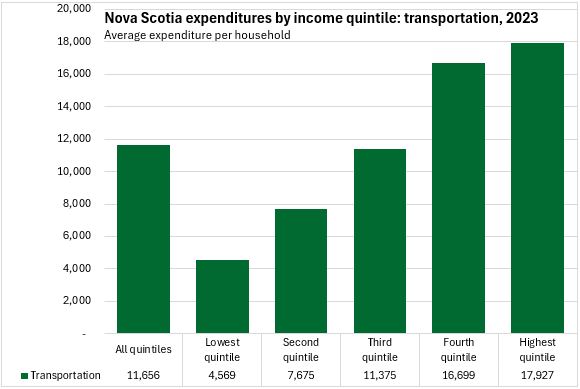
Nova Scotians' transportation expenditures averaged $11,656 per household in 2023, above only Prince Edward Island and Québec. This was below the national average of $12,090 in 2023.
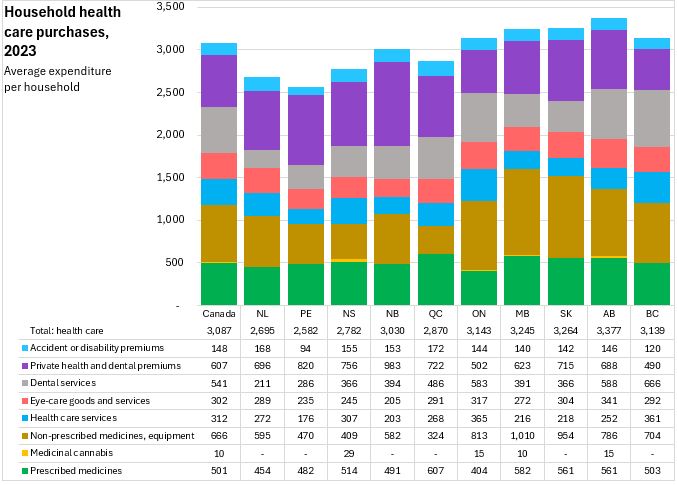
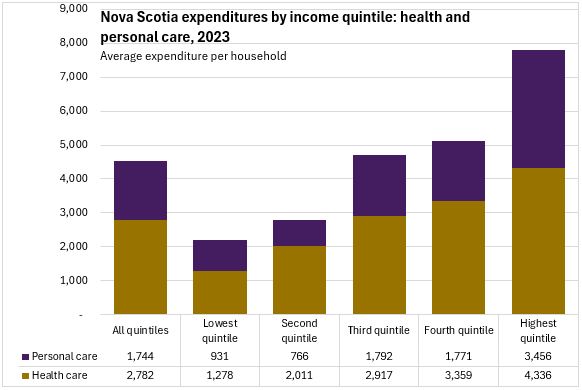
Nova Scotians' average household expenditures on health care were $2,782 in 2023, which was below the national average. Health insurance was the largest component of this expenditure, followed by prescription and non-prescription medicines, and dental services.
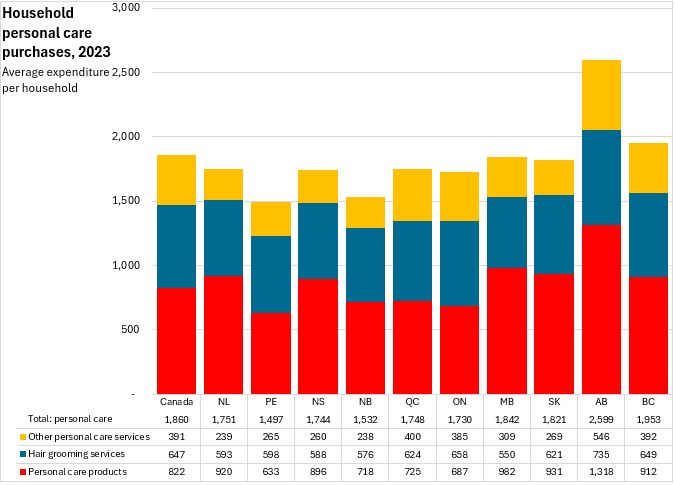
Personal care purchased averaged $1,744 per household in Nova Scotia in 2023, below the national average. The largest expenditure category was personal care products, followed by hair grooming services. Alberta reported the highest average household spending on personal care.
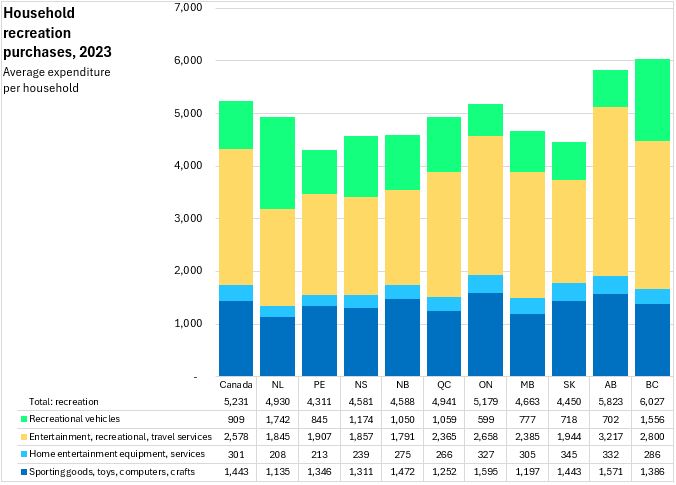
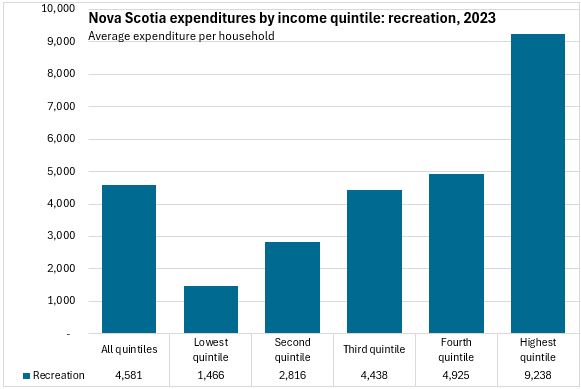
Average household expenditures on recreation were $4,581 in Nova Scotia. The largest items of recreational expenditure were for: entertainment, recreational and travel services, followed by sporting goods, toys, computers and crafts.
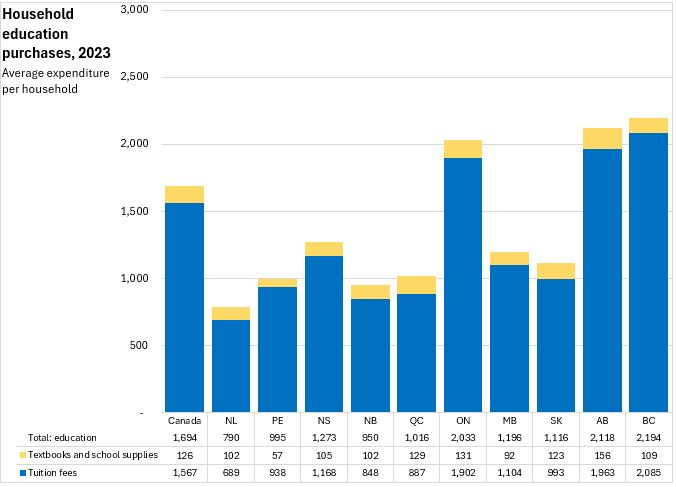
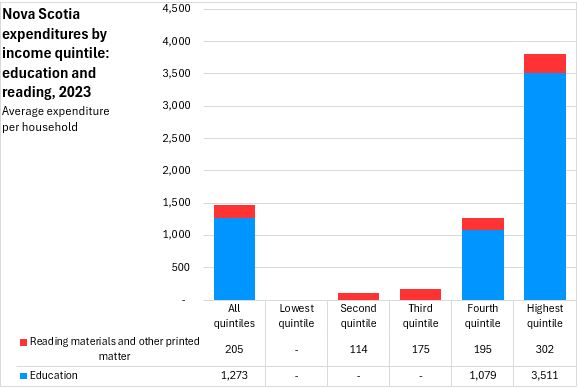
Nova Scotian households spent less ($1,273) than the national average on education but more than the other Atlantic provinces. The bulk of these expenditures were on tuition costs. Education expenditures, including tuition, were notably higher in Ontario, Alberta and British Columbia.
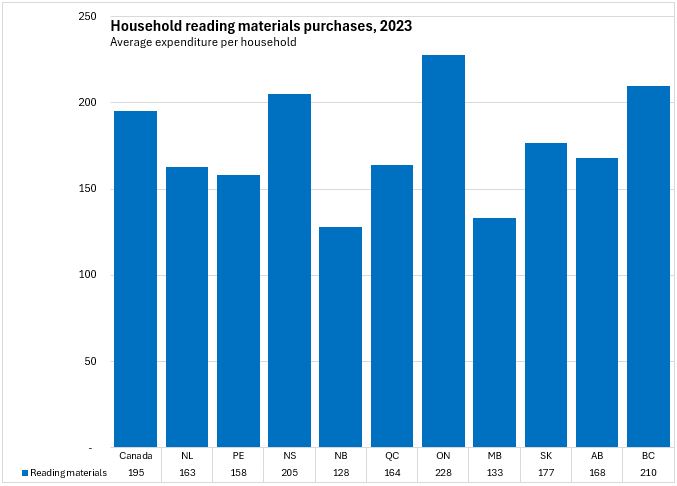
Nova Scotian households spent more on reading materials per household than the national average ($205 vs $195). This was also the highest among Atlantic provinces.
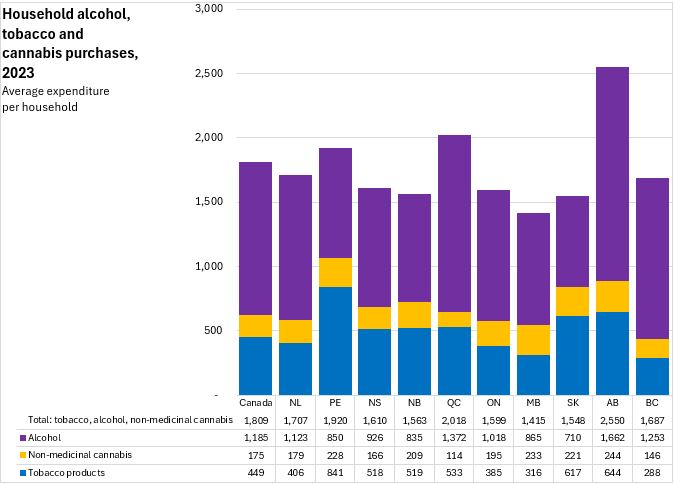
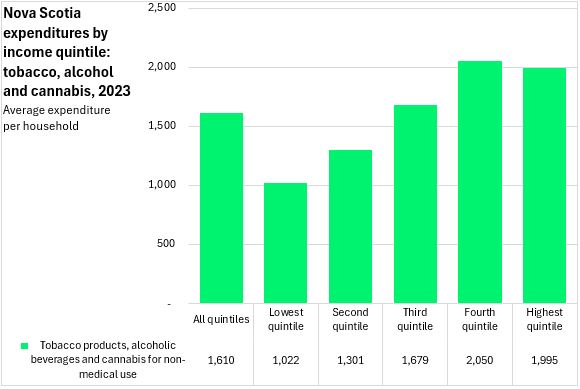
Average household expenditures on alcohol, tobacco, and non-medicinal cannabis were $1,610 in 2023, which was below the national average. Although Nova Scotians spent less than the national average on alcohol and non-medicinal cannabis, there were higher than average expenditures in Nova Scotia on tobacco products.
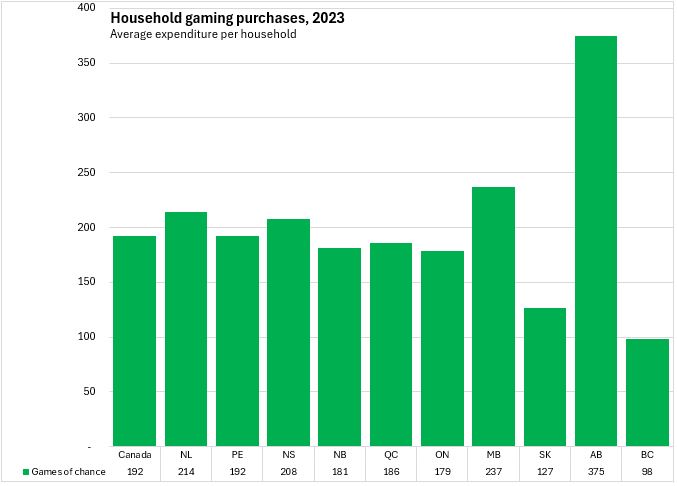
On average, Nova Scotian households spent more on games of chance in 2023 than the national average.
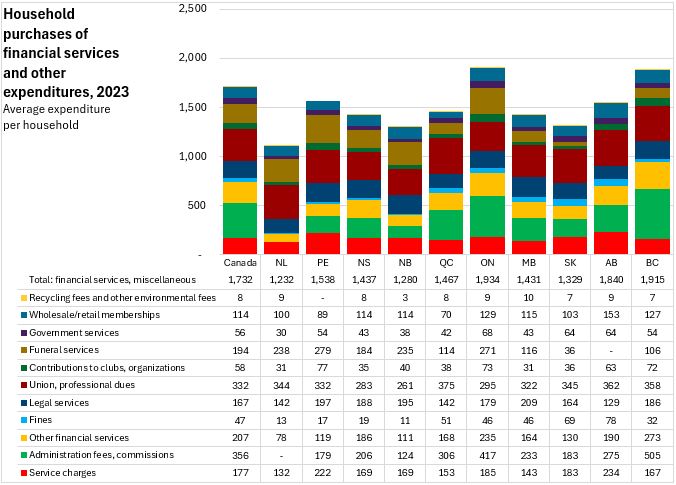
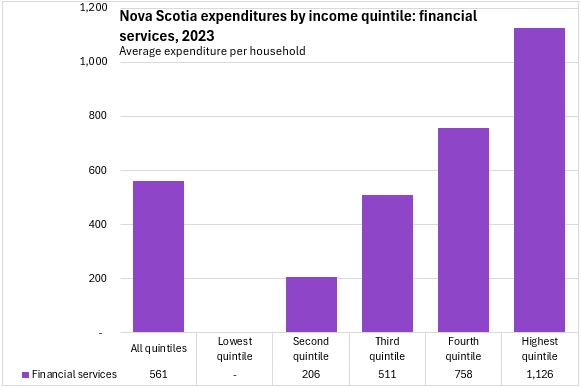
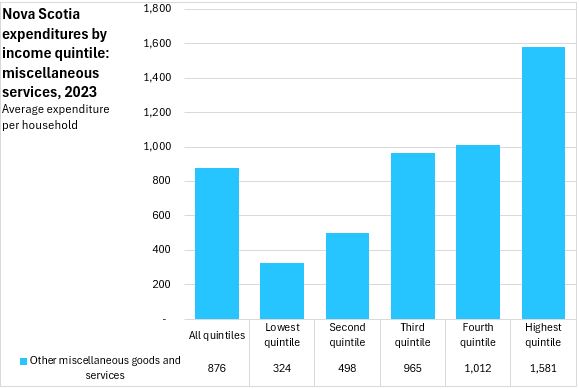
Among other expenditures, Nova Scotians spend less on average for financial services and other expenditures (totaling $1,437) compared to the national average in 2023.
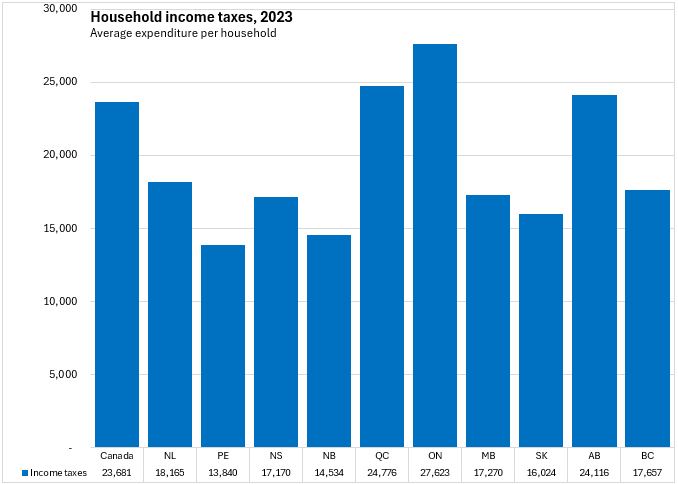
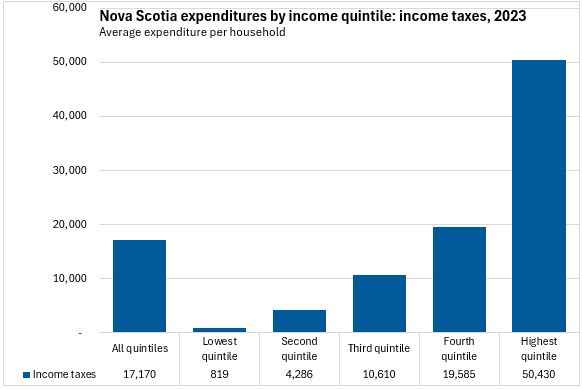
Nova Scotian households paid an average of $17,170 in income taxes in 2023. Income taxes paid were highest in Ontario, Québec and Alberta and the lowest in Prince Edward Island and New Brunswick.
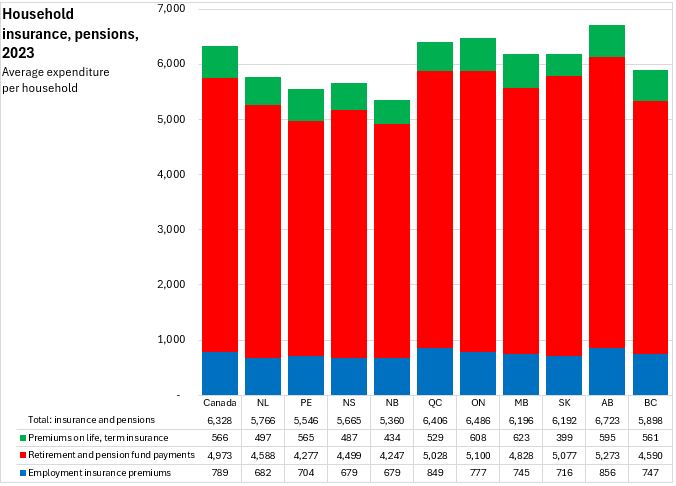
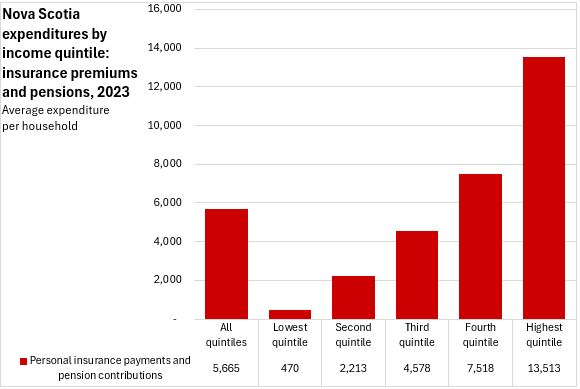
Nova Scotians' average household expenditures on insurance and pensions were $5,665 in 2023, which was below the national average. Retirement/pension savings were the largest expenditure category.
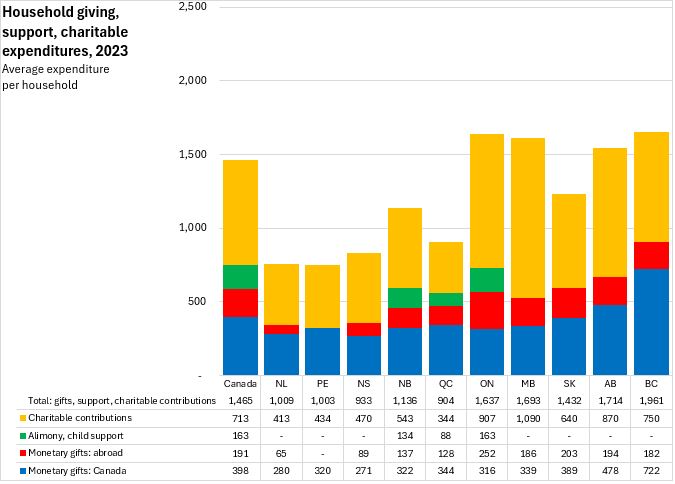
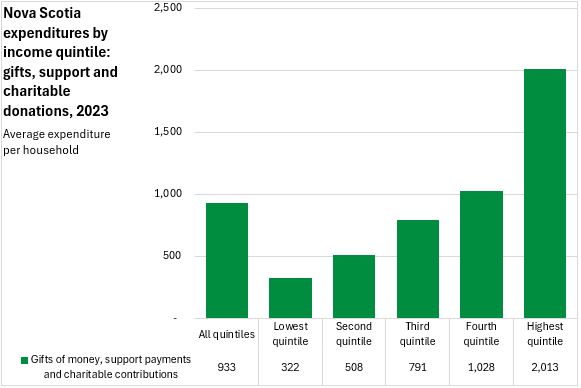
Average household expenditures on charitable contributions, monetary gifts and child support payments were lower in Nova Scotia compared to the national average. Note that average child support payment per household are suppressed in most provinces.
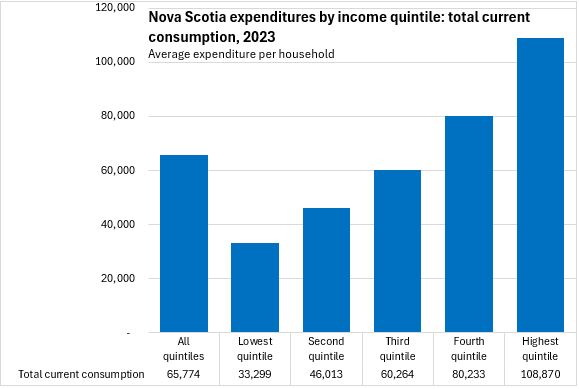
Household expenditures by income quintile
Statistics Canada also reports average household expenditure by income quintile. As income increases, consumption spending typically also increases. Households in the highest income quintile in Nova Scotia reported spending an average of $108,870 in current consumption compared to $33,299 in the lowest quintile.
This trend holds for all consumption categories as higher income allows for higher consumption spending. The gap between the lowest and highest quintiles is notable for expenditures on education, financial services, insurance and pensions, charitable gifts, and income taxes. The gap between the lowest and highest quintiles is smaller for food purchased from stores, health care, and tobacco, alcohol and cannabis.
Dwelling characteristics and equipment
In addition to expenditure information, the Survey of Household spending also collects information on Canadians' dwellings and the equipment and services they have.
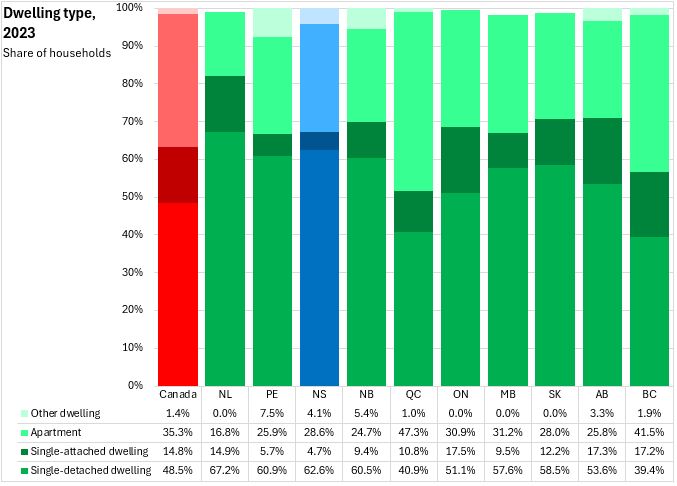
The 2023 Survey of Household Spending found that 62.6% of Nova Scotians lived in a single-detached dwelling while a further 28.6% lived in an apartment style dwelling.
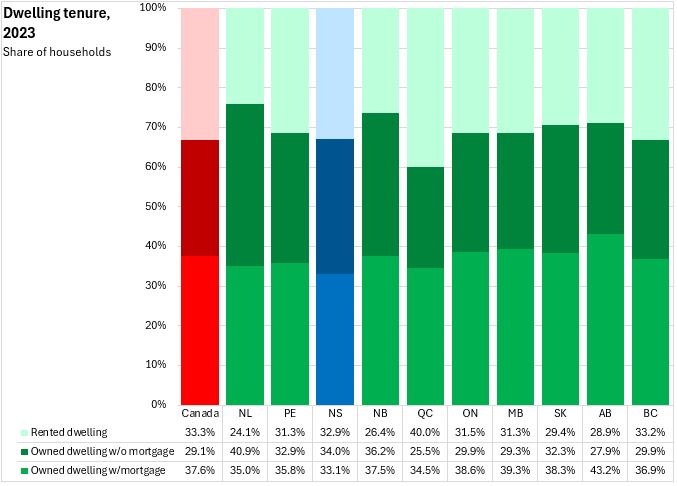
Just over 67% of Nova Scotian households owned their dwelling while 32.9% were renters in 2023. A slightly larger portion of Nova Scotia households (34.0%) were without mortgages on their owned dwelling than the share that owned their dwelling with a mortgage (33.1%).
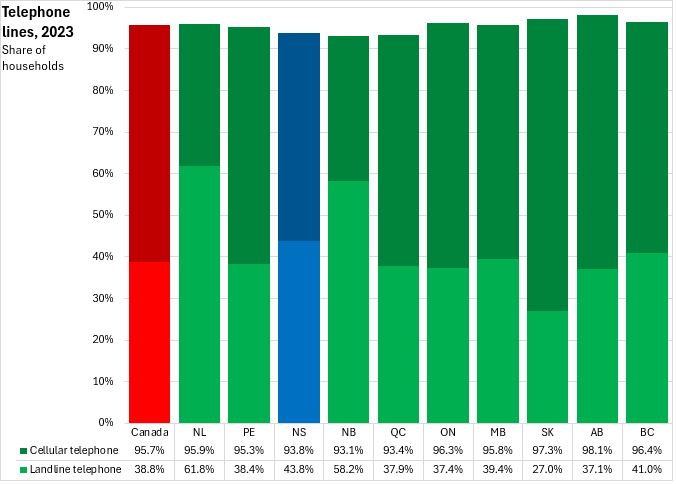
Landline telephone service was less common than households with a cellphone. Over 95% of households nationally had cellular phones while less than 40% of Canadian households had landline telephone service. In Nova Scotia, 43.8% of households had landlines (which were more prevalent in Atlantic Canada).
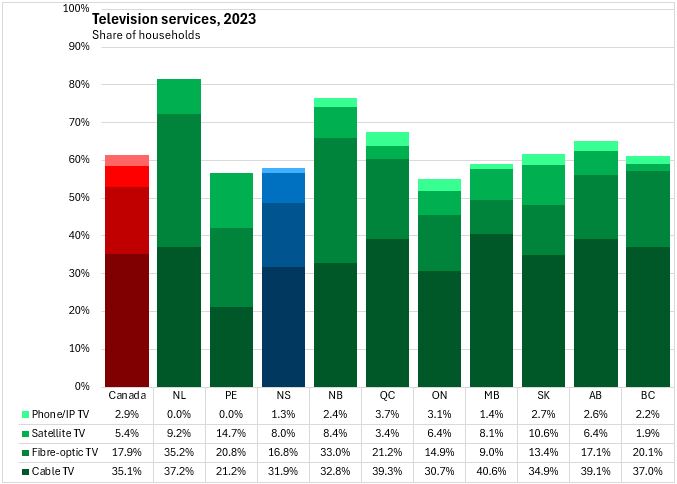
In 2023, 31.9% of Nova Scotia households had cable television. A further 16.8% received television service through fibre-optic, and 9.3% received television service through phone or satellite.
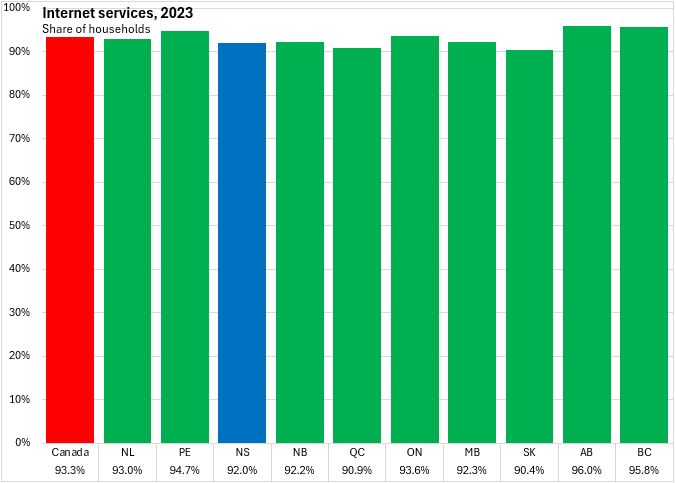
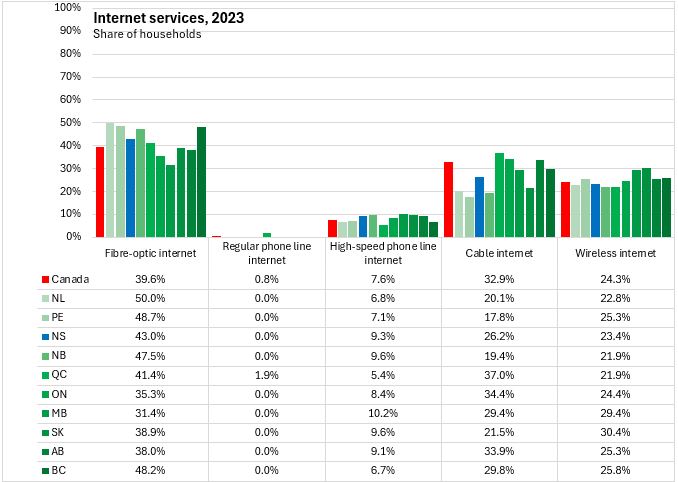
In 2023, 92.0% of Nova Scotia households had internet access. Fibre-optic service (43.0%), cable (26.2%) and wireless (23.4%) were the most common forms of internet access in Nova Scotia. Internet access was available at 93.3% of Canada's households.
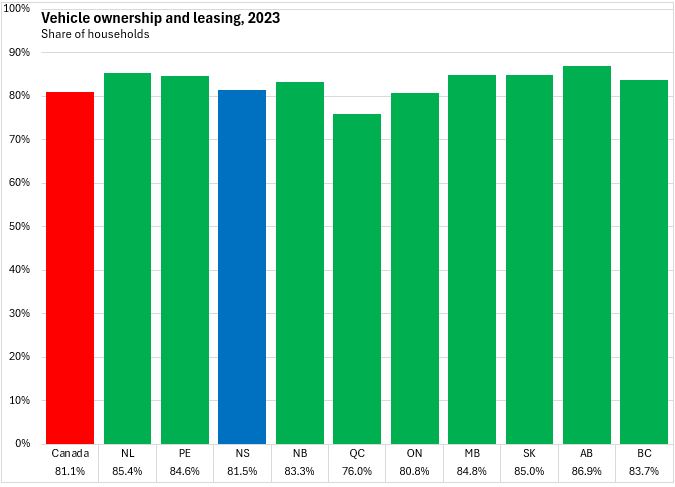
Across Canada, 81.1% of households owned, leased or otherwise operated a vehicle in 2023 including 75.9% who owned a vehicle. The share of Nova Scotia households with a vehicle was higher (81.5%), with 76.1% owning a vehicle. The share of Nova Scotia households that owned 2 or more vehicles was 35.9%, which was above the national average (34.3%).
Source: Statistics Canada. Table 11-10-0222-01 Household spending, Canada, regions and provinces; Table 11-10-0223-01 Household spending by household income quintile, Canada, regions and provinces; Table 11-10-0228-01 Dwelling characteristics and household equipment at time of interview, Canada, regions and provinces
<--- Return to Archive