The Economics and Statistics Division maintains archives of previous publications for accountability purposes, but makes no updates to keep these documents current with the latest data revisions from Statistics Canada. As a result, information in older documents may not be accurate. Please exercise caution when referring to older documents. For the latest information and historical data, please contact the individual listed to the right.
<--- Return to Archive
For additional information relating to this article, please contact:
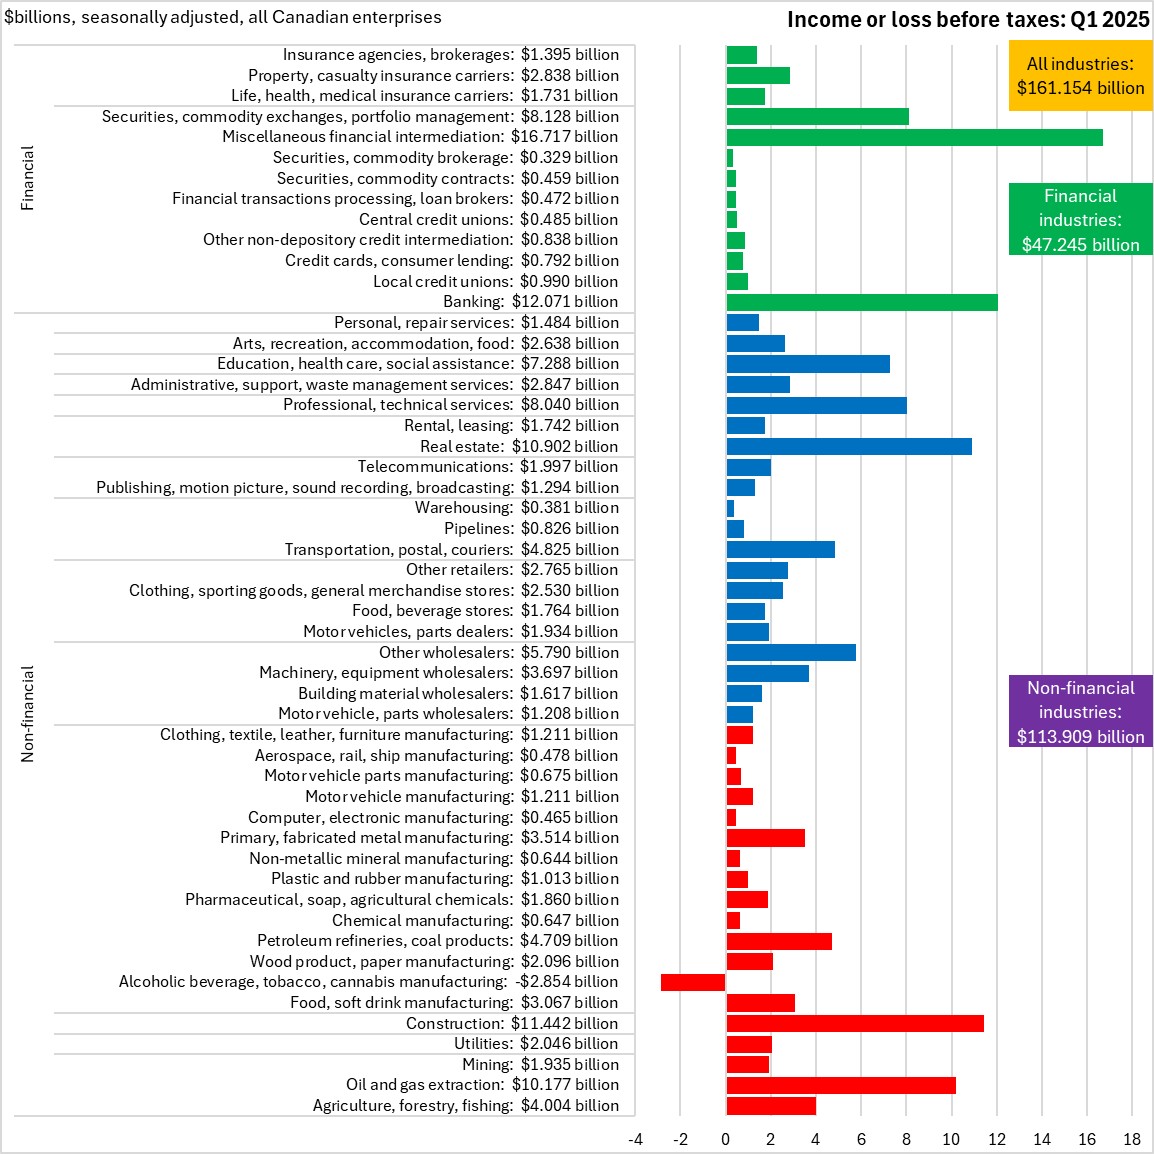
May 23, 2025CANADA FINANCIAL STATISTICS FOR ENTERPRISES, Q1 2025 In Q1 2025, Canadian enterprise net income before taxes (seasonally adjusted) was $161.154 billion. All broad industry categories reported positive income before taxes in Q1 2025 except for alcohol/tobacco/cannabis product manufacturing (-$2.854 billion), which had extraordinary one-time charges due to legal settlements. The largest values of net income before taxes were reported in miscellaneous financial intermediation ($16.717 billion), banking ($12.071 billion), construction ($11.442 billion), real estate ($10.902 billion), and oil/gas extraction ($10.177 billion).
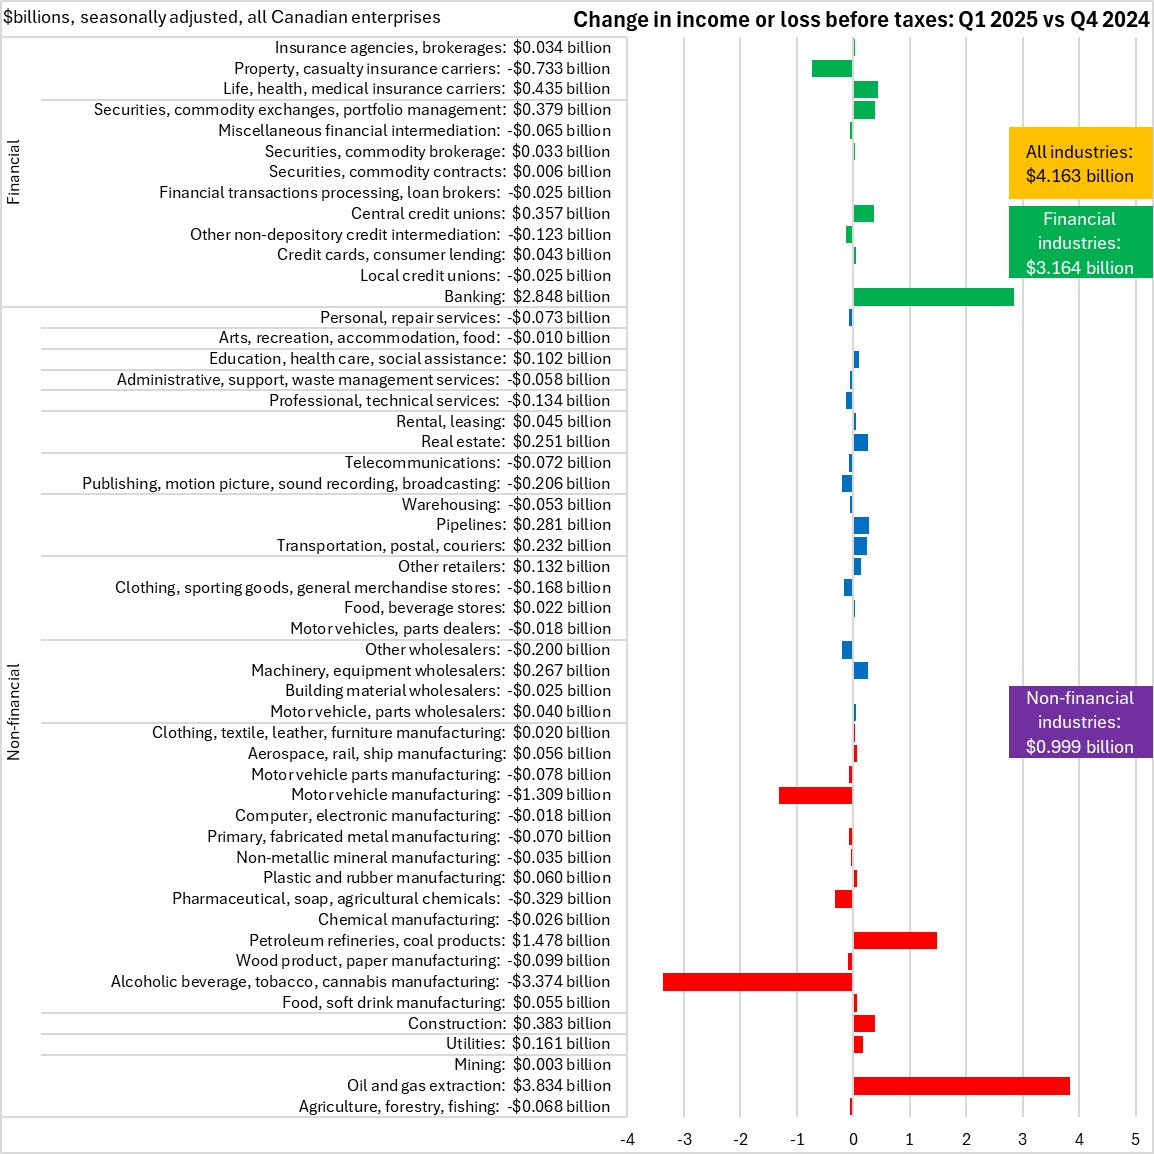
Compared with Q4 2024, net income before taxes rose by $4.136 billion across all industries. Net income increased by $3.164 billion for financial/insurance industries largely on gains in banking life/medical/health insurance carriers, securities/commodities exchanges/portfolio management and central credit unions. Property/casualty insurance carriers reported the largest drop in net income before taxes among financial industries.
Net income for non-financial industries rose by $0.999 billion. Oil/gas extraction, petroleum refining and construction reported the largest gains in net income before taxes. Statistics Canada notes that oil/gas extraction and petroleum refinish incomes benefited from rising oil prices in January. Alcohol/tobacco/cannabis product manufacturers reported the largest decline - shifting to a net loss before taxes due to one-time expenses associated with legal settlements.
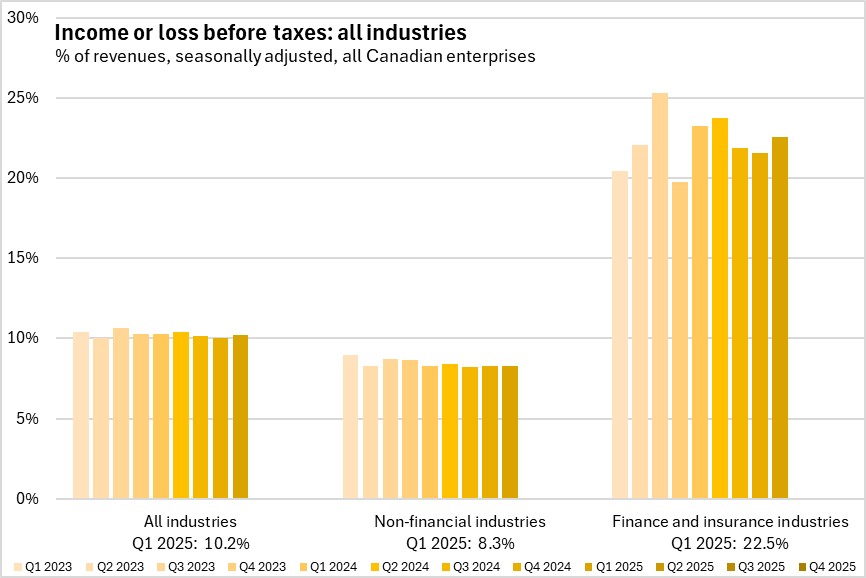
Measured as a share of revenue, income before taxes averaged 10.2% across all industries; 22.5% for financial industries and 8.3% for non-financial industries. Income as a share of revenues was little changed for non-financial industries and up for financial industries.
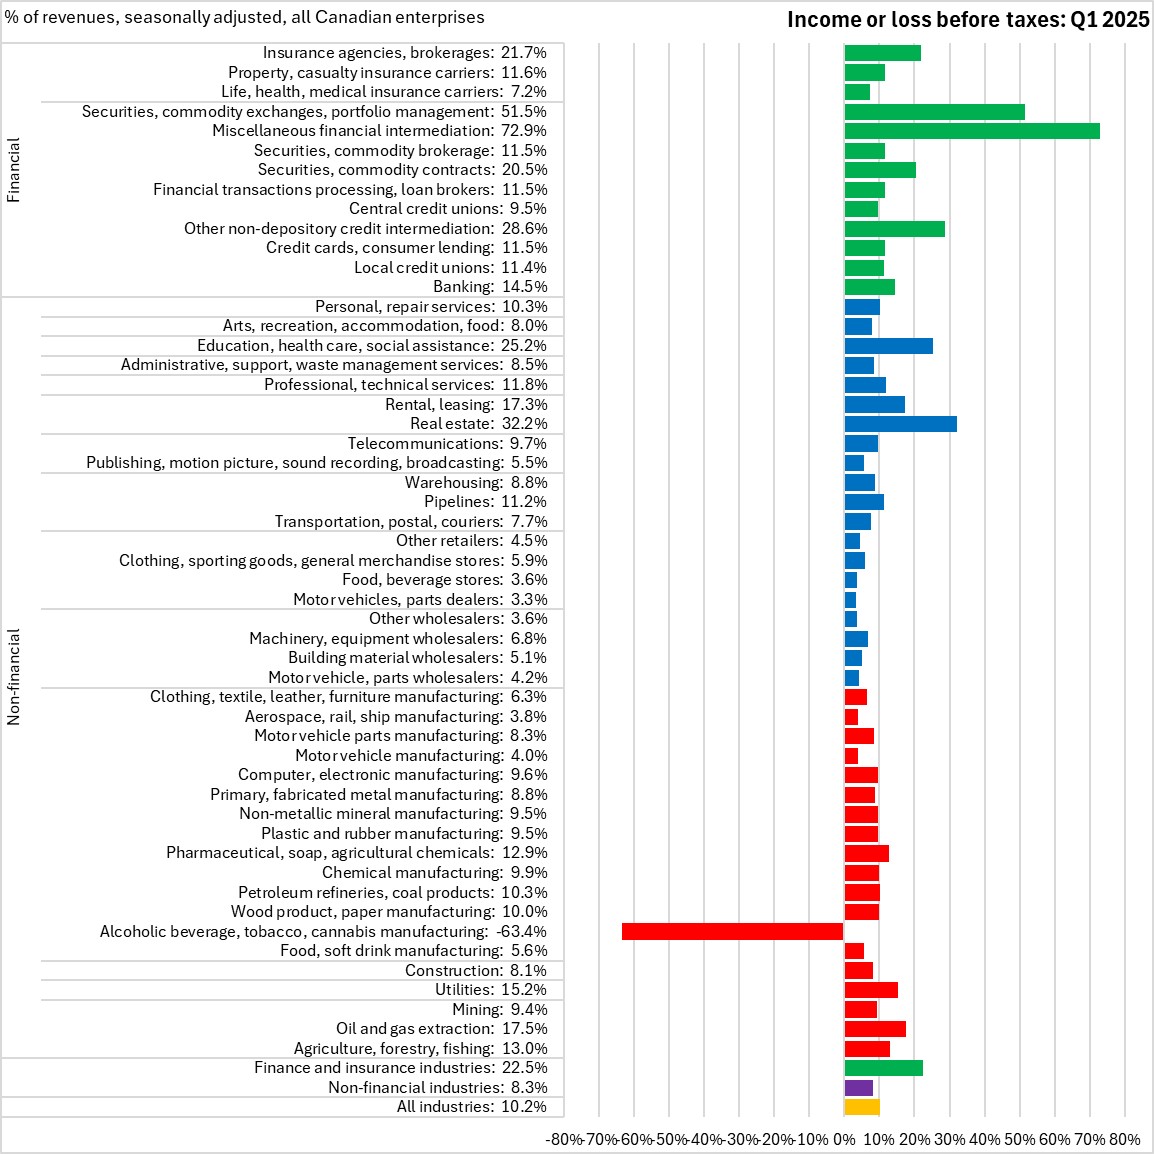
Measured as a share of revenue, income before taxes was highest in miscellaneous financial intermediation (72.9% of revenues), followed by securities/exchanges/portfolio management (51.5%) and other non-depository credit intermediation (28.6%). Outside of financial industries, income before taxes as a share of revenue was highest in: real estate (32.2%), education/health/social assistance (25.2%, including daycares), oil/gas extraction (17.5%) and rentals/leasing (17.3%). Alcohol/tobacco/cannabis manufacturing's net loss amounted to 63.4% of revenues.
Source: Statistics Canada. Table 33-10-0226-01 Quarterly balance sheet and income statement, by industry, seasonally adjusted (x 1,000,000)
<--- Return to Archive