The Economics and Statistics Division maintains archives of previous publications for accountability purposes, but makes no updates to keep these documents current with the latest data revisions from Statistics Canada. As a result, information in older documents may not be accurate. Please exercise caution when referring to older documents. For the latest information and historical data, please contact the individual listed to the right.
<--- Return to Archive
For additional information relating to this article, please contact:
June 17, 2025CONSUMER PRICE INDEX 2025 BASKET UPDATE BACKGROUND
Statistics Canada has released their regular update for Consumer Price Index (CPI) basket weights and composition, available here. The updated basket weights will be used with the release of May 2025 CPI on June 24, 2025.
CPI basket quantities are fixed to the reference period of the basket weights which are used to estimate consumer expenditures for the upper-level aggregation. Larger weights represent a large share of expenditures on the category. Price changes for products with larger weights will have a larger impact on headline CPI.
2024 WEIGHTS
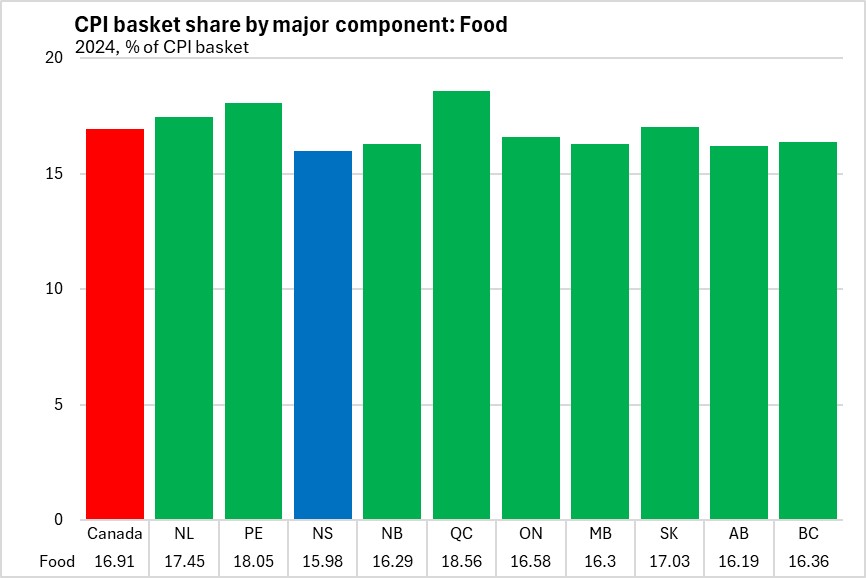
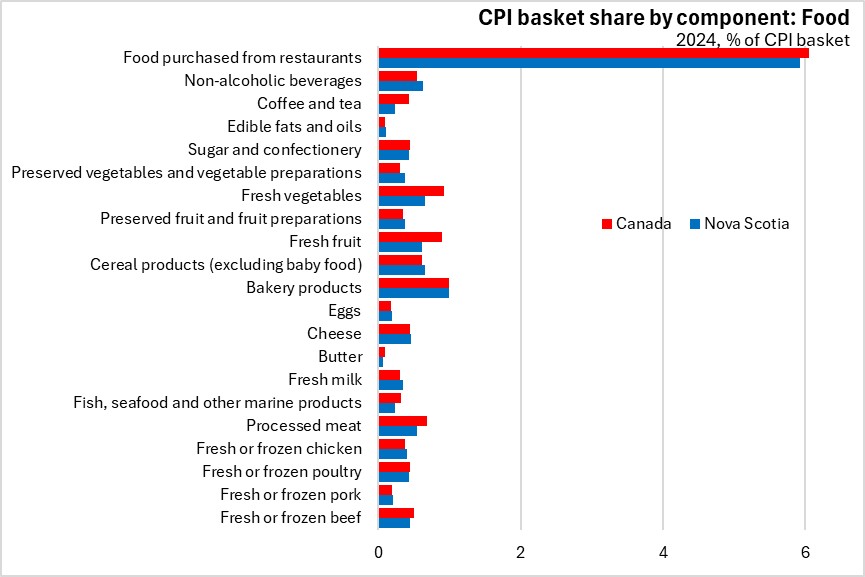
Among the eight major components of the CPI basket, Nova Scotia had the lowest basket share for food at 15.98%. Nationally the share was 16.91% with the highest share in Québec.
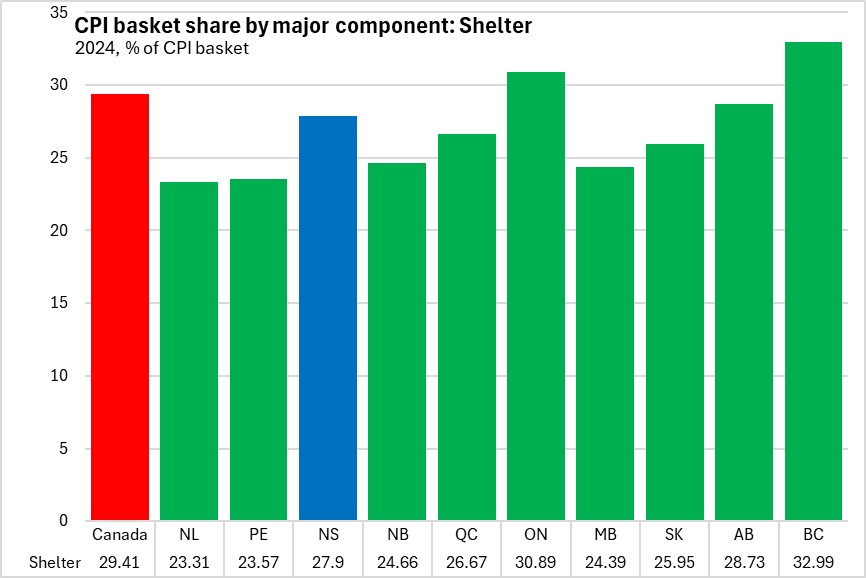
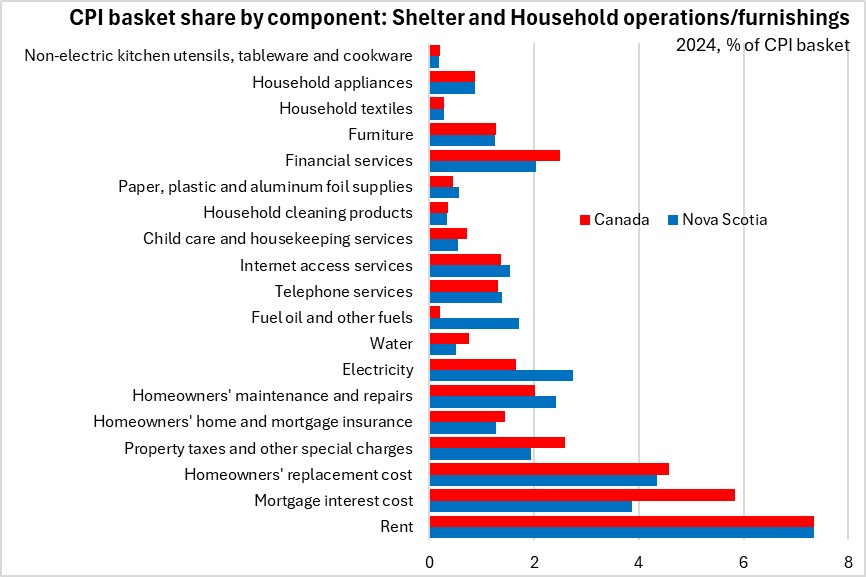
Shelter represented the largest share of the CPI basket across the country. Nova Scotia's CPI basket share for shelter was 27.9%, lower than the national average. British Columbia and Ontario had notably higher shares of shelter expenditures. The lowest basket share for shelter was in Newfoundland and Labrador.
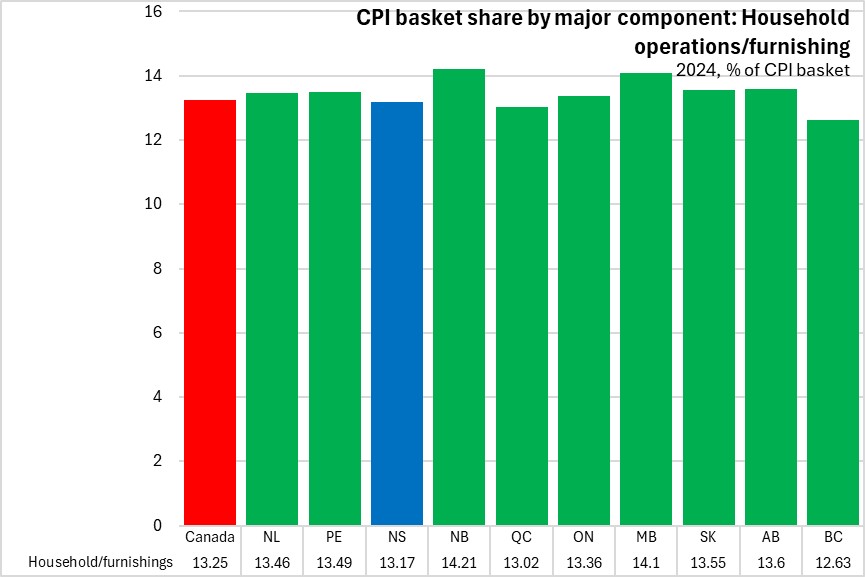
Nova Scotia's CPI basket share for household operations and furnishings was 13.17%, below the national average of 13.25%. New Brunswick had the highest share of expenditures in this component of CPI.
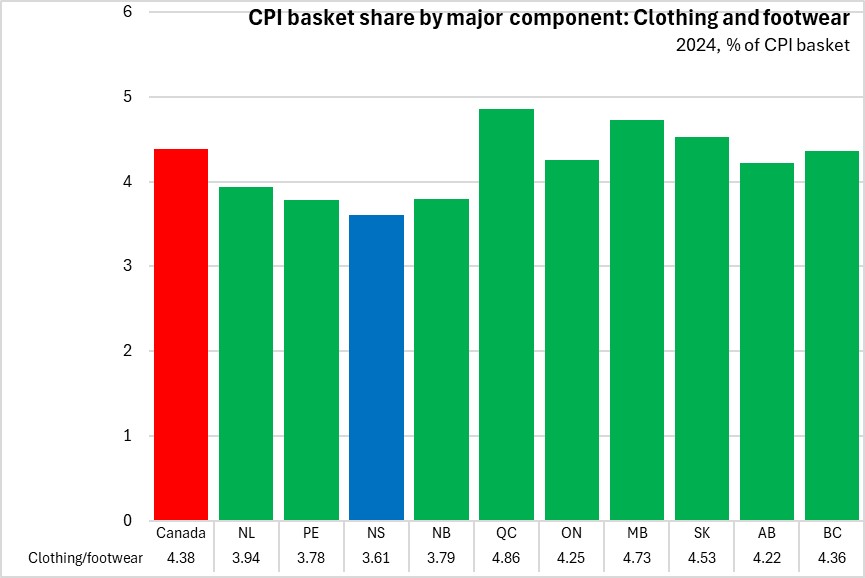
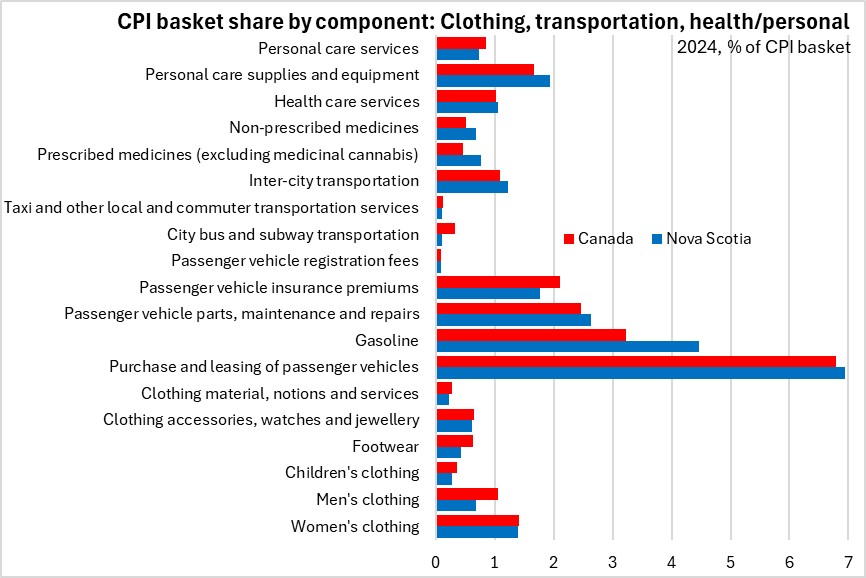
Nova Scotia's CPI basket share for clothing and footwear was 3.61%, lowest among provinces. Québec had the highest basket share in 2024.
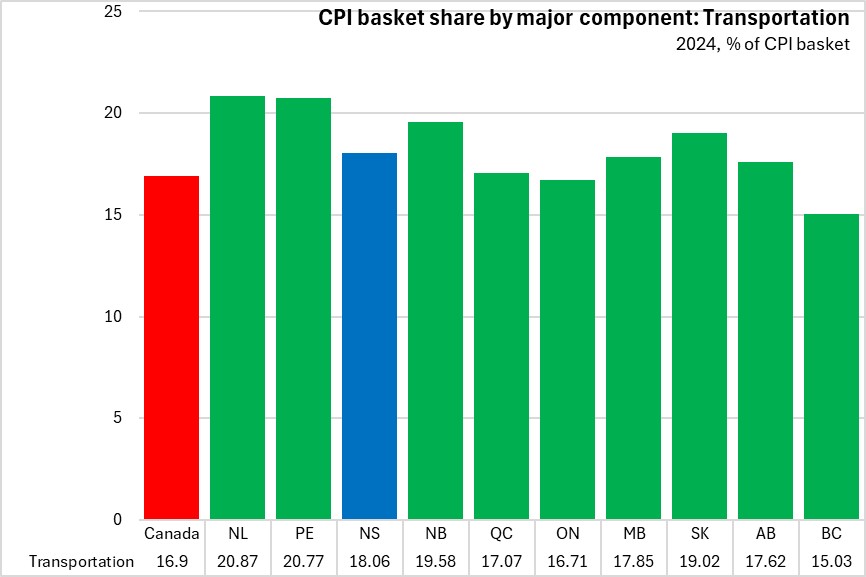
Transportation reflects 18.06% of expenditures in the CPI basket in Nova Scotia, higher than the national average of 16.9% in 2024. The lowest basket share for transportation was in British Columbia and the highest was in Newfoundland and Labrador.
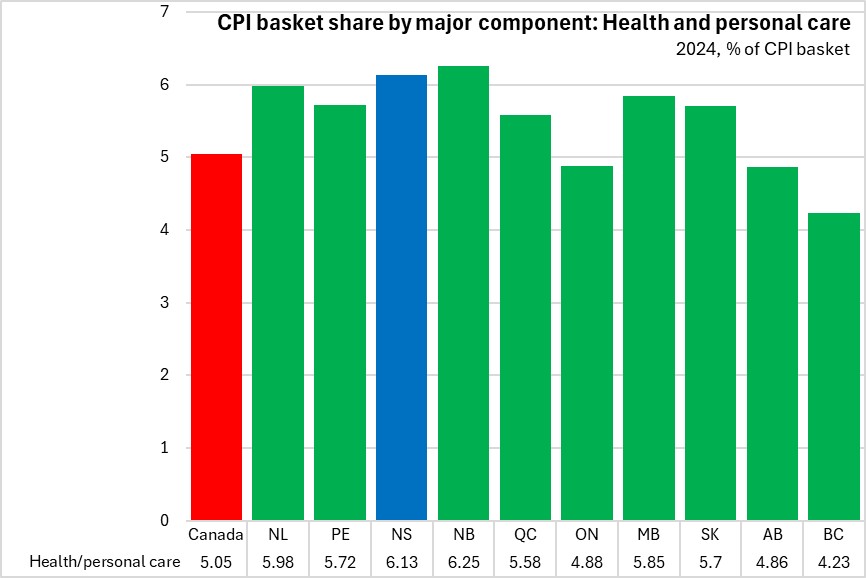
Nova Scotia's basket share for health and personal care was the second highest among provinces at 6.13% in 2024 (after New Brunswick). The national average for this component was at 5.05%. British Columbia reported the lowest basket share for this component in 2024.
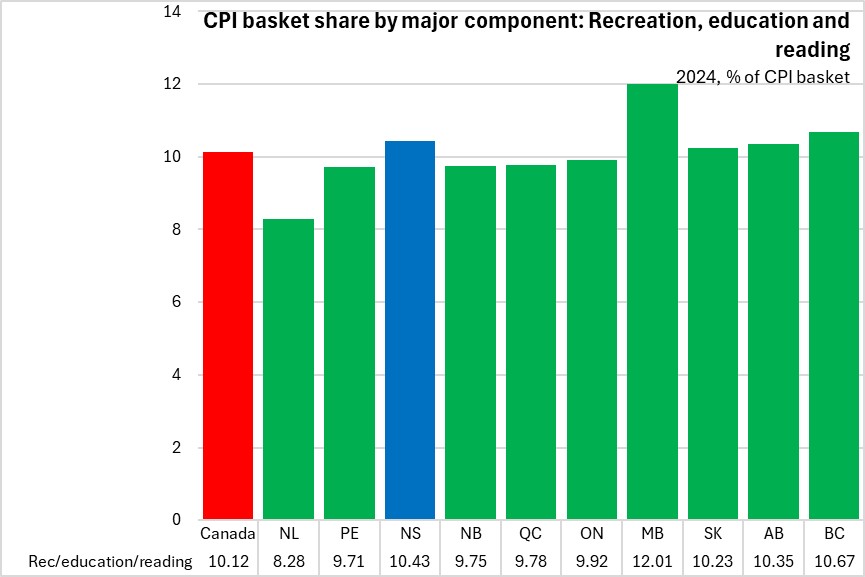
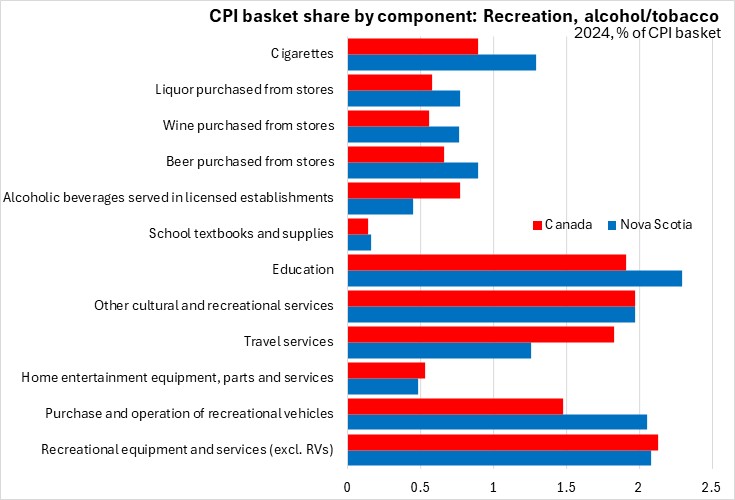
Nova Scotia had the third highest basket share for recreation, education and reading among provinces (10.43%) after British Columbia and Manitoba. Newfoundland and Labrador had the lowest expenditure share for this component in their 2024 CPI basket.
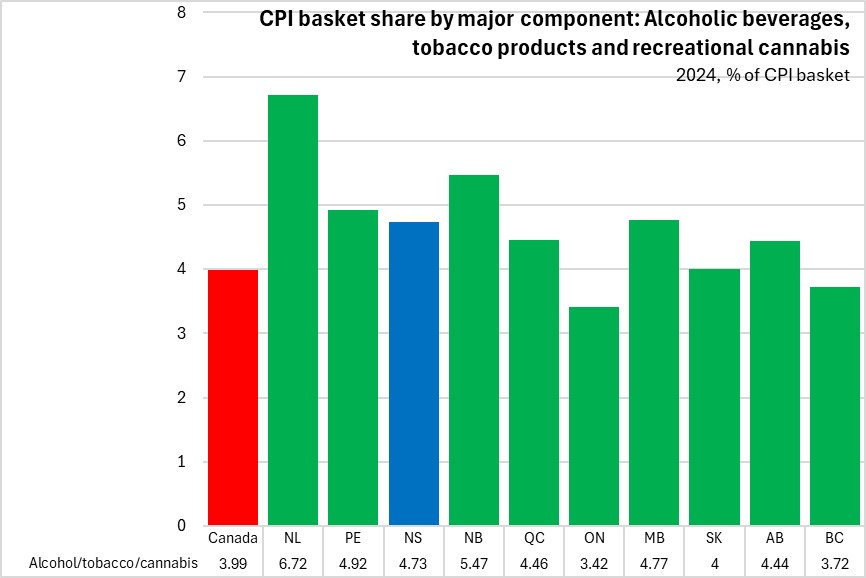
Alcoholic beverages, tobacco products and recreational cannabis typically represent the smallest share of the CPI basket in a given province (exception: Newfoundland and Labrador, second lowest to health/personal). In 2024, 4.73% of the CPI basket in Nova Scotia was for expenditures in this component, higher than the national average of 3.99%. Ontario had the lowest basket share in this component among provinces.
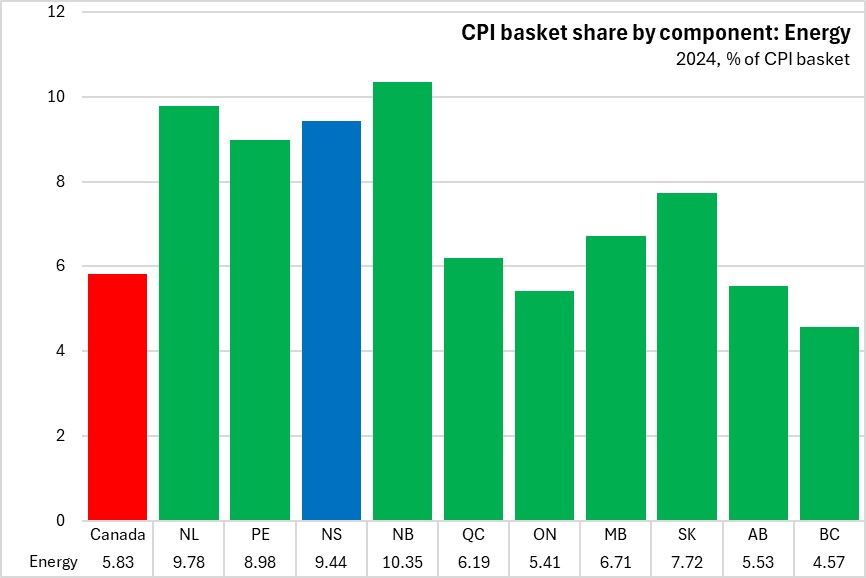
The Atlantic provinces have higher basket shares for energy products than other provinces. In 2024, 9.44% of the CPI basket in Nova Scotia was for energy expenditures. Nationally, this was 5.83% in 2023.
Nova Scotia had smaller basket shares for food purchased from stores and for food purchased from restaurants compared to the national average.
Basket shares for the shelter component of CPI were lower in Nova Scotia compared to the national average (exceptions: rent, maintenance/repairs, fuel/oil and electricity). Fuel oil and other fuels basket share was notably higher in Nova Scotia compared to the national average.
Household operations had lower basket shares in Nova Scotia for most components compared to the national average except for telephone services, internet access services, paper/plastic/aluminum supplies, and appliances.
Clothing and footwear reflected a lower basket share in Nova Scotia compared to Canada.
Transportation had higher basket shares for purchase and leasing of passenger vehicles, gasoline, parts/maintenance and repairs and inter-city transportation.
Health and personal care basket shares were higher in Nova Scotia for all sub-components except personal care services.
Among recreation, education and reading, Nova Scotia's CPI basket shares were above national average for purchase and operation of recreation vehicles, reading and education.
Alcohol purchased from stores and cigarettes made up larger shares of the Nova Scotia CPI basket for 2024 compared to the national average.
For 2024, the expenditure weights are derived from Household Final Consumption Expenditures, the Survey of Household Spending and alternative sources to account for shifts in spending. Updating the basket is needed as expenditure patterns shift in response to prices, income levels, demographics, habits and new technology/products.
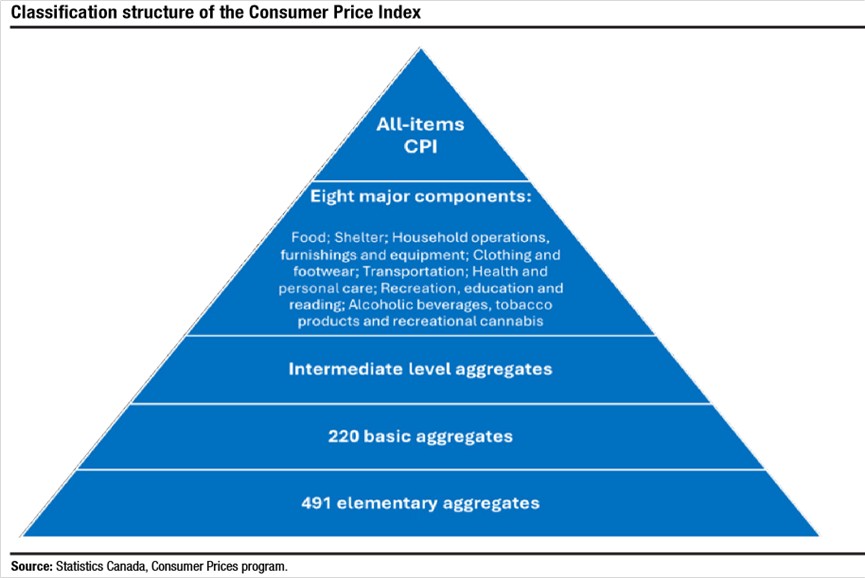
Each good or service in the basket is assigned a basket share proportional to consumption expenditure for which they account. The CPI classification of goods and services is organized according to a top-down hierarchical structure from the eight major components, 220 basic aggregates and 491 elementary aggregates, most of which are unpublished. These elementary aggregates are added or deleted as consumption pattern changes. At the elementary aggregate level, the classification includes sample of items that characterize all products in the class. Representative products are chosen for items that are widely available and known to be among the most popular with consumers.
Changes for the 2025 update include adding some elementary aggregates into basic aggregates and changing expenditure weights. The new methodology relies on depreciation estimates of total residential stocks, housing stock in units occupied by the usual owner resident to the total housing stocks and using depreciation rates of 2% for new construction and 4% for renovations.
Sources:
Statistics Canada. An Analysis of the 2025 Consumer Price Index Basket Update, Based on 2024 Expenditures
Statistics Canada. Table 18-10-0007-01 Basket weights of the Consumer Price Index, Canada, provinces, Whitehorse, Yellowknife and Iqaluit
<--- Return to Archive