The Economics and Statistics Division maintains archives of previous publications for accountability purposes, but makes no updates to keep these documents current with the latest data revisions from Statistics Canada. As a result, information in older documents may not be accurate. Please exercise caution when referring to older documents. For the latest information and historical data, please contact the individual listed to the right.
<--- Return to Archive
For additional information relating to this article, please contact:
June 24, 2025HOUSING ECONOMIC ACCOUNTS, 2024 Statistics Canada has released housing economic accounts (HEA) for 2024, which provides a macroeconomic perspective on housing assets that represent the physical structures and supported services in residential real estate. The HEA includes investment and net capital stock by industry and type of housing.
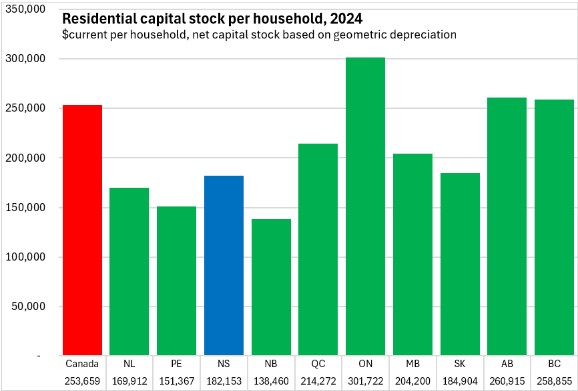
Nova Scotia's residential capital stock amounted to $182,153 per household in 2024 (measured in current dollars). This was 71.8% of the national average residential capital stock per household of $253,659. Ontario had the highest residential capital stock per household while New Brunswick had the lowest.
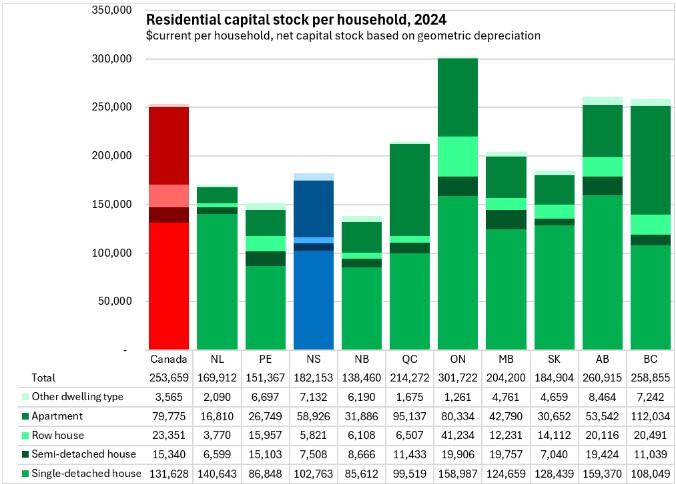
Single dwelling units made up the bulk of residential capital stock per household in every jurisdiction. Apartments were a larger portion of capital stock for Québec and British Columbia (followed by Nova Scotia and Ontario).
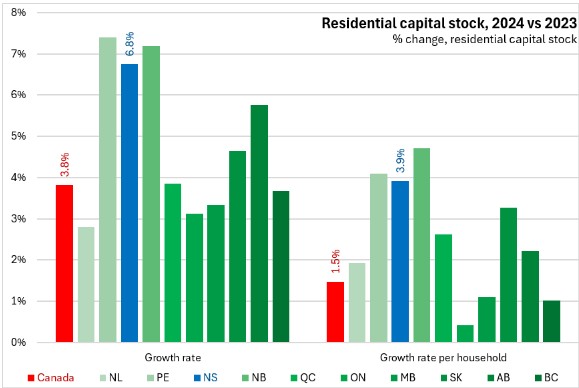
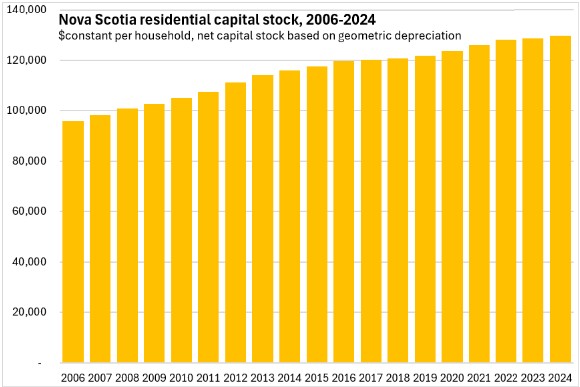
In 2024, Nova Scotia's residential capital stock grew by 6.8% (in current dollars). On a per-household basis, Nova Scotia's residential capital stock was up by 3.9%.
Canada's residential capital stock grew by 3.8% (+1.5% per household) with the fastest growth in the Maritime provinces. Newfoundland and Labrador had the slowest overall growth in residential capital stock, though Ontario's per household residential capital stock growth was the slowest among provinces.
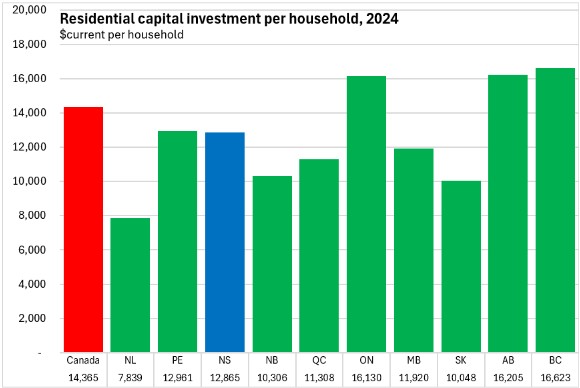
Nova Scotia had $12,865 per household in residential capital investment in 2024. This was 89.6% of the national level of residential investment per household ($14,365). British Columbia, Alberta and Ontario reported the highest levels of residential capital investment per household while Newfoundland and Labrador reported the lowest.
Although apartments made up less than half of the residential capital stock in 2024 for every province, apartment investment accounted for 50% or more of residential investment in: Nova Scotia, New Brunswick, Québec, Ontario and British Columbia.
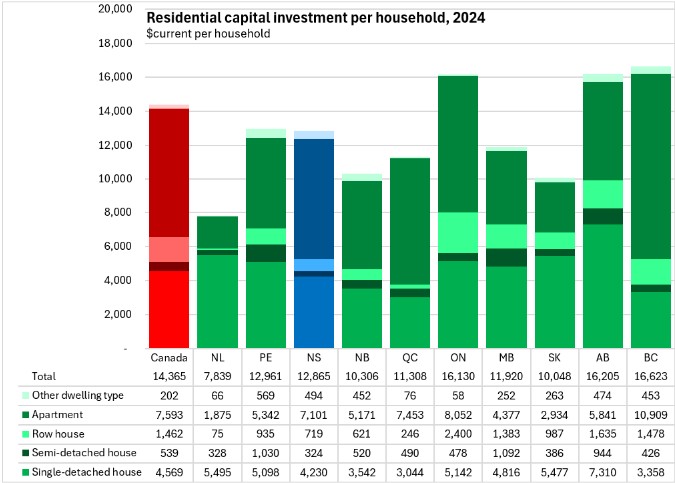
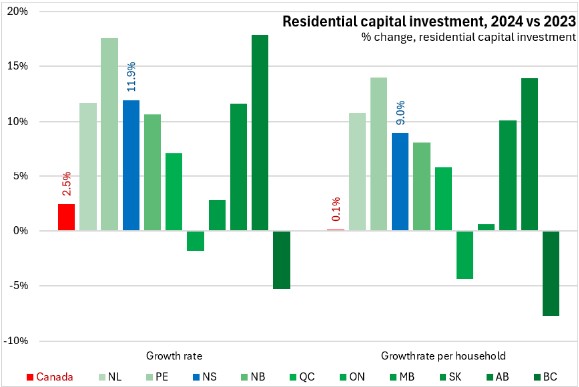
Nova Scotia's residential capital investment increased by 11.9% in 2024 (+9.0% per household). National residential capital investment was up just 2.5% (+0.1% per household) with declines in Ontario and British Columbia. Alberta and Prince Edward Island reported the fastest growth in residential capital investment in 2024.
Measured at constant prices, Nova Scotia's residential investment per household increased steadily from 2014-2022 before dropping in 2023.
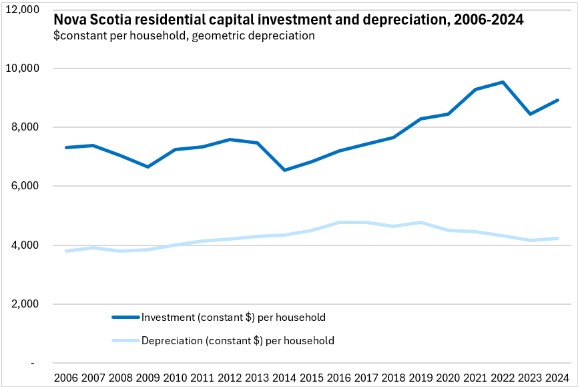
Although real per household investment was still below its 2022 peak in 2024, it well outpaced depreciation, leading to a continued rise in net capital stock per household.
The HEA also assesses the average age of capital stock and the remaining useful service life of assets.
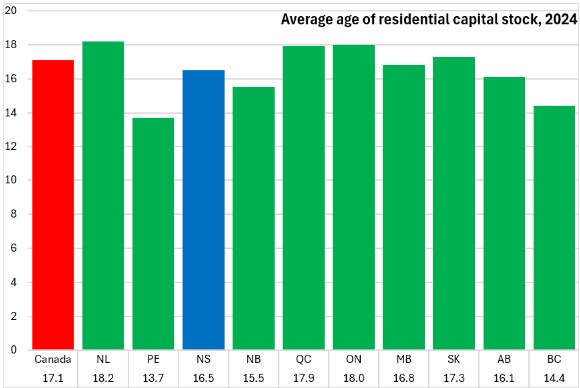
Nova Scotia's residential capital stock had an average age of 16.5 years, which was below the national average of 17.1 years. The oldest residential capital stock was in Newfoundland and Labrador (followed by Ontario and Québec). Prince Edward Island and British Columbia had the newest residential capital stock.
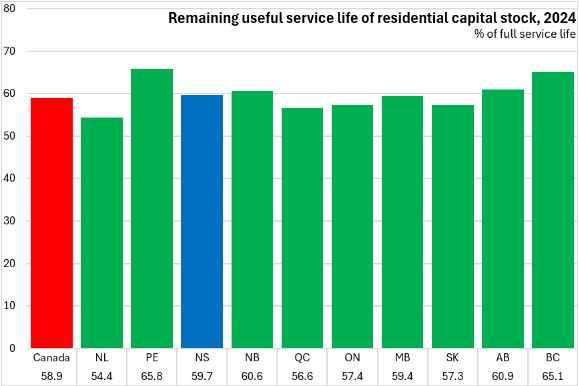
Nova Scotia's residential capital stock had 59.7% of its remaining useful service live available. This was above the national average of 58.9%. Provinces with older capital stock (Newfoundland and Labrador, Québec and Ontario) had less remaining useful service life while those with newer stock (Prince Edward Island, British Columbia) had longer remaining service lives.
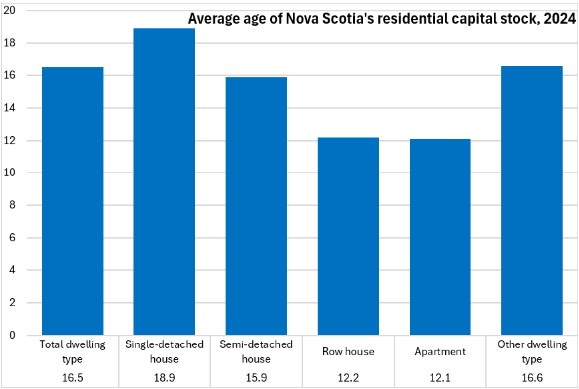
Nova Scotia's stock of single-detached housing was considerably older than the stock of apartments or row houses.
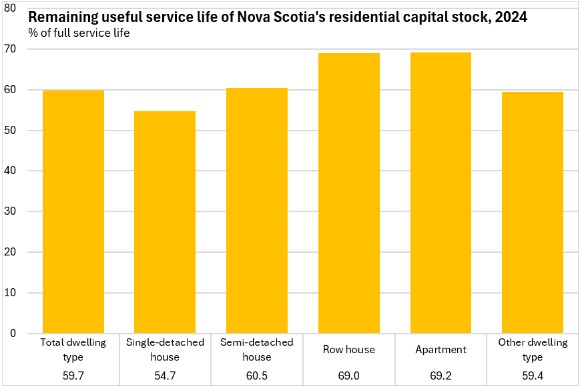
Nova Scotia's stock of single-detached dwellings had a remaining useful service life of 54.7% in 2024 while the remaining useful service lives of row houses (69.0%) and apartments (69.2%) were notably higher.
Source: Statistics Canada. Table 36-10-0677-01 Housing Economic Account, investment, depreciation and net stock by asset, sector, dwelling type, and housing type (x 1,000,000); Table 36-10-0680-01 Housing Economic Account, average age measures, by asset and dwelling type; Table 17-10-0159-01 Estimates of the number of private households by size on July 1st
<--- Return to Archive