The Economics and Statistics Division maintains archives of previous publications for accountability purposes, but makes no updates to keep these documents current with the latest data revisions from Statistics Canada. As a result, information in older documents may not be accurate. Please exercise caution when referring to older documents. For the latest information and historical data, please contact the individual listed to the right.
<--- Return to Archive
For additional information relating to this article, please contact:
July 24, 2025EMPLOYMENT INSURANCE, MAY 2025 Monthly (May 2025 vs April 2025, seasonally adjusted regular beneficiaries)
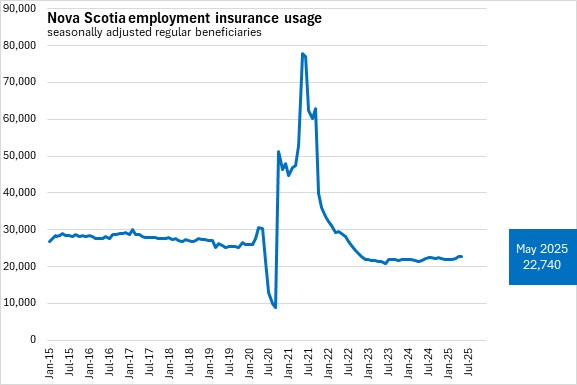
In May 2025, there were 22,740 Nova Scotians in receipt of regular employment insurance benefits (seasonally adjusted). Nova Scotia's seasonally adjusted regular employment insurance usage increased by 60 (+0.3%) from revised April results to May.
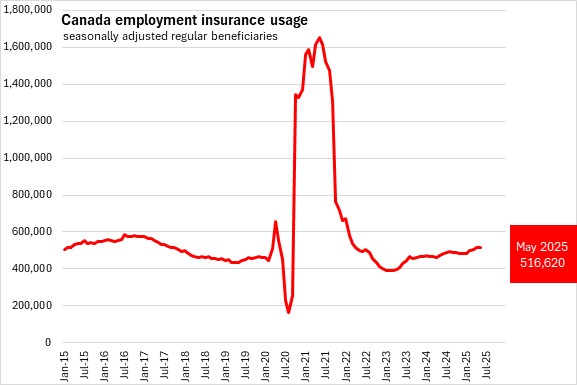
There were 516,620 Canadians that received regular employment insurance benefits in May 2025 (seasonally adjusted), a decrease of 1,580 (-0.3%) from the revised April 2025 value.
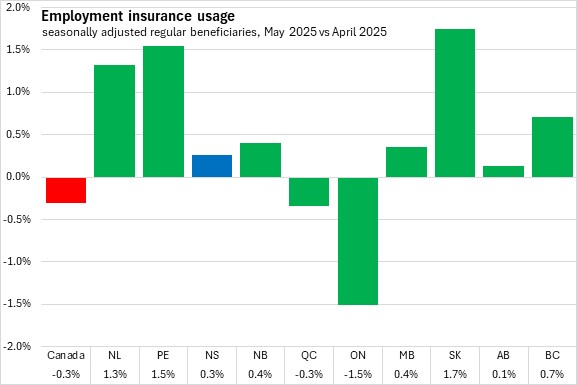
When compared to April 2025, eight provinces reported higher employment insurance usage. However, declines in employment insurance usage in Québec and Ontario brought the national average down. Saskatchewan and Prince Edward Island reported the fastest growth in employment insurance usage over the previous month.
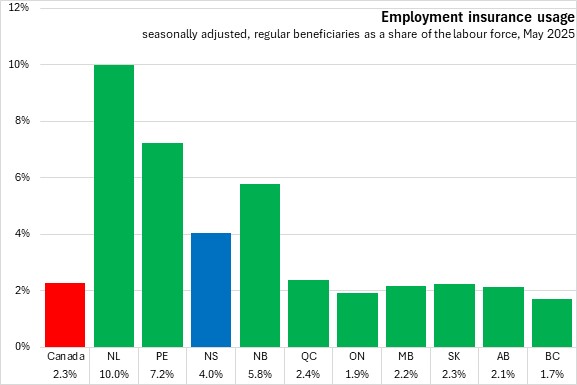
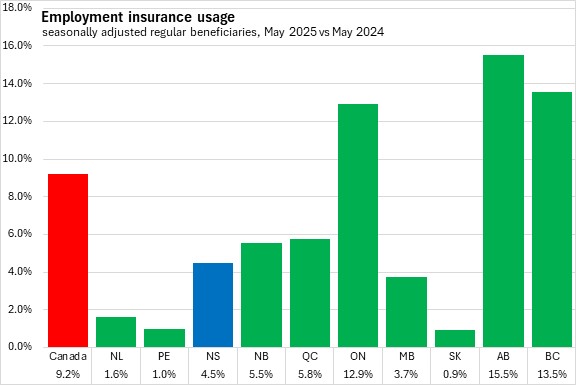
The number of employment insurance beneficiaries amounted to 4.0% of the labour force in Nova Scotia in May 2025. Nationally, the share of beneficiaries was 2.3% of the labour force. Newfoundland and Labrador had the largest share of beneficiaries of the labour force, while British Columbia had the lowest.
Year-over-year (May 2025 vs May 2024)
Compared to May 2024, Nova Scotia's employment insurance usage rose 4.5% (+970). National employment insurance usage increased 9.2% (+43,590) compared to May 2024. All provinces reported higher employment insurance compared to one year ago, with the fastest rise in Alberta. Saskatchewan and Prince Edward Island had the slowest year-over-year growth in employment insurance.
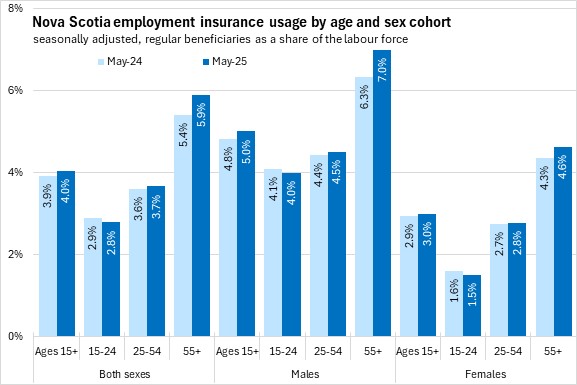
Use of employment insurance (as a share of the labour force) was lowest for youth (15-24) and highest for workers age 55 and over. Male use of employment insurance was higher as a share of the labour force than female use of employment insurance for youth and core aged workers (25-54) while older females reported a higher share of labour force using employment insurance in May 2025. Compared to one year ago, employment insurance usage increased for core aged and older cohorts (for both males and females) while employment insurance usage as a share of labour force was down for youth (both males and females).
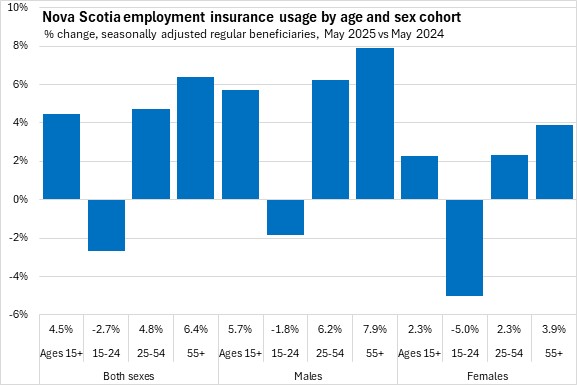
The year-over-year increase in employment insurance usage reflected increases for core aged and older cohorts. Males in core aged and older cohorts reported faster increases in employment insurance usage compared to females in the same cohorts.

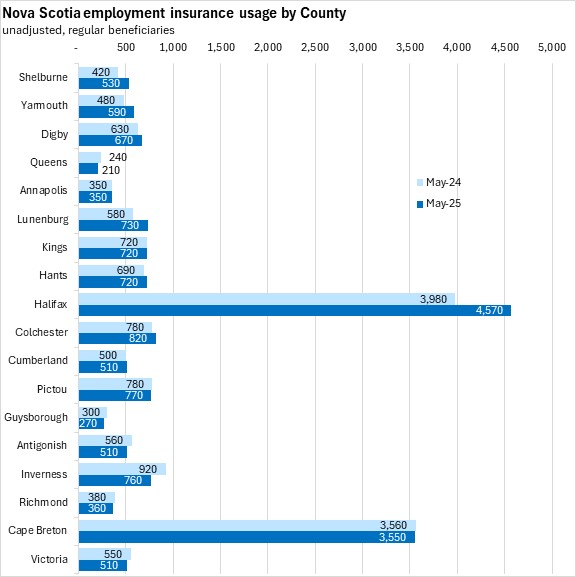
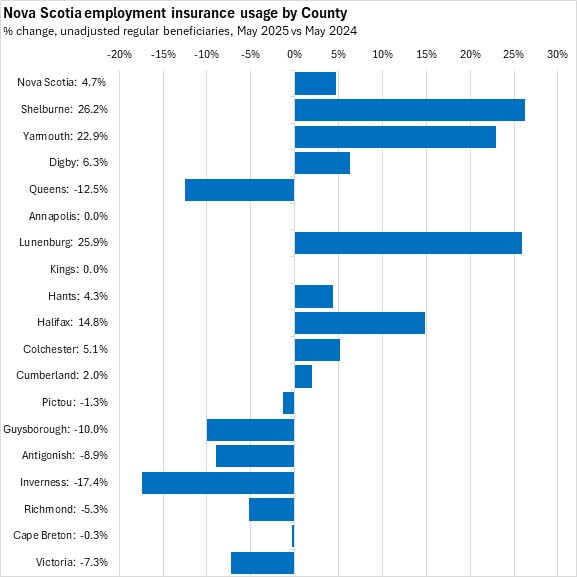
Comparing unadjusted regular beneficiaries for May 2025 against May 2024, employment insurance usage declined in Queens, Pictou, Guysborough, and Antigonish counties as well as all four counties on Cape Breton Island. Employment insurance usage increased the most (in percentage terms) in Lunenburg, Shelburne, and Yarmouth counties.
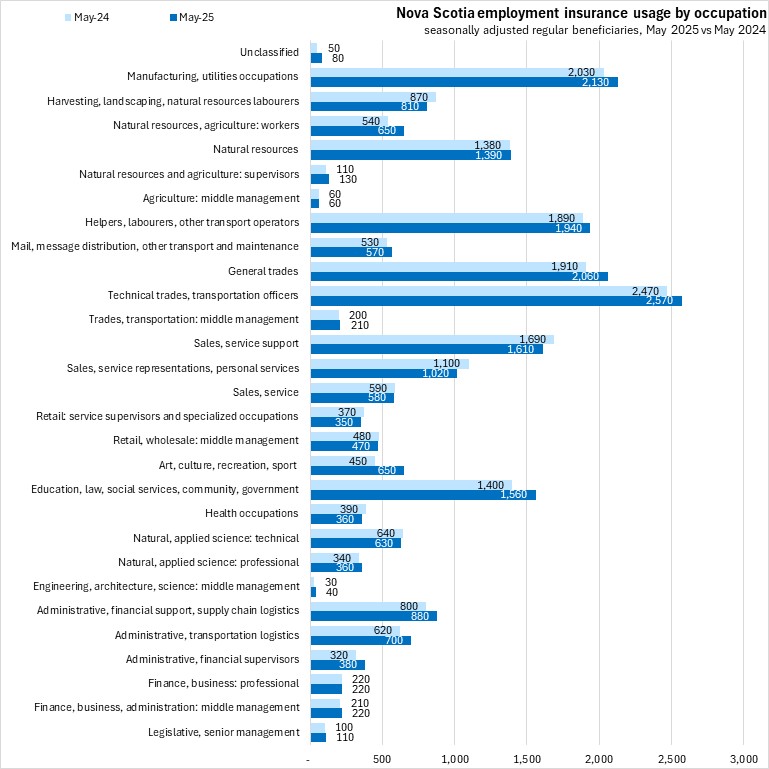
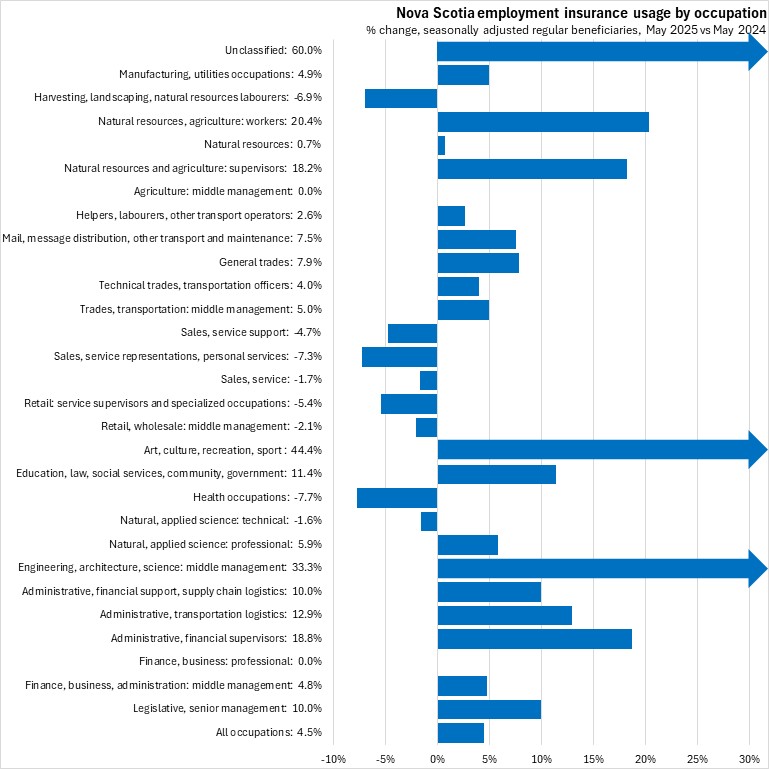
By occupation, employment insurance beneficiaries were more likely to be in technical trades/transportation, manufacturing/utilities, general trades, and helpers/labourers/other transport operators. Employment insurance usage was up notably for each of these occupations as well as for those in art/culture/recreation/sport occupations and educaiton/law/social services/community services/government occupations. In percentage terms, there were also sizable increases in employment insurance usage among engineering/architecture/science middle management occupations, but this started from a very small level. There were notable declines in employment insurance usage for those in harvesting/landscaping, sales/service support positions, services representatives/personal services workers and health occupations.
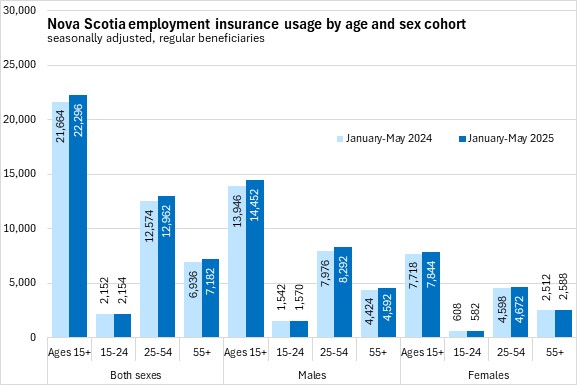
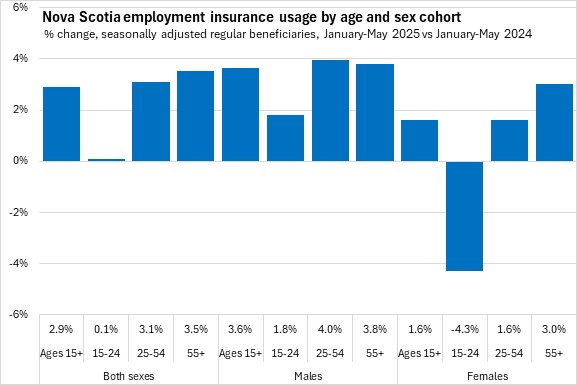
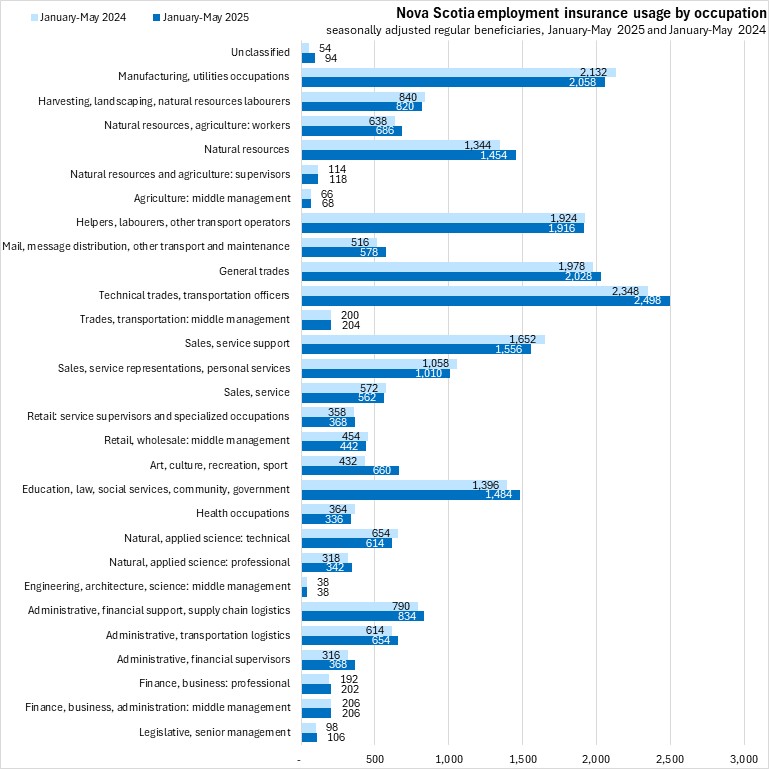
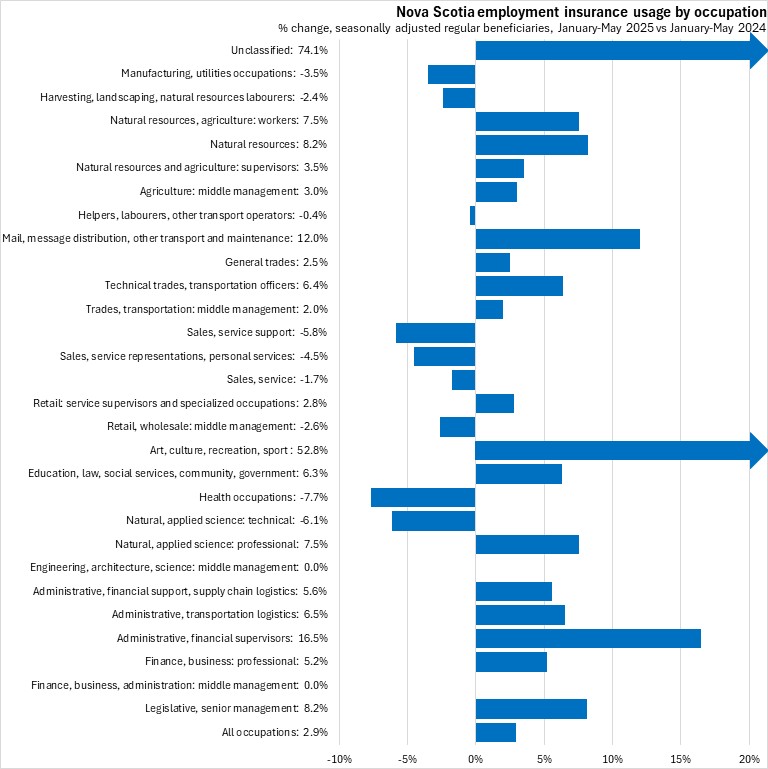
Year-to-date (January-May 2025 vs January-May 2024)
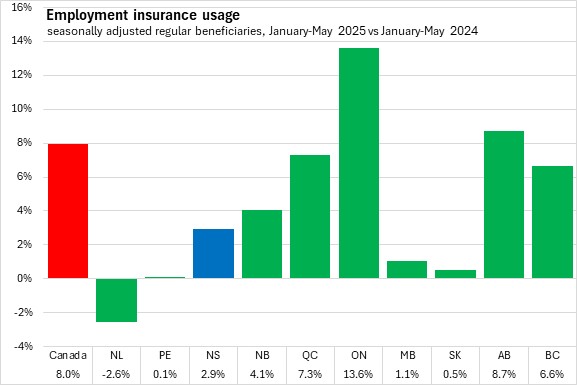
Compared to the first five months of 2024, Nova Scotia's employment insurance usage increased 2.9%. National employment insurance usage increased 8.0% compared to January-May 2024. All provinces except Newfoundland and Labrador reported higher employment insurance usage year-to-date, with the fastest increase in Ontario.
Year-to-date employment insurance usage was higher due to increases among all age and sex cohorts except females aged 15-24.
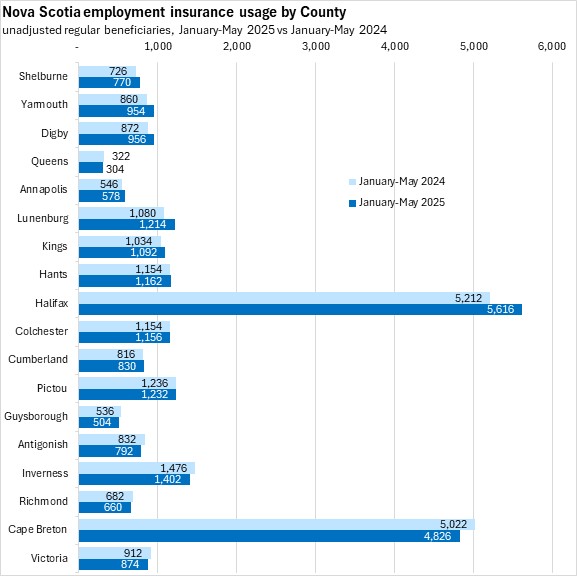
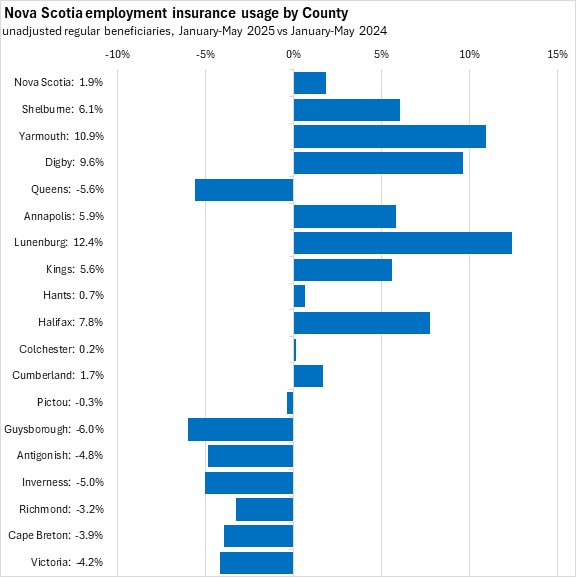
Comparing the first five months of 2025 with the same period in 2024, employment insurance usage declined in Queens, Pictou, Guysborough and Antigonish counties along with all four counties on Cape Breton Island. Employment insurance usage increased the most (in percentage terms) in Lunenburg, Digby, and Yarmouth counties.
Year-to-date employment insurance usage declined notably in health occupations, technical occupations in natural/applied science, sales/service support and manufacturing/utilities occupations. Among classified occupations employment insurance usage increased notably for occupations in art/culture/recreation/sport, techical trades/transport officers, administrative/financial supervisors, administrative/transportation logistics and administrative/financial support/supply chain logistics.
Source: Statistics Canada. Table 14-10-0011-01 Employment insurance beneficiaries (regular benefits) by province and territory, monthly, seasonally adjusted; Table 14-10-0323-01 Employment insurance beneficiaries by census division, monthly, unadjusted for seasonality; Table 14-10-0456-01 Employment insurance beneficiaries (regular benefits) by province, territory and occupation, monthly, seasonally adjusted; Table 14-10-0287-01 Labour force characteristics, monthly, seasonally adjusted and trend-cycle, last 5 months
<--- Return to Archive