The Economics and Statistics Division maintains archives of previous publications for accountability purposes, but makes no updates to keep these documents current with the latest data revisions from Statistics Canada. As a result, information in older documents may not be accurate. Please exercise caution when referring to older documents. For the latest information and historical data, please contact the individual listed to the right.
<--- Return to Archive
For additional information relating to this article, please contact:
July 31, 2025PAYROLL EMPLOYMENT AND AVERAGE WEEKLY EARNINGS, MAY 2025 Monthly (May 2025 vs April 2025, seasonally adjusted)
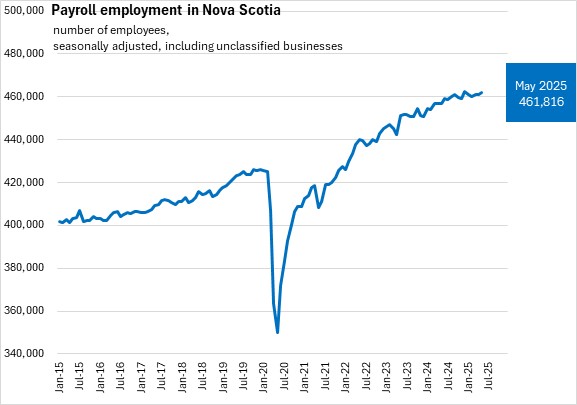
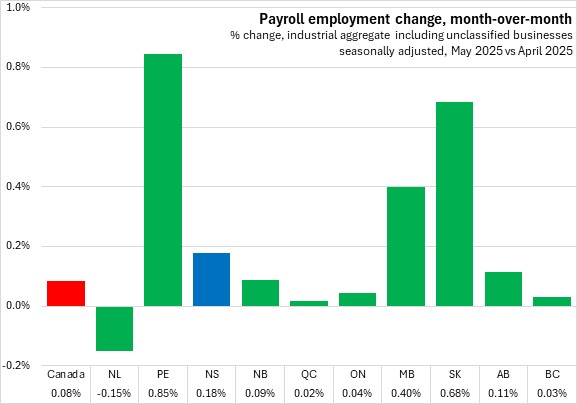
Nova Scotia had 461,816 payroll employees in May 2025, up 0.18% (+823) compared to April 2025. Canada had 18.25 million employees, up 0.08% from April 2025. There were gains in all provinces except Newfoundland and Labrador. The fastest gains were reported in Prince Edward Island and Saskatchewan.
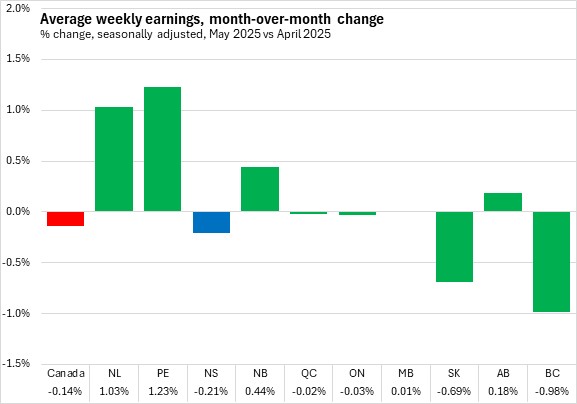
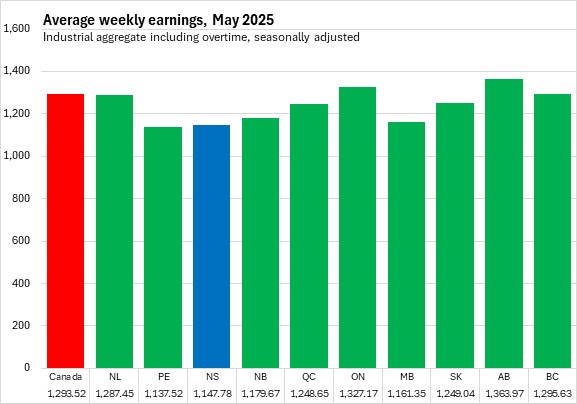
Nova Scotians' average weekly earnings were $1,147.78 in May 2025, a decline of $2.41 (-0.21%) from April 2025.
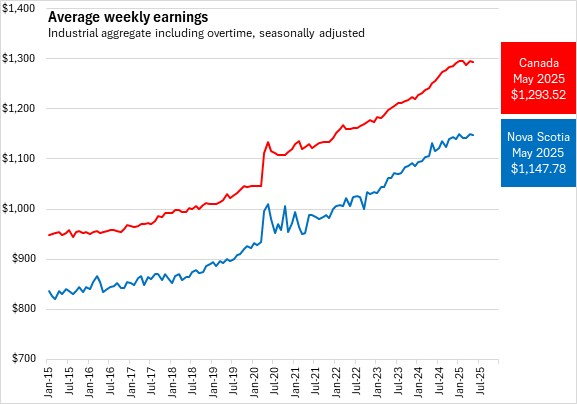
Nationally, average weekly earnings were $1,293.52, a decline of 0.14% (-$1.77) from average weekly earnings in April. Five provinces reported gains in average weekly earnings, with the fastest gain in Prince Edward Island. The fastest decline was reported in British Columbia.
Nova Scotia's average weekly earnings in May 2025 were second lowest among provinces, ahead of Prince Edward Island. Alberta reported the highest average weekly earnings.
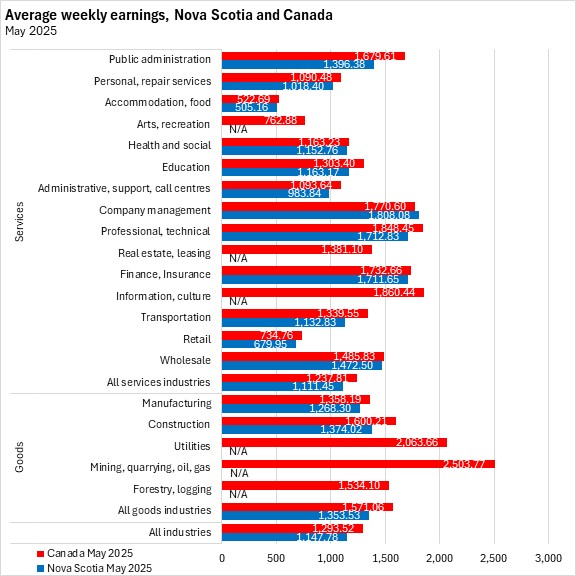
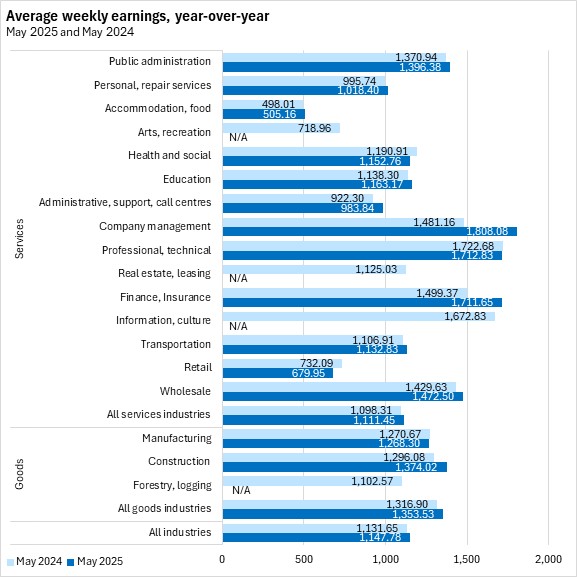
Nova Scotia's average weekly earnings were highest in company management, professional/technical services, and finance/insurance industries. The lowest average weekly earnings were reported in Nova Scotia's accommodations/food service industries, and retail trade.
(Note: data are not available for Nova Scotia's utilities and mining sectors, and were not available in May 2025 for: forestry/logging, information/culture, real estate/rental/leasing, and arts/entertainment/recreation.)
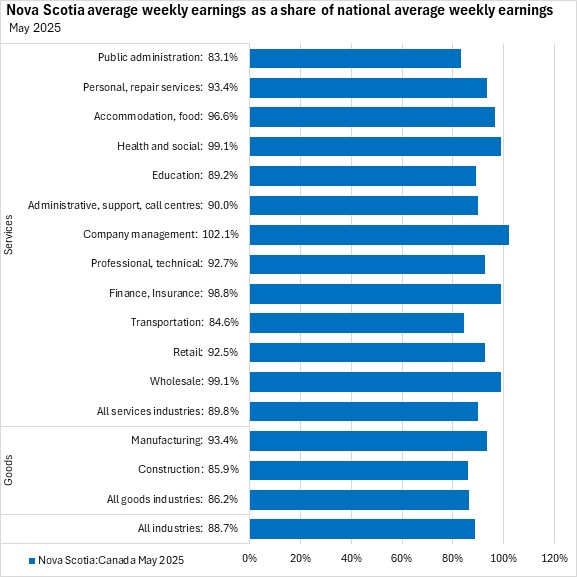
In May 2025, Nova Scotia's average weekly wages were 88.7% of the national average. Nova Scotia average weekly wages were below the comparable national average for every industry except company management. The smallest gaps were reported among health/social assistance and wholesale trade. The largest gap was reported in public administration (83.1% of the national average).
Year-over-year (May 2025 vs May 2024)
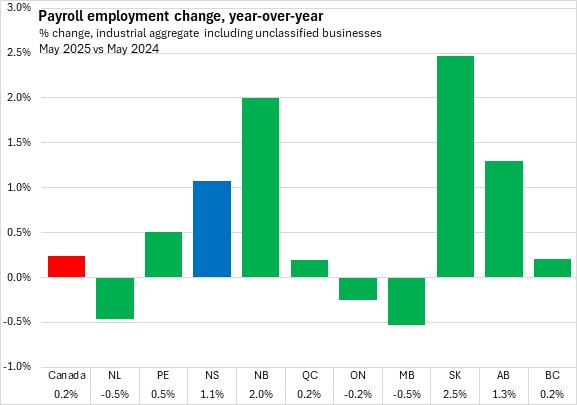
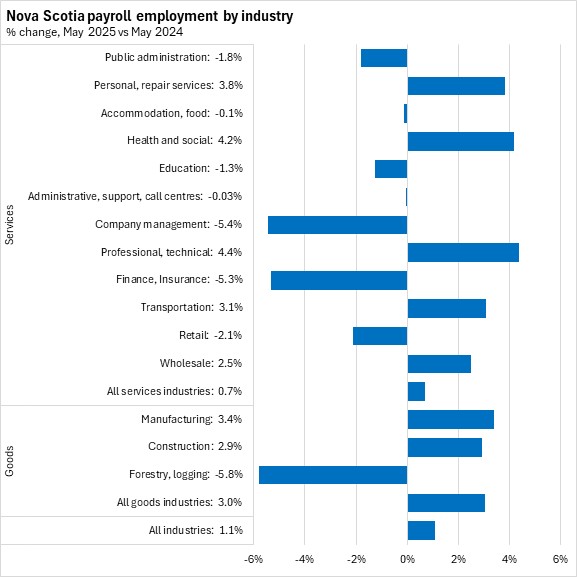
Compared with the same month in 2024, Nova Scotia's payroll employment grew by 1.1% (+4,897) in May 2025. This was faster than the national average gain of 0.2%. Seven provinces reported growth in payroll employment with the fastest gains in New Brunswick and Saskatchewan. The fastest declines were reported in Manitoba and Newfoundland and Labrador.
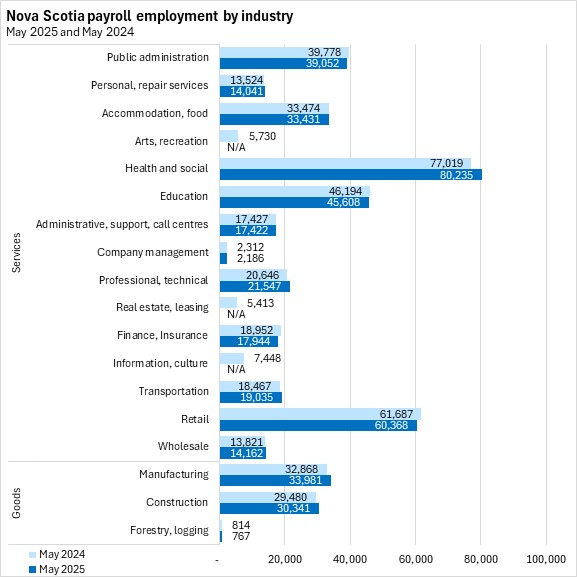
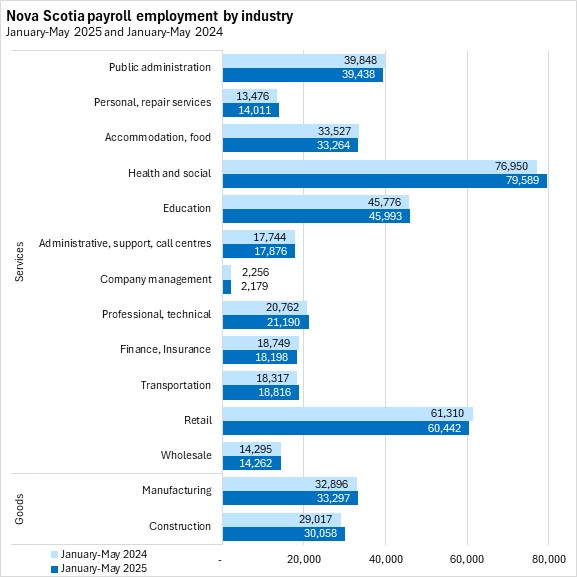
Among the industries reported on by Statistics Canada, Nova Scotia's largest industries of employment were health care/social assistance (which includes daycares), followed by retail trade and education.
(Note: data are not available for Nova Scotia's utilities and mining sectors, and were not available from January 2025 to May 2025 for: information/culture, real estate/rental/leasing, and arts/entertainment/recreation.)
Professional/technical had the fastest year-over-year growth in payroll employment in Nova Scotia, followed by health/social assistance. Forestry/logging, company management and finance/insurance reported the largest percentage declines in payroll employment.
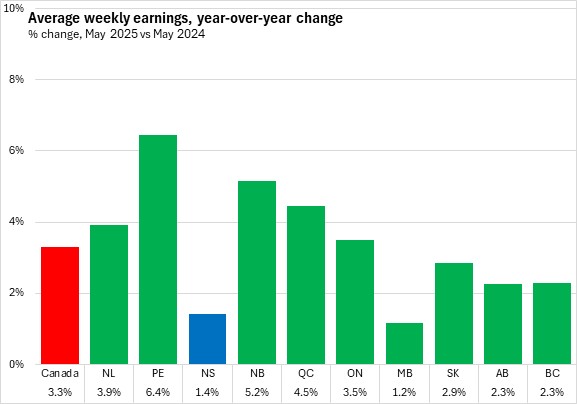
Average weekly wages grew by 1.4% in Nova Scotia from May 2024 to May 2025, the second slowest gain among provinces. This was weaker than the national pace of 3.3%.
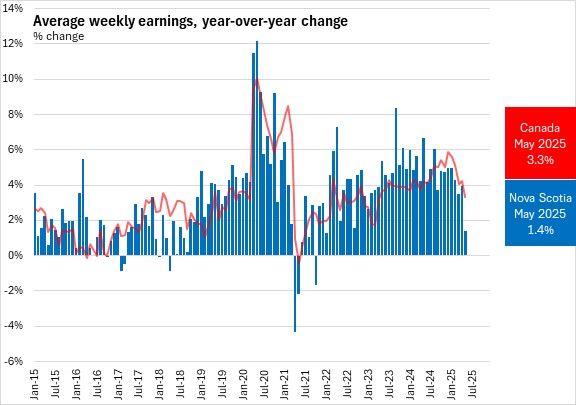
Average weekly wages grew by 3.3% across Canada from May 2024 to May 2025. There were gains in each province, with the fastest increase in Prince Edward Island. Manitoba reported the slowest gain.
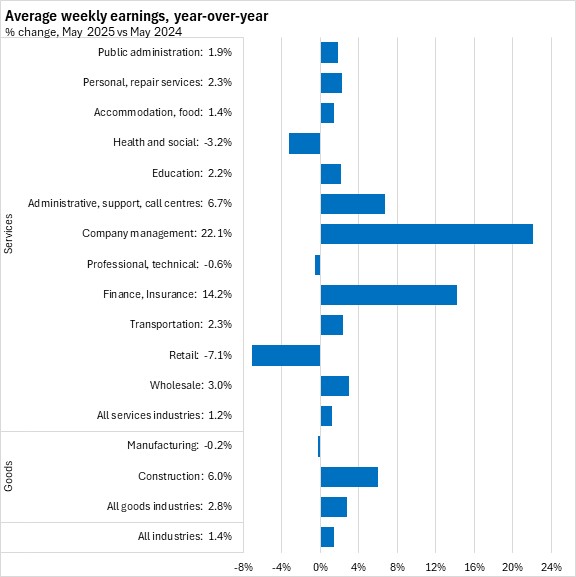
Average weekly wages were up 2.8% in Nova Scotia's goods-producing industries and up 1.2% in Nova Scotia's services-producing industries. All of the reported industries except retail trade, health/social assistance, professional/technical services and manufacturing had year-over-year growth in average weekly wages with the largest increases in company management and finance/insurance.
(Note: data are not available for Nova Scotia's utilities and mining sectors, and were not available in May 2025 for: forestry/logging, information/culture, real estate/rental/leasing, and arts/entertainment/recreation.)
Year-to-date (January-May 2025 vs January-May 2024)
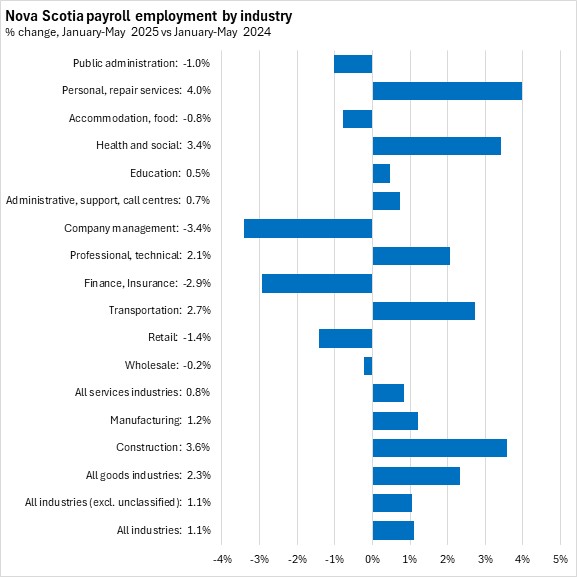
In the first five months of 2025, Nova Scotia's payroll employment increased 1.1%. This was faster than the national average of 0.5% as all provinces reported growth except Manitoba. The fastest year-to-date growth was reported in Saskatchewan and New Brunswick.
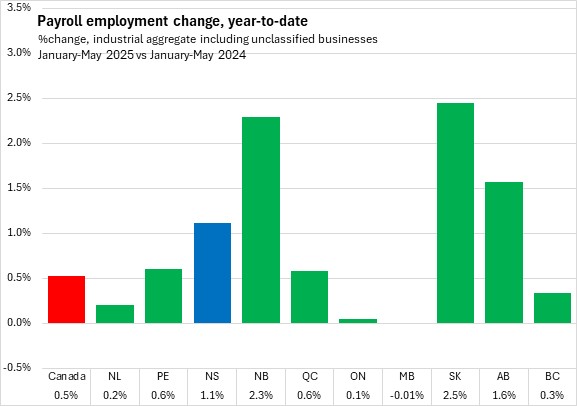
Personal/repair services, construction, and health care/social assistance reported the fastest growth in payroll employment in the first five months of 2025 in Nova Scotia. The fastest declines were reported in company management and finance/insurance.
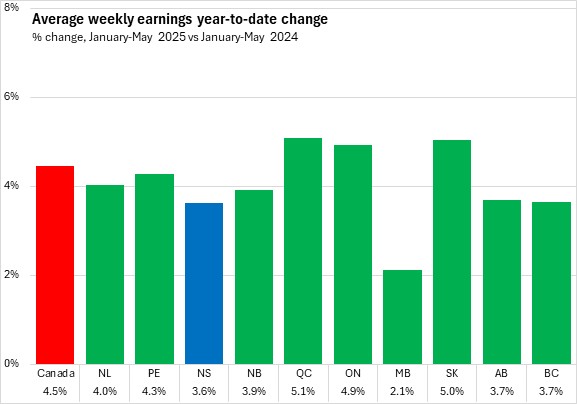
In January-May 2025, average weekly earnings grew 3.6% in Nova Scotia compared to the same period last year. National average weekly earnings grew 4.5% with all provinces reporting growth over this period. Québec and Saskatchewan reported the fastest growth while Manitoba reported the slowest.
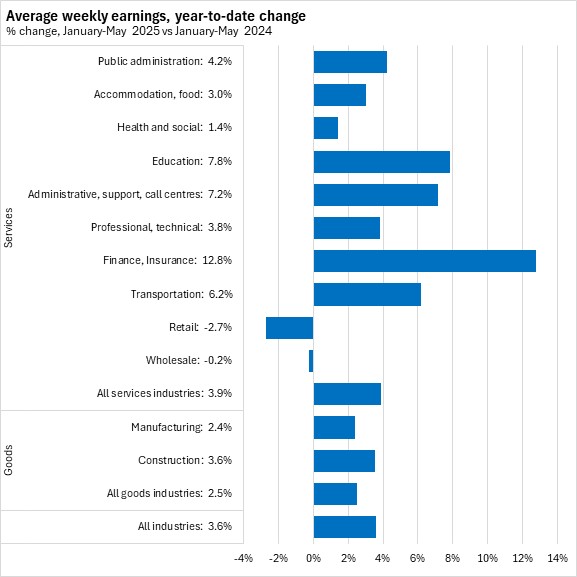
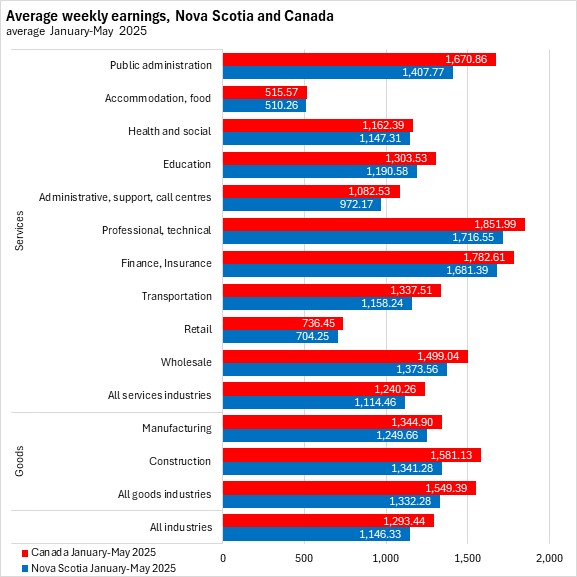
Nova Scotia's average weekly earnings were highest in professional/technical services, finance/insurance, and public administration in the first five months of the year. Average weekly earnings among payroll employees grew the fastest for finance/insurance, followed by education. Retail and wholesale trade reported lower average weekly earnings, year-to-date.
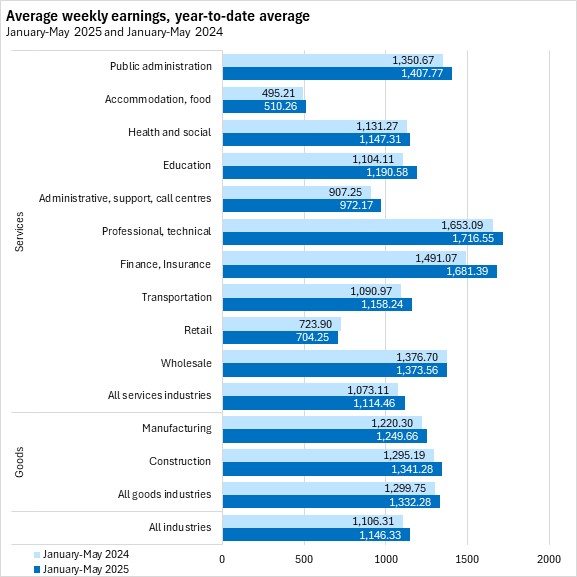
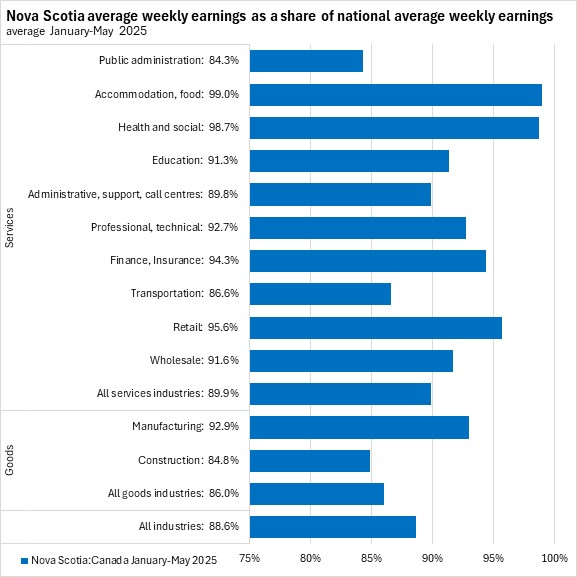
Nova Scotian average weekly earnings were below the national average for all reported industries in the first five months of 2025 (average: 88.6%). The gap was smallest for accommodation/food services (99.0% of the national average) and health/social assistance (98.7% of the national average). The gaps were largest for public administration (84.3% of the national average) and construction (84.8% of the national average).
Source: Statistics Canada. Table 14-10-0222-01 Employment, average hourly and weekly earnings (including overtime), and average weekly hours for the industrial aggregate excluding unclassified businesses, monthly, seasonally adjusted; Table 14-10-0223-01 Employment and average weekly earnings (including overtime) for all employees by province and territory, monthly, seasonally adjusted
<--- Return to Archive