The Economics and Statistics Division maintains archives of previous publications for accountability purposes, but makes no updates to keep these documents current with the latest data revisions from Statistics Canada. As a result, information in older documents may not be accurate. Please exercise caution when referring to older documents. For the latest information and historical data, please contact the individual listed to the right.
<--- Return to Archive
For additional information relating to this article, please contact:
August 11, 2025STUDY: PURCHASING POWER PARITIES FOR CONSUMPTION AND HOUSEHOLD INCOME ACROSS THE CANADIAN PROVINCES AND TERRITORIES Statistics Canada has released a study which develops regional purchasing power parities (PPPs) for Canada that can be used to adjust for local price levels when making interprovincial comparisons. These PPPs are used to create price-adjusted measures of household disposable income per capita and allow for analysis of differences in real incomes across provinces.
Many high-income countries are experiencing a period of increasing regional inequality. This inequality can be measured in several ways, and Canadian research has focused on the increasing differences between provinces in terms economic development, employment precariousness, and income per capita. The recent paper seeks to provide new evidence on regional economic differences by developing regional purchasing power parities (PPPs), which can be used to adjust for price levels when making interprovincial comparisons.
Methodology
The study uses an index number approach, which uses data on prices and expenditures to calculate PPPs, consistent with methodology used by the OECD, the World Bank, and Statistics Canada. Prices for household consumption were collected from Statistics Canada's CPI program in 2021. Price averages were taken for representative products in each province and used to calculate price ratios between regions. As there is no readily available market price for government provided services, hourly wages in sectors providing government services were taken from the labour force survey as a proxy for input prices and used to estimate the price of government services. Housing costs were taken from the 2021 Census rather than using CPI data to better allow for interprovincial comparisons.
Expenditure weights were based on expenditures reported in each region at various commodity code levels. Private consumption weights were based on those reported in the Canadian System of Macroeconomic Accounts (2018), while government expenditures were based on Statistics Canada's Classification of the Functions of Government (2022). Ontario was used as the basis for comparison, and as such will have the value of 1.0 in the reported results. A PPP of less than one indicates a region has lower prices than Ontario, while a PPP of greater than one indicates a region is more expensive than Ontario.
Results
Provincial purchasing power parities
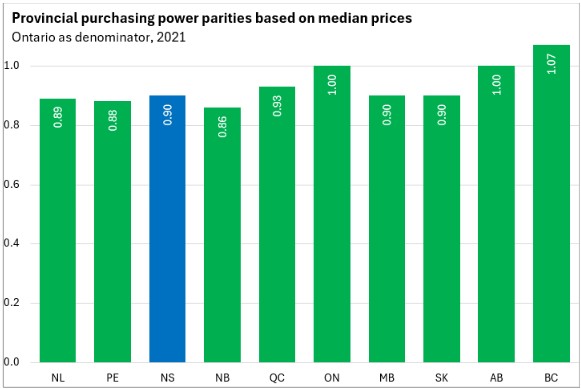
Once provincial purchasing power parities were calculated, it was possible to observe the relative price differences between regions. British Columbia had the highest overall prices among Canadian provinces, followed by Ontario and Alberta. The Atlantic provinces had comparably lower prices, with New Brunswick experiencing the lowest prices in Canada.
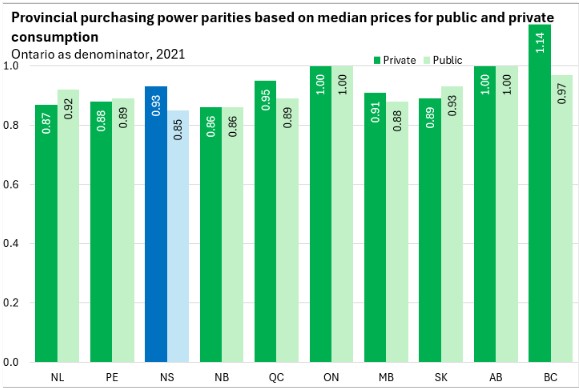
When comparing prices for public and private goods and services, British Columbia had significantly higher prices for private consumption, while New Brunswick had the lowest prices for private goods and services. Prices for public services were highest in Ontario and Alberta, and lowest in Nova Scotia.
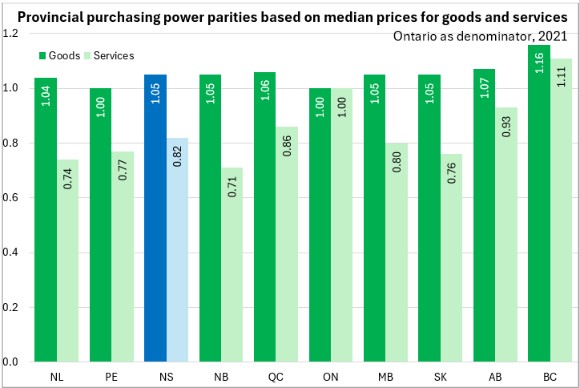
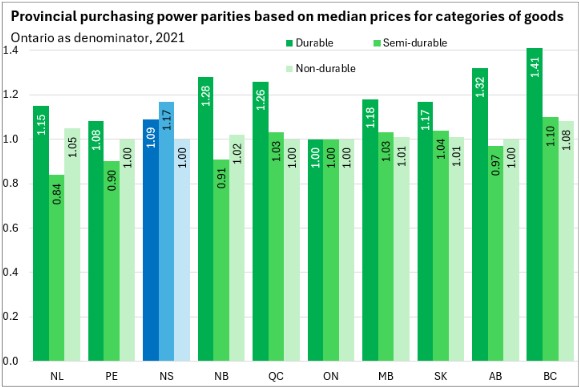
Within private consumption, Prince Edward Island and Ontario had the lowest prices for goods, while British Columbia had the highest. All other provinces reported higher prices for goods than Ontario. British Columbia also had the highest prices for services, followed by Ontario, while New Brunswick had the lowest prices for services. All provinces except British Columbia reported lower prices for services than Ontario.
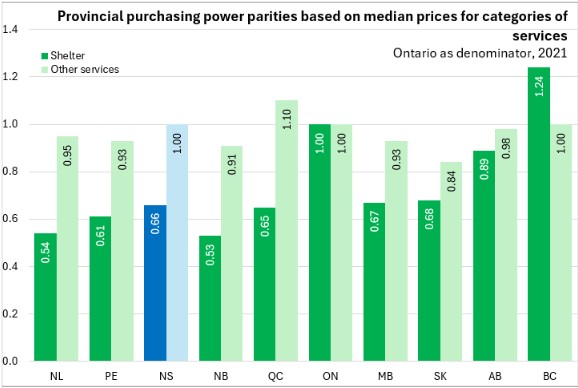
Prices for services were broken down between shelter and all other services. Shelter costs were significantly higher in British Columbia, and lower in the Atlantic provinces (plus Québec). Other services cost the most in Québec, and the least in Saskatchewan.
Goods prices were separated into durable, semi-durable, and non-durable goods. Prices for durable goods were highest in British Columbia, followed by Alberta, and lowest in Ontario. Semi-durable goods prices were highest in Nova Scotia, and lowest in Newfoundland and Labrador. British Columbia experienced the highest non-durable goods prices in Canada, while Alberta, Ontario, Québec, Nova Scotia and Prince Edward Island had the lowest prices.
Adjusted household disposable income per capita
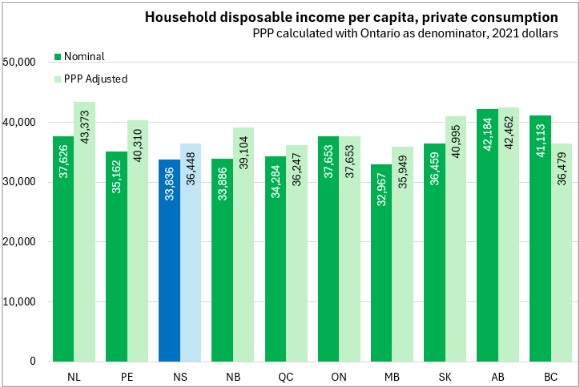
Once provincial purchasing power parities were calculated, it was possible to adjust provincial household disposable income per capita (HDIC) accordingly. This allowed the authors to compare household buying power when differences in provincial prices were considered. In adjusted private consumption, Newfoundland and Labrador had the highest HDIC, while Manitoba had the lowest.
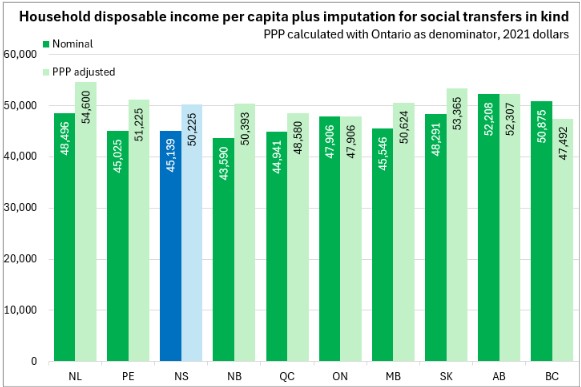
After social transfers in kind were considered, Newfoundland and Labrador had the highest PPP-adjusted HDIC. While most provinces saw increases in HDIC once prices were considered, British Columbia saw the only decline, indicating that wages in British Columbia were not sufficient to compensate for higher prices. While British Columbia had the second-highest HDIC in nominal terms, adjusted for price differences British Columbia had the lowest HDIC in Canada.
Source: Statistics Canada: Purchasing Power Parities for Consumption and Household Income Across the Canadian Provinces and Territories
<--- Return to Archive