The Economics and Statistics Division maintains archives of previous publications for accountability purposes, but makes no updates to keep these documents current with the latest data revisions from Statistics Canada. As a result, information in older documents may not be accurate. Please exercise caution when referring to older documents. For the latest information and historical data, please contact the individual listed to the right.
<--- Return to Archive
For additional information relating to this article, please contact:
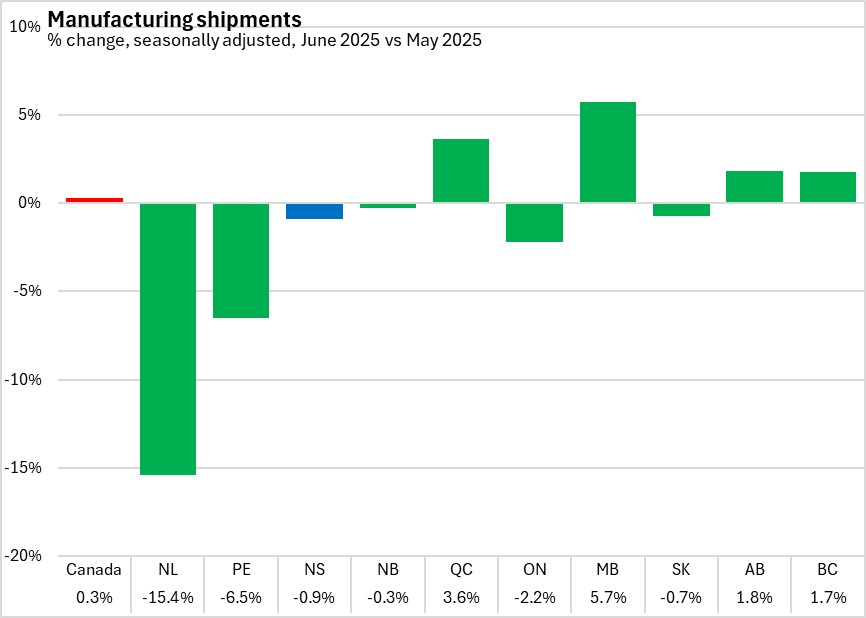
August 15, 2025MANUFACTURING SHIPMENTS, JUNE 2025 Monthly (seasonally adjusted, June 2025 vs May 2025)
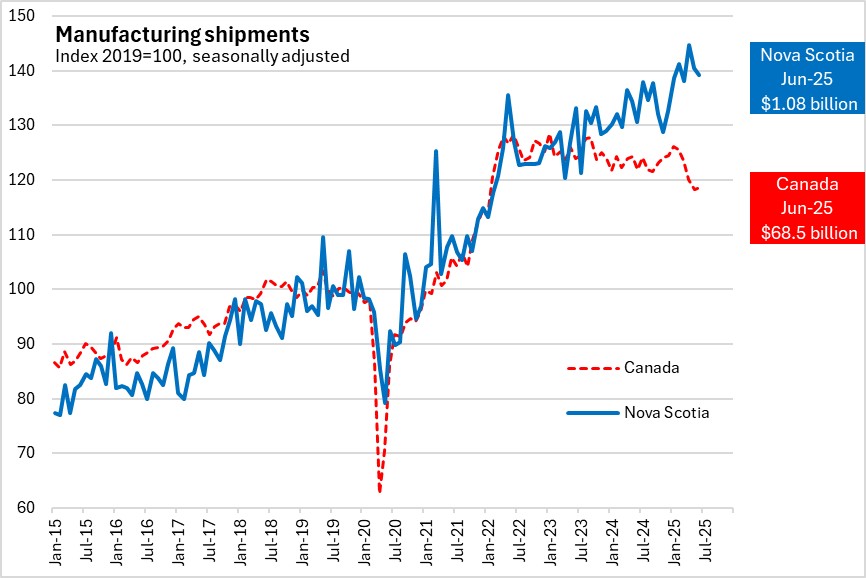
Nova Scotia's manufacturing shipments decreased 0.9% to $1.083 billion. National shipments increased 0.3% to $68.5 billion.
Manufacturing shipments were up in four provinces. Manitoba reported the largest monthly increase in manufacturing shipments while Newfoundland and Labrador reported the largest decrease.
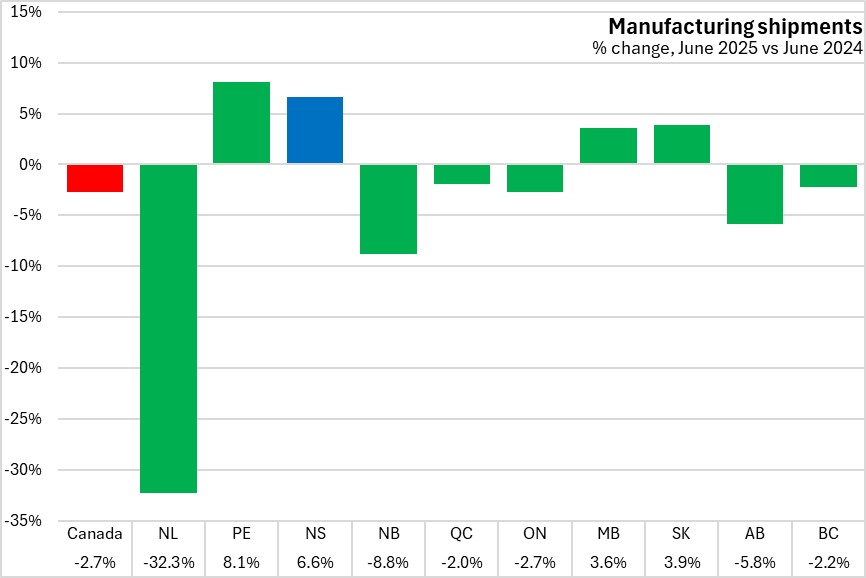
Year-over-year (June 2025 vs June 2024)
Nova Scotia's manufacturing shipments increased by 6.6% compared to the same month in 2024. National shipments decreased 2.7% in manufacturing shipments. Prince Edward Island reported the largest increase while Newfoundland and Labrador reported the steepest decline.
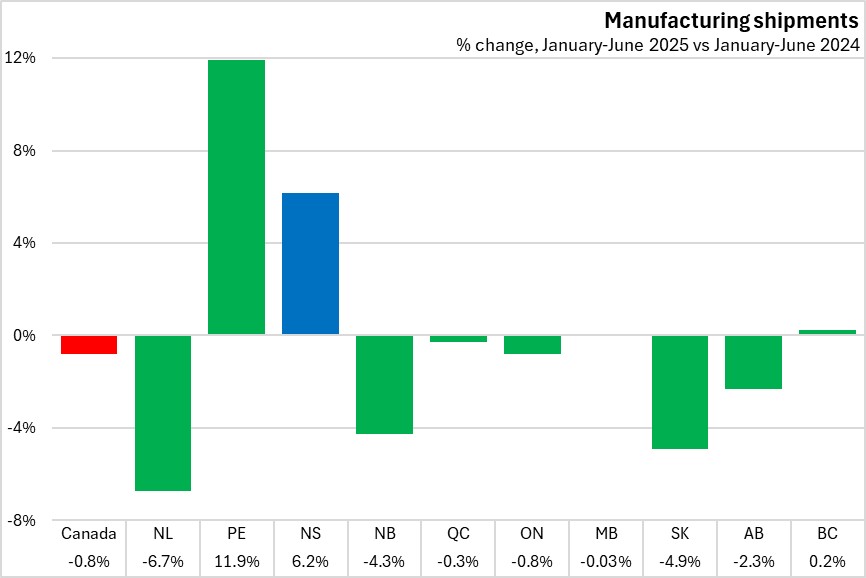
Year-to-date (January-June 2025 vs January-June 2024)
Nova Scotia's manufacturing shipments increased by 6.2% compared to the same period in 2024. National shipments decreased 0.8%. Seven provinces reported decreases, led by Newfoundland and Labrador. Three provinces reported increases led by Prince Edward Island and Nova Scotia.
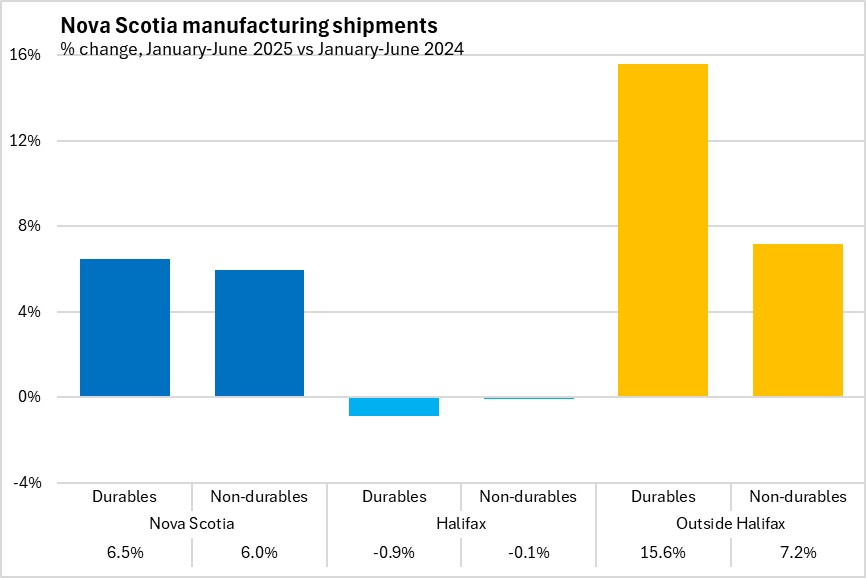
Nova Scotia year-to-date shipments were up for both durables and non-durables. Non-durable goods shipments from areas outside Halifax account for the largest portion of Nova Scotia's manufacturing output.
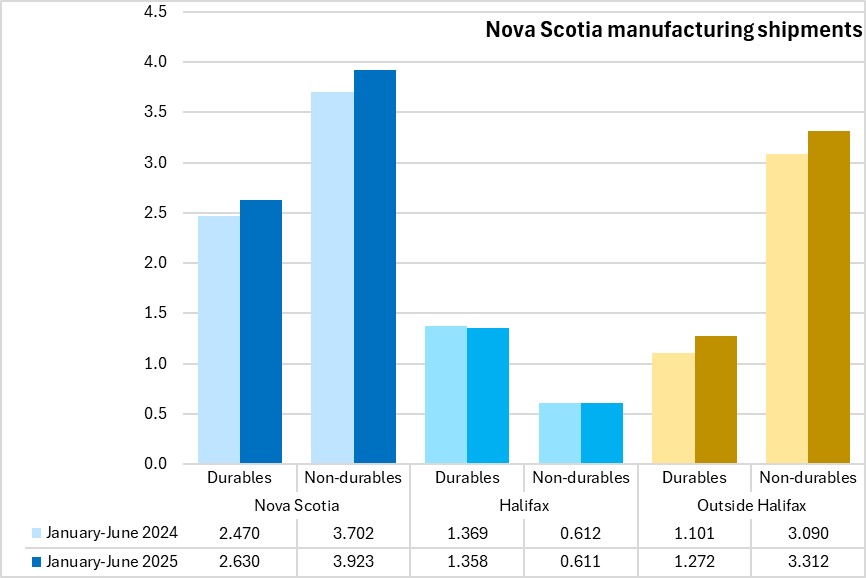
Nova Scotia's year-to-date durable goods shipments increased 6.5%, while non-durable goods shipments increased 6.0% in the same period. In Halifax, durable goods shipments decreased 0.9% and non-durables declined 0.1%, year-to-date. Outside Halifax, durables rose 15.6% while non-durables increased 7.2%.
Trends
Periodic spikes in Nova Scotia's shipments values are not uncommon. Throughout 2024, manufacturing shipments were stable, with volatility at both the national and provincial levels. Despite the decline in June 2025, the trend for Nova Scotia's manufacturing shipments was stronger than the national average.
Statistics Canada. Table 16-10-0047-01 Manufacturers' sales, inventories, orders and inventory to sales ratios, by industry (dollars unless otherwise noted); Table 16-10-0048-01 Manufacturing sales by industry and province, monthly (dollars unless otherwise noted) (x 1,000); Table 16-10-0011-01 Manufacturing sales, by industry for 12 Selected Census Metropolitan Areas (x 1,000)
<--- Return to Archive