The Economics and Statistics Division maintains archives of previous publications for accountability purposes, but makes no updates to keep these documents current with the latest data revisions from Statistics Canada. As a result, information in older documents may not be accurate. Please exercise caution when referring to older documents. For the latest information and historical data, please contact the individual listed to the right.
<--- Return to Archive
For additional information relating to this article, please contact:
August 19, 2025ANALYSIS OF CONSUMER PRICE INDEX FOR JULY 2025 Please note that the removal of the consumer carbon price on April 1, 2025 has affected energy prices, with all provinces (except Québec) also removing provincial consumer carbon prices. While other factors such as global commodity prices will continue to affect Canadian energy prices, it is expected that this policy change will be reflected in year-over-year rates until March 2026.
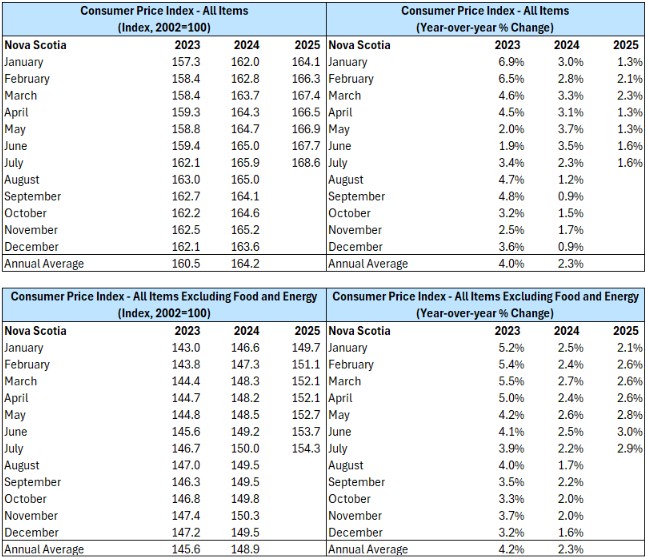
Nova Scotia’s all items Consumer Price Index (CPI) grew 1.6% year-over-year in July 2025, unchanged from the previous month.
Nationally, consumer prices grew 1.7% year-over-year in July 2025, 0.2 percentage points slower than the June inflation rate. Inflation was highest in Québec and slowest in New Brunswick.
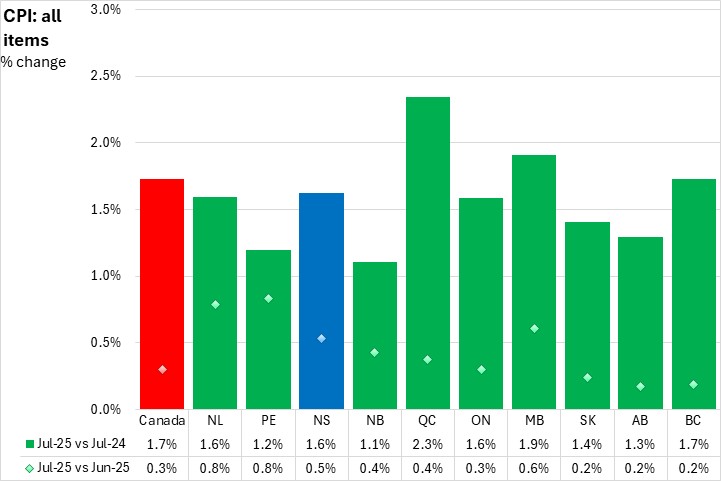
The most significant upward contributors (combining price increase as well as share of the consumption basket) to Nova Scotia's 1.6% year-over-year inflation were: rent, passenger vehicle insurance premiums, purchase and leasing of passenger vehicles, mortgage interest cost, and homeowners' replacement cost.
The largest downward year-over-year contributions were from: gasoline, inter-city transportation, fuel oil and other fuels, telephone services, and purchase and operation of recreational vehicles.
On a monthly basis, Nova Scotia's all items CPI was up 0.5% from June 2025 to July 2025. National prices were up 0.3% on average, with price gains reported in all provinces. Prince Edward Island and Newfoundland and Labrador reported the highest monthly inflation rates. Saskatchewan, Alberta and British Columbia reported the slowest monthly inflation.
Major upward contributors to Nova Scotia's monthly consumer prices were: traveller accommodation, inter-city transportation, telephone services, gasoline, and fuel oil and other fuels. Major downward contributors were: furniture, homeowners' maintenance and repairs, fresh or frozen pork, passenger vehicle parts, maintenance and repairs, and travel tours.
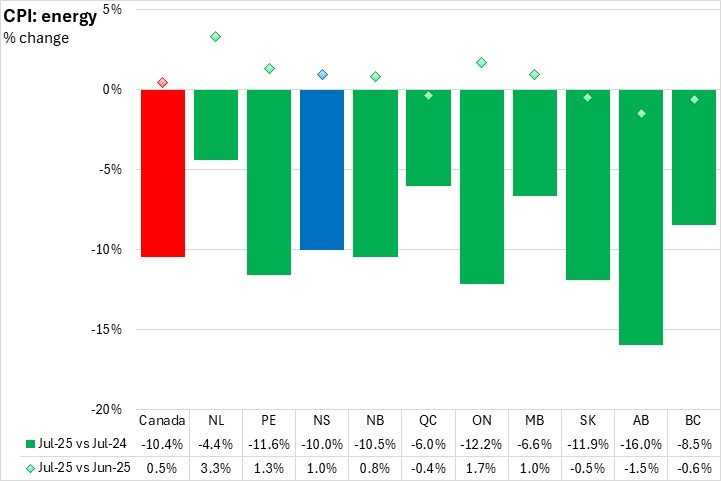
Energy prices play a significant role in inflation rates. Nova Scotia's energy prices (and overall inflation) are more sensitive to fluctuations in the global price of crude oil. Nova Scotia's energy prices were down 10.0% from July 2024 to July 2025. Year-over-year energy prices were down 10.4% nationally with all provinces reporting decreasing energy prices. Newfoundland and Labrador reported the slowest year-over-year decrease in energy prices, while Alberta reported the fastest decline.
On a monthly basis, Nova Scotia's energy prices rose 1.0% from June 2025 to July 2025. National energy prices were up 0.5% with six provinces reporting higher prices compared to the previous month. Newfoundland and Labrador reported the fastest monthly increase in energy prices, while Alberta reported the fastest decline.
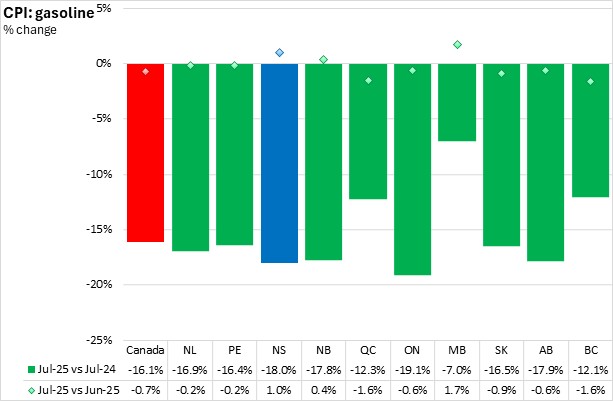
In July 2025, gasoline prices were down 18.0% compared to a year ago in Nova Scotia, the second-fastest decline among provinces behind Ontario. All provinces reported lower gasoline prices, with Manitoba having the slowest year-over-year decrease.
Gasoline prices were up 1.0% from June to July in Nova Scotia and down 0.7% nationally. Seven provinces reported monthly declines in gasoline prices, led by British Columbia and Québec. Manitoba saw the largest monthly increase in gasoline prices, followed by Nova Scotia.
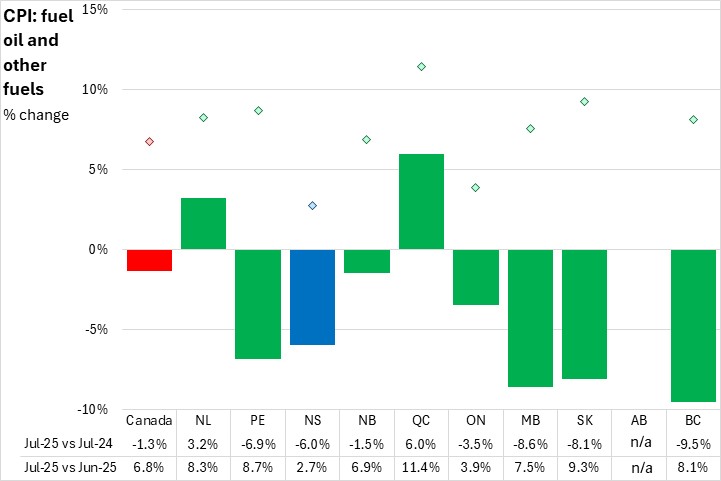
Nova Scotia's year-over-year fuel oil prices were down 6.0% in July 2025 compared with July 2024. Nationally, the fuel oil and other fuels price index decreased 1.3% compared to July 2024, with seven provinces reporting decreases. British Columbia reported the steepest drop in fuel oil prices while Québec saw the fastest increase.
On a monthly basis, Nova Scotia's fuel oil prices were up 2.7%. National fuel oil prices were up 6.8% from June to July, with increases observed in all reporting provinces. Québec reported the steepest monthly fuel oil price increase, while Nova Scotia saw the slowest increase.
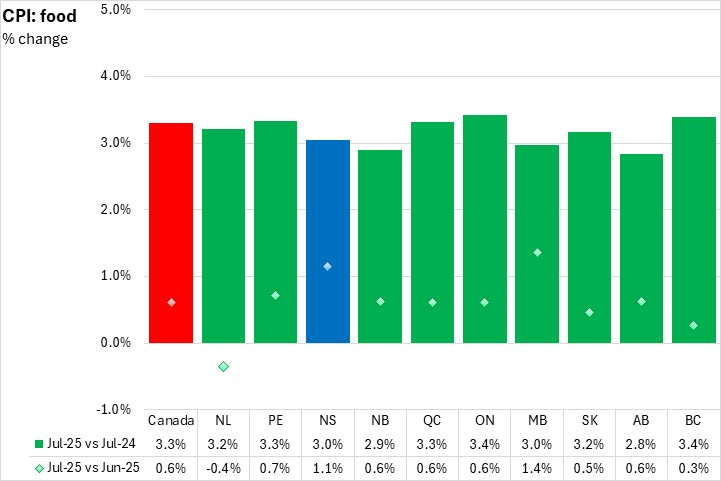
Food prices increased 3.0% in Nova Scotia year-over-year, below the national average food price inflation. National food prices grew 3.3% in July 2025. Food prices were up in every province, led by Ontario.
On a monthly basis, Nova Scotia's food prices increased 1.1% from June to July. National food prices were up 0.6% from June to July. The largest monthly food price increase was in Manitoba and the only decline was in Newfoundland and Labrador.
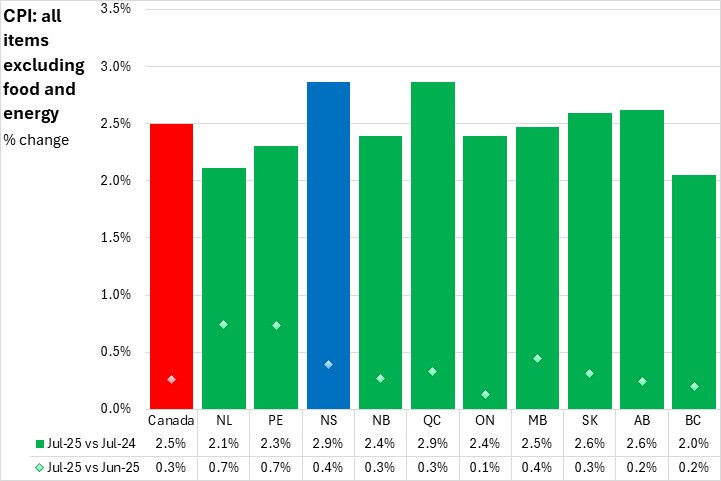
Food and energy prices are heavily influenced by volatile global commodity markets. Nova Scotia's underlying inflation rate excluding food and energy was 2.9% from July 2024 to July 2025, which alongside Québec was the highest rate among provinces. Nationally, inflation excluding food and energy was 2.5% with year-over-year increases in all provinces. British Columbia reported the slowest growth in inflation excluding food and energy prices.
On a monthly basis, Nova Scotia's prices for all items excluding food and energy were up 0.4% from June to July. Nationally, prices for all items excluding food and energy were up 0.3%, with increases in all provinces. Newfoundland and Labrador and Prince Edward Island had the highest monthly rates of inflation for all items excluding food and energy, while Ontario had the lowest.
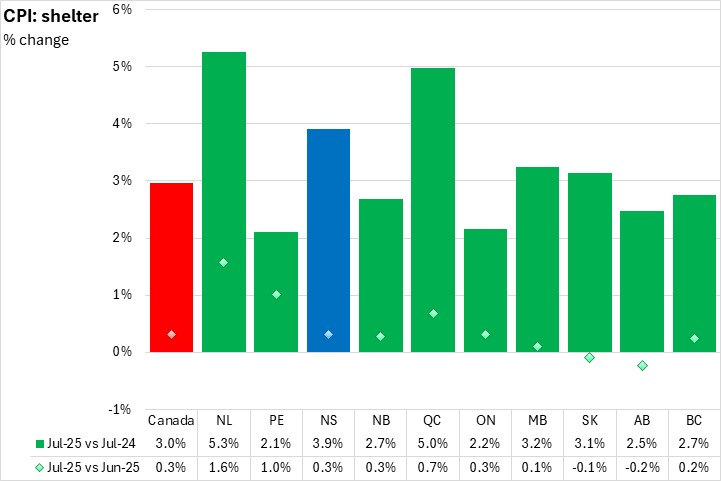
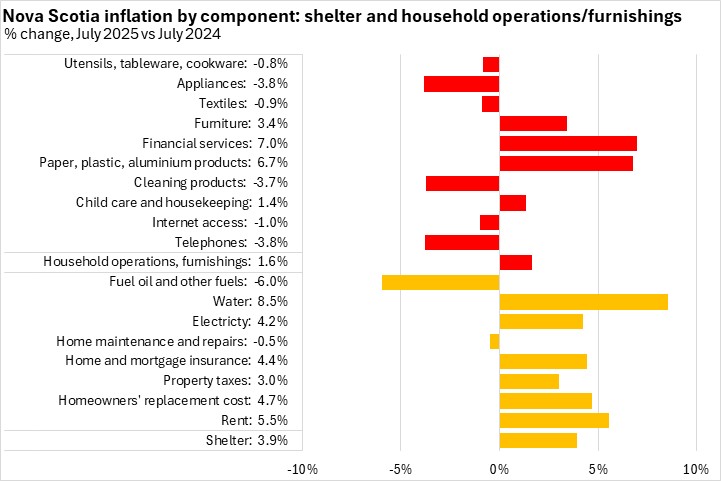
Year-over-year shelter cost inflation was 3.9% in Nova Scotia in July 2025. National shelter prices were up 3.0% with increases in all provinces. Newfoundland and Labrador had the largest increase in shelter prices, while Prince Edward Island reported the slowest increase.
Monthly shelter costs were up 0.3% in Nova Scotia from June to July. Nationally, shelter costs were up 0.3%, with increases in every province except Saskatchewan and Alberta. The largest monthly increase was in Newfoundland and Labrador.
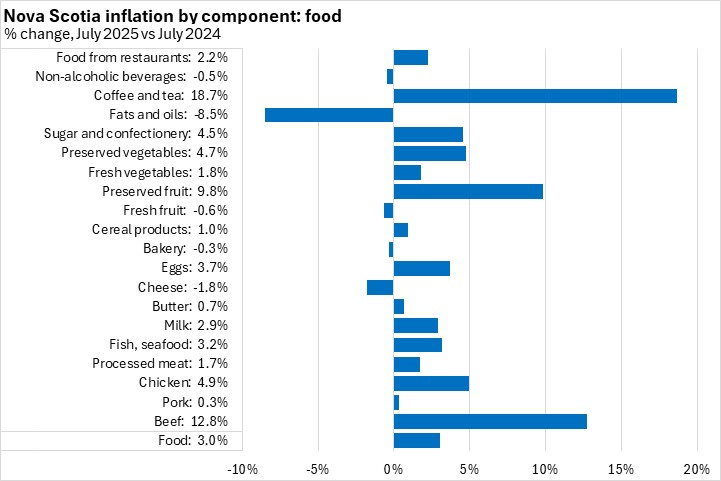
Among detailed food products with available data, Nova Scotia's year-over-year inflation was fastest for coffee/tea, beef, and preserved fruit. The largest year-over-year price declines were for fats/oils and cheese.
In detailed shelter cost components, fuel oil/other fuels and home maintenance/repairs saw the only year-over-year price declines. Prices for all other shelter cost components were up year-over-year, led by water and rent.
Household operations/furnishings costs were up 1.6% overall. The largest year-over-year price increases were for financial services and paper/plastic/aluminum products, while prices fell the most for appliances, telephones, and cleaning products.
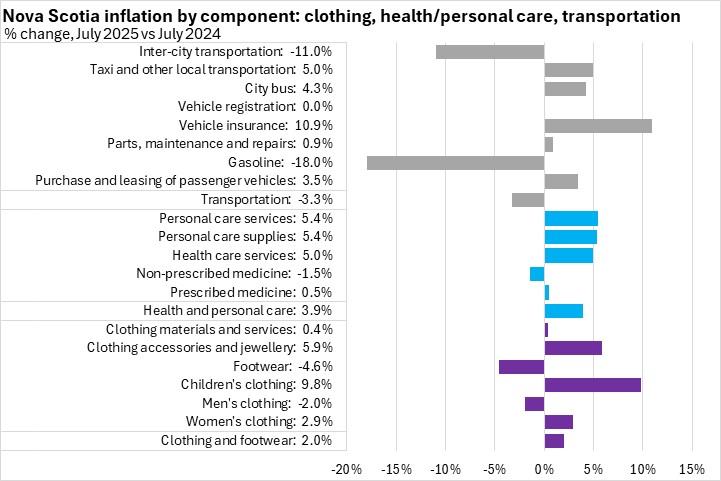
Clothing and footwear prices were up 2.0% year-over-year in July with the fastest price increases in children’s clothing and clothing accessories/jewellery, while the only price declines were in footwear and men's clothing.
Health and personal care costs were up 3.9% year-over-year on gains in all sub-components except non-prescribed medicine. Personal care services and supplies reported the largest price increases.
Overall transportation costs were down 3.3% year-over-year in July. Vehicle insurance had the largest increase while gasoline had the largest decline, with no change in vehicle registration prices.
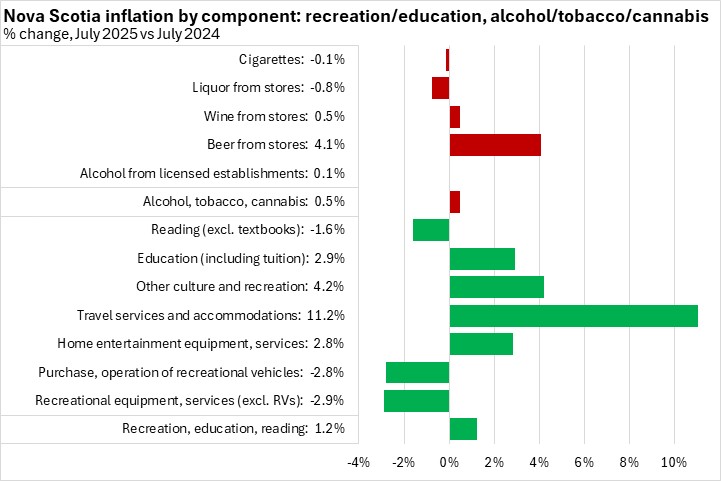
Nova Scotia's overall prices for recreation, education and reading were up 1.2% from July 2024 to July 2025 with the fastest increase for travel services/accommodations, and the fastest declines in recreational equipment/services (excluding RV's) and purchase/operation of recreational vehicles.
Nova Scotia's prices for alcohol, tobacco and recreational cannabis were up 0.5% year-over-year, with increases in all categories except cigarettes and liquor from stores, with the fastest increase in beer from stores.
Trends
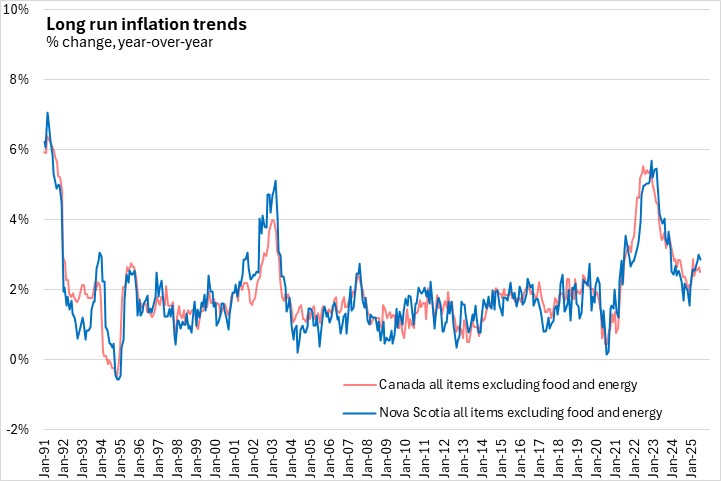
Since the start of the Bank of Canada's inflation-targeting monetary policy regime, inflation for all items has generally been in the 0-4% range. Periods of above target inflation are typically followed by periods of slow price growth or declines. The most recent acceleration in inflation was the strongest since the inflation-targeting era began, though this inflation has receded with tighter monetary policy and lower commodity prices.
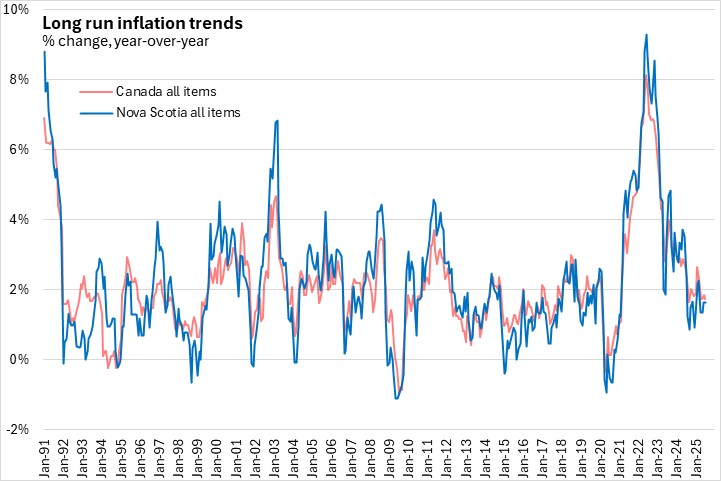
Many of these periods of accelerated and slowed inflation are attributable to volatile commodity prices, especially energy prices. Once the more volatile commodity prices are excluded, inflation in Nova Scotia has largely been below 2% for much of the last 20 years. However, the recent rise in inflation through 2021-2024 spread beyond commodity prices, resulting in the longest period under the Bank of Canada's inflation-targeting regime with Nova Scotia's CPI excluding food and energy above 3%. In July 2025, Nova Scotia's inflation excluding food and energy was 2.9% year-over-year.
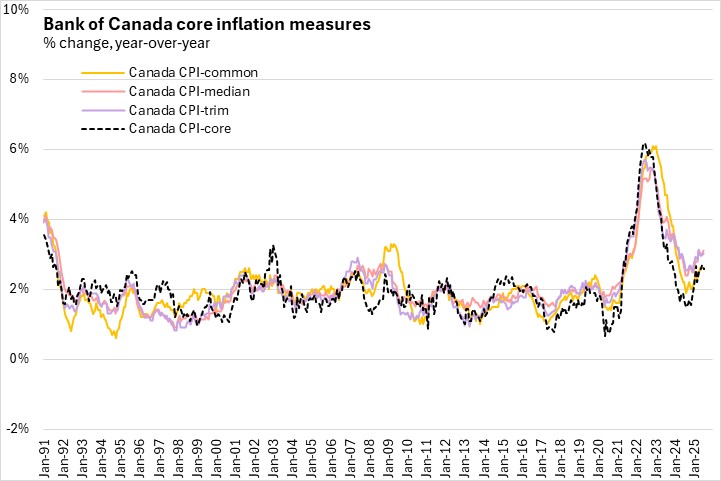
The Bank of Canada examines 'core' measures of inflation that are intended to remove the effects of volatile components and capture underlying inflation trends that are more connected to capacity in the Canadian economy. Core measures of inflation July also indicate where all items inflation is headed.
Canada's core measures of inflation remained mostly at or below the Bank's target of 2% for over a decade prior to 2021. However, core inflation measures rose in 2022, peaking at over 6% for the CPI-common measure before declining around the beginning of 2023. Core measures of inflation have been rising since the end of 2024.
The Bank of Canada's year-over-year core inflation measures in July 2025 were:
- CPI-common: 2.6% (unchanged from the previous month)
- CPI-median: 3.1% (up from 3.0% the previous month)
- CPI-trim: 3.0% (unchanged from the previous month)
The core CPI excluding volatile products and the effects of indirect taxes was up 2.6% (down 0.1% from the previous month).
Source: Statistics Canada. Table 18-10-0004-01 Consumer Price Index, monthly, not seasonally adjusted; Table 18-10-0256-01 Consumer Price Index (CPI) statistics, measures of core inflation and other related statistics - Bank of Canada definitions
<--- Return to Archive