The Economics and Statistics Division maintains archives of previous publications for accountability purposes, but makes no updates to keep these documents current with the latest data revisions from Statistics Canada. As a result, information in older documents may not be accurate. Please exercise caution when referring to older documents. For the latest information and historical data, please contact the individual listed to the right.
<--- Return to Archive
For additional information relating to this article, please contact:
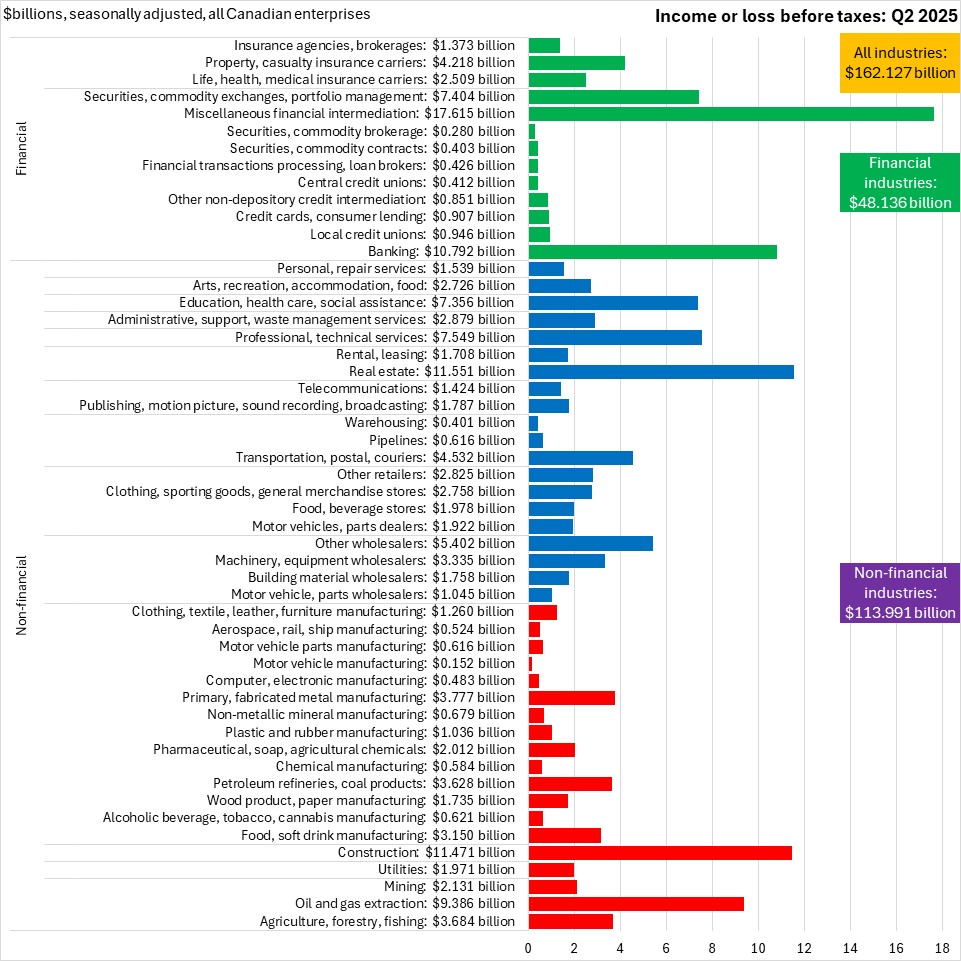
August 25, 2025CANADA FINANCIAL STATISTICS FOR ENTERPRISES, Q2 2025 In Q2 2025, Canadian enterprise net income before taxes (seasonally adjusted) was $162.127 billion. All broad industry categories reported positive income before taxes in Q2 2025. The largest values of net income before taxes were reported in miscellaneous financial intermediation ($17.615 billion), real estate ($11.551 billion), construction ($11.471 billion), banking ($10.792 billion), and oil/gas extraction ($9.386 billion).
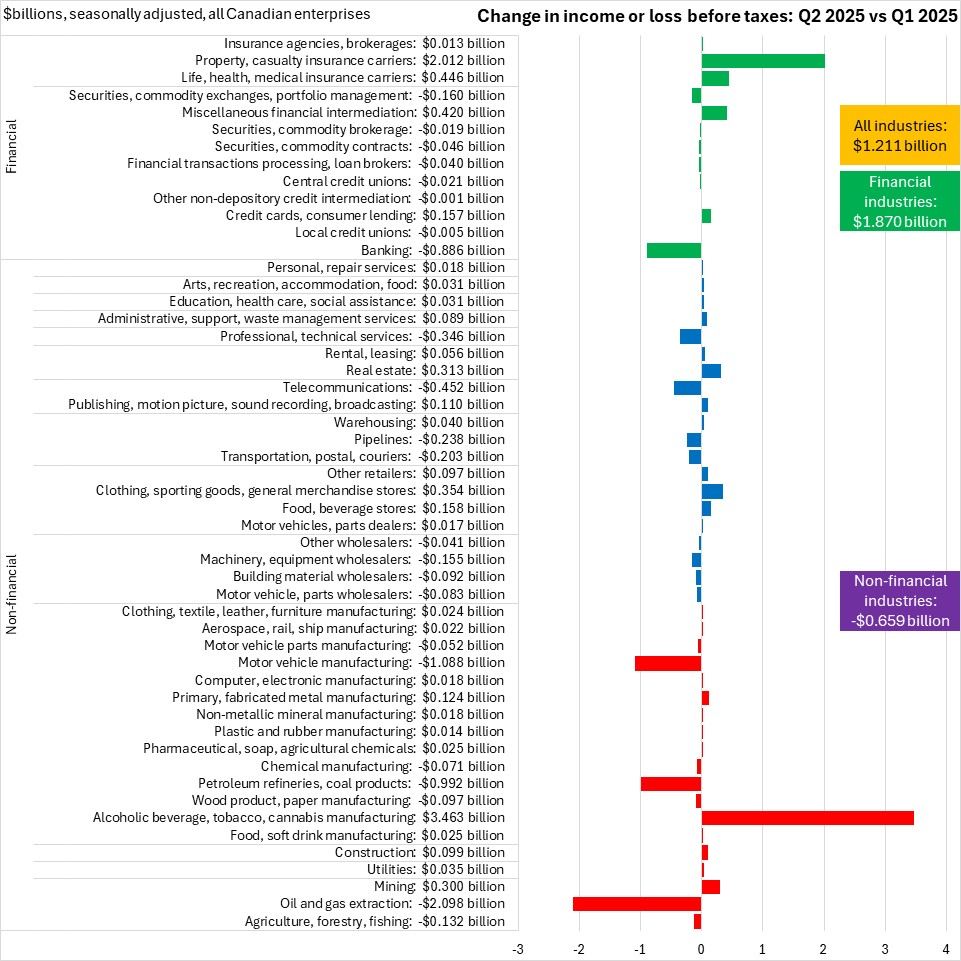
Compared with Q1 2025, net income before taxes rose by $1.211 billion across all industries. Net income increased by $1.870 billion for financial/insurance industries largely on gains in property/casualty and life/medical/health insurance carriers, and miscellaneous financial intermediation. Banking reported the largest drop in net income before taxes among financial industries.
Net income for non-financial industries fell by $0.659 billion. Alcoholic beverage/tobacco/cannabis manufacturing reported the largest increase, recovering from one-time expenses associated with legal settlements incurred in Q1 2025. Motor vehicle manufacturing, petroleum refineries/coal products and oil/gas extraction reported the largest declines in non-financial net income. Statistics Canada notes that profits for petroleum refineries/coal products and oil/gas extraction were affected by lower oil prices and production shutdowns.
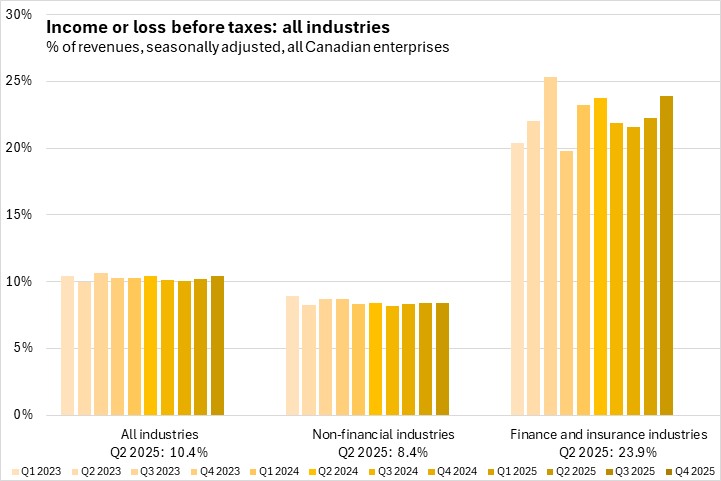
Measured as a share of revenue, income before taxes averaged 10.4% across all industries; 23.9% for financial industries and 8.4% for non-financial industries. Income as a share of revenues was little changed for non-financial industries and up for financial industries.
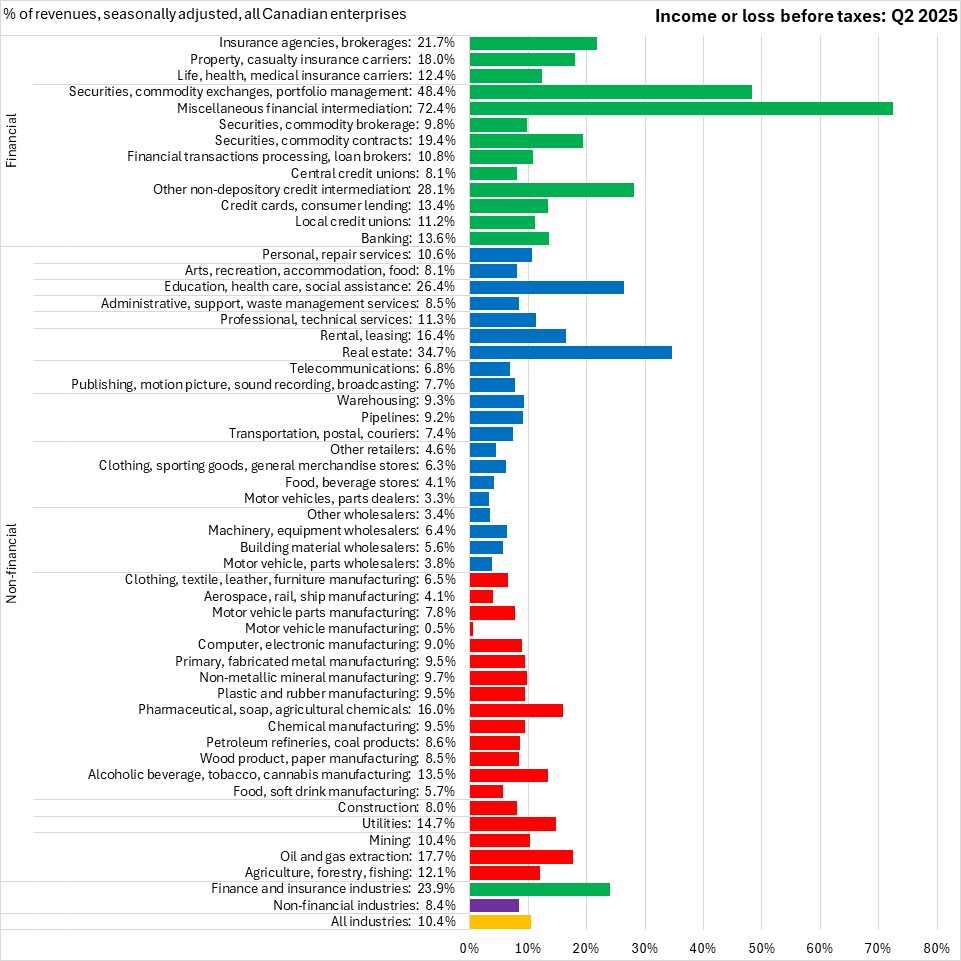
Measured as a share of revenue, income before taxes was highest in miscellaneous financial intermediation (72.4% of revenues), followed by securities/exchanges/portfolio management (48.4%) and other non-depository credit intermediation (28.1%). Outside of financial industries, income before taxes as a share of revenue was highest in: real estate (34.7%), education/health/social assistance (26.4%, including daycares), oil/gas extraction (17.7%) and rentals/leasing (16.4%).
Source: Statistics Canada. Table 33-10-0226-01 Quarterly balance sheet and income statement, by industry, seasonally adjusted (x 1,000,000)
<--- Return to Archive