The Economics and Statistics Division maintains archives of previous publications for accountability purposes, but makes no updates to keep these documents current with the latest data revisions from Statistics Canada. As a result, information in older documents may not be accurate. Please exercise caution when referring to older documents. For the latest information and historical data, please contact the individual listed to the right.
<--- Return to Archive
For additional information relating to this article, please contact:
December 11, 2025GREENHOUSE GAS EMISSIONS, 2023 Statistics Canada has published revised figures for emissions of greenhouse gases. The data are presented in two ways: those consistent with Statistics Canada's physical flow accounts and those consistent with the National Inventory Report on Greenhouse Gas Sources and Sinks (which fulfills reporting obligations under the United Nations Framework Convention on Climate Change or UNFCCC). These results are not identical. The analysis below reports emissions per the UNFCCC measures.
2023
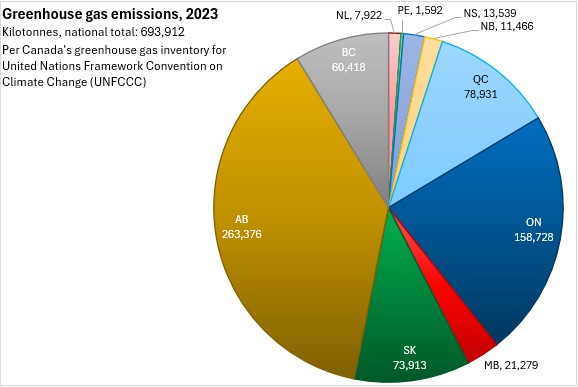
In 2023, Nova Scotia emitted 13,539 kilotonnes of greenhouse gas emissions, which was 2.0% of the national total of 693,912 kilotonnes. Alberta produced the largest amount of Canada's greenhouse gas emissions at 263,376 kilotonnes (38.0%). Ontario had the second highest emissions at 158,728 kilotonnes or 22.9% of the national total.
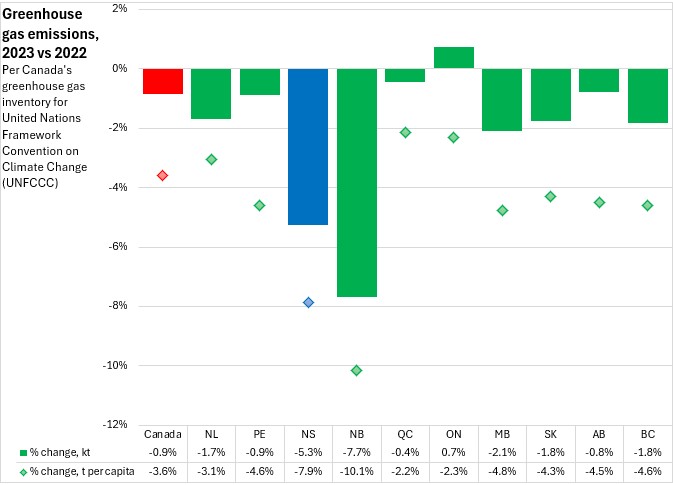
In the last year, Nova Scotia's greenhouse gas emissions decreased by 5.3%. National emissions were down by 0.9% with decreases in all provinces except Ontario. New Brunswick reported the largest drop in greenhouse gas emissions in 2023.
Nova Scotia's population continued to grow as emissions fell, and Nova Scotia's greenhouse gas emissions per capita declined by 7.9% in 2023. Nationally, per capita emissions were down 3.6% with declines in all provinces (led by New Brunswick).
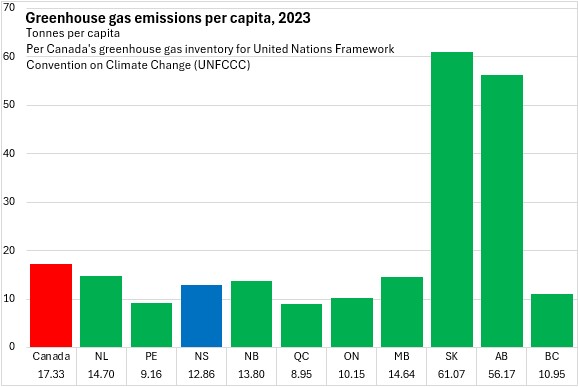
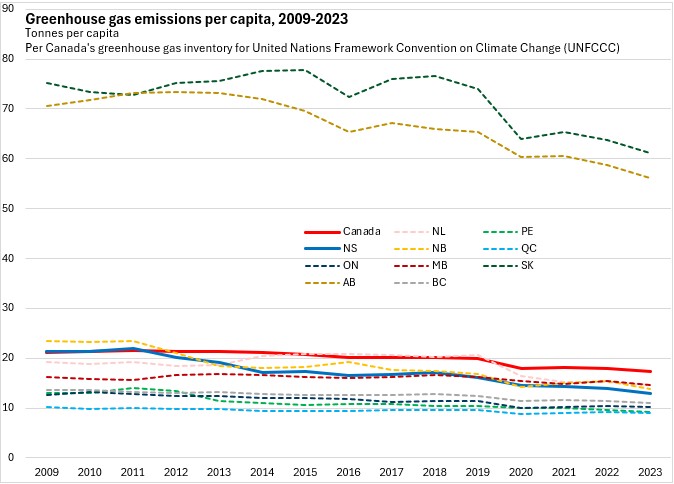
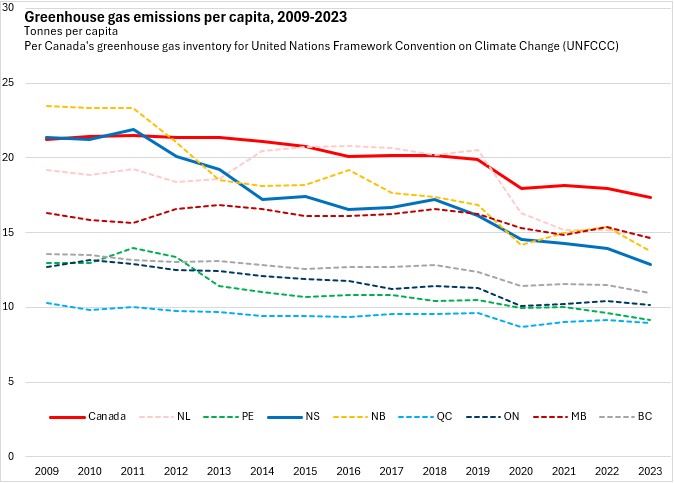
Nova Scotia's greenhouse gas emissions amounted to 12.86 tonnes per capita, below the national average of 17.33 tonnes per capita. Saskatchewan and Alberta had the highest per capita greenhouse gas emissions (by multiples of the next highest per capita emitters). Québec and Prince Edward Island had the lowest per capita emissions of greenhouse gases in 2023.
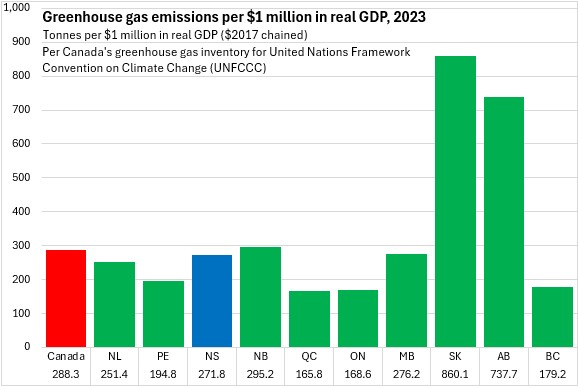
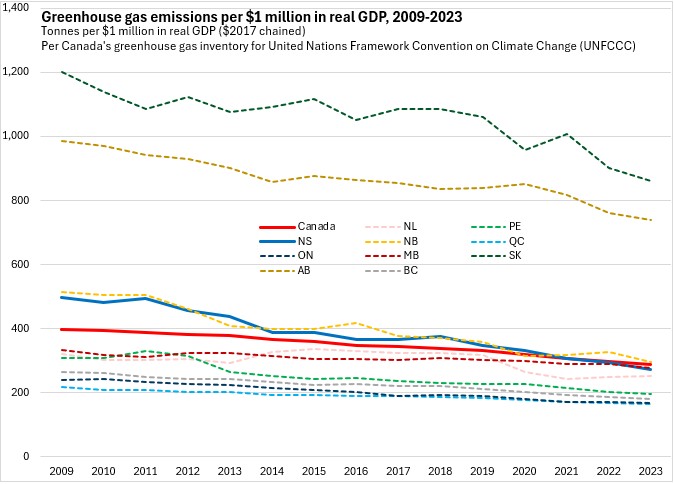
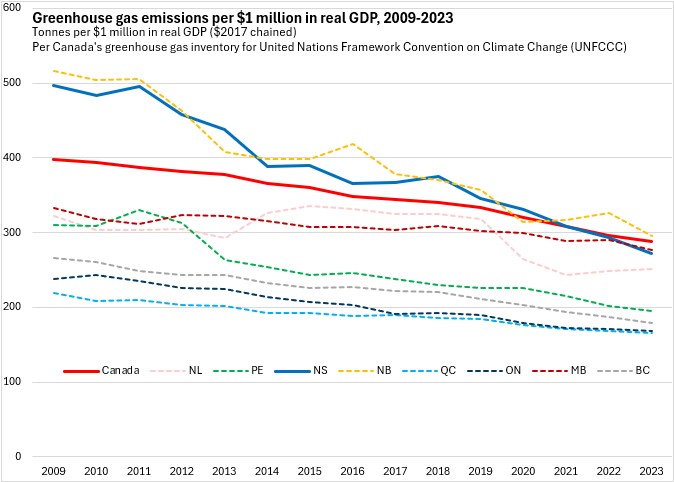
Emissions of greenhouse gases are typically associated with energy production and consumption that are significant parts of economic output. Nova Scotia's greenhouse gas emissions amounted to about 271.8 tonnes per million dollars of real GDP in 2023. This was below the national average emissions intensity of 288.3 tonnes per million dollars of real GDP. Saskatchewan and Alberta had the most emissions-intensive economies among provinces, with over twice the emissions per million dollars of real GDP of the third most emissions-intensive provincial economy (New Brunswick). The economies of Québec and Ontario had the least emissions per million dollars of real GDP.
Trends
Nova Scotia's greenhouse gas emissions declined by 6,498 kiltoonnes from 2009 to 2023. The sharpest period of declining greenhouse gas emissions in Nova Scotia was from 2011 to 2016.
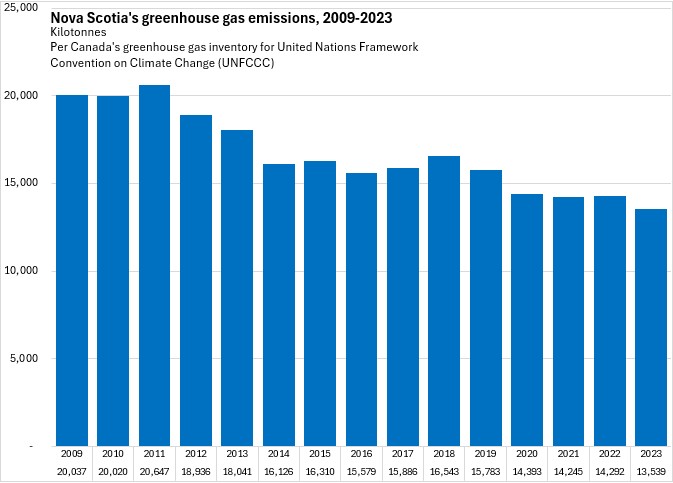
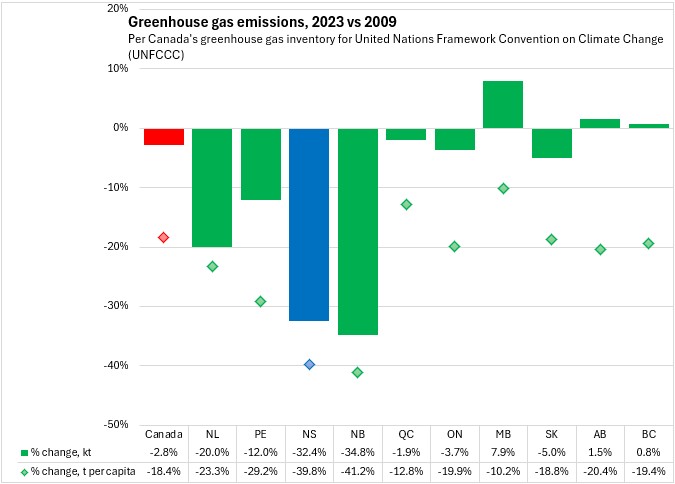
Over the period 2009 to 2023, Nova Scotia's greenhouse gas emissions fell by 32.4%, the second steepest decline after New Brunswick. Nationally, greenhouse gas emissions fell by just 2.8% with declines in all provinces except Manitoba, Alberta and British Columbia.
On a per capita basis, Nova Scotia's greenhouse gas emissions have fallen by 39.8% since 2009. Only New Brunswick reported a steeper per capita emissions drop. Nationally, per capita emissions were down 18.4% from 2009 to 2023 with declines across all provinces.
Despite per capita declines, Alberta and Saskatchewan still report consistently higher per capita emissions than any other province.
Likewise, Alberta and Saskatchewan consistently report greater emissions intensity in their economies (measured as emissions per million dollars in real GDP).
Source: Statistics Canada. Table 38-10-0097-01 Physical flow account for greenhouse gas emissions; Table 36-10-0222-01 Gross domestic product, expenditure-based, provincial and territorial, annual (x 1,000,000); Table 17-10-0005-01 Population estimates on July 1, by age and gender
<--- Return to Archive