The Economics and Statistics Division maintains archives of previous publications for accountability purposes, but makes no updates to keep these documents current with the latest data revisions from Statistics Canada. As a result, information in older documents may not be accurate. Please exercise caution when referring to older documents. For the latest information and historical data, please contact the individual listed to the right.
<--- Return to Archive
For additional information relating to this article, please contact:
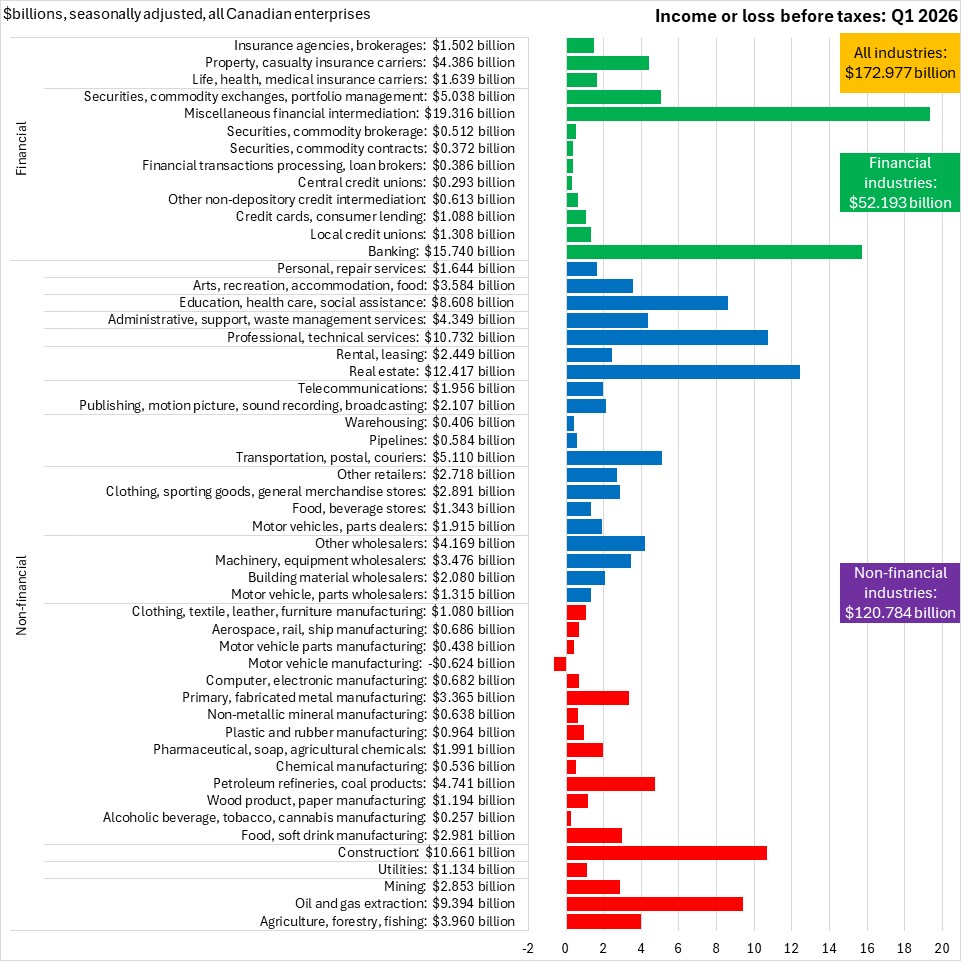
May 25, 2026CANADA FINANCIAL STATISTICS FOR ENTERPRISES, Q1 2026 In Q1 2026, Canadian enterprise net income before taxes (seasonally adjusted) was $172.977 billion. All broad industry categories reported positive income before taxes in Q1 2026, with the exception of motor vehicle manufacturing. The largest values of net income before taxes were reported in miscellaneous financial intermediation ($19.316 billion), banking ($15.740), and real estate ($12.417 billion).
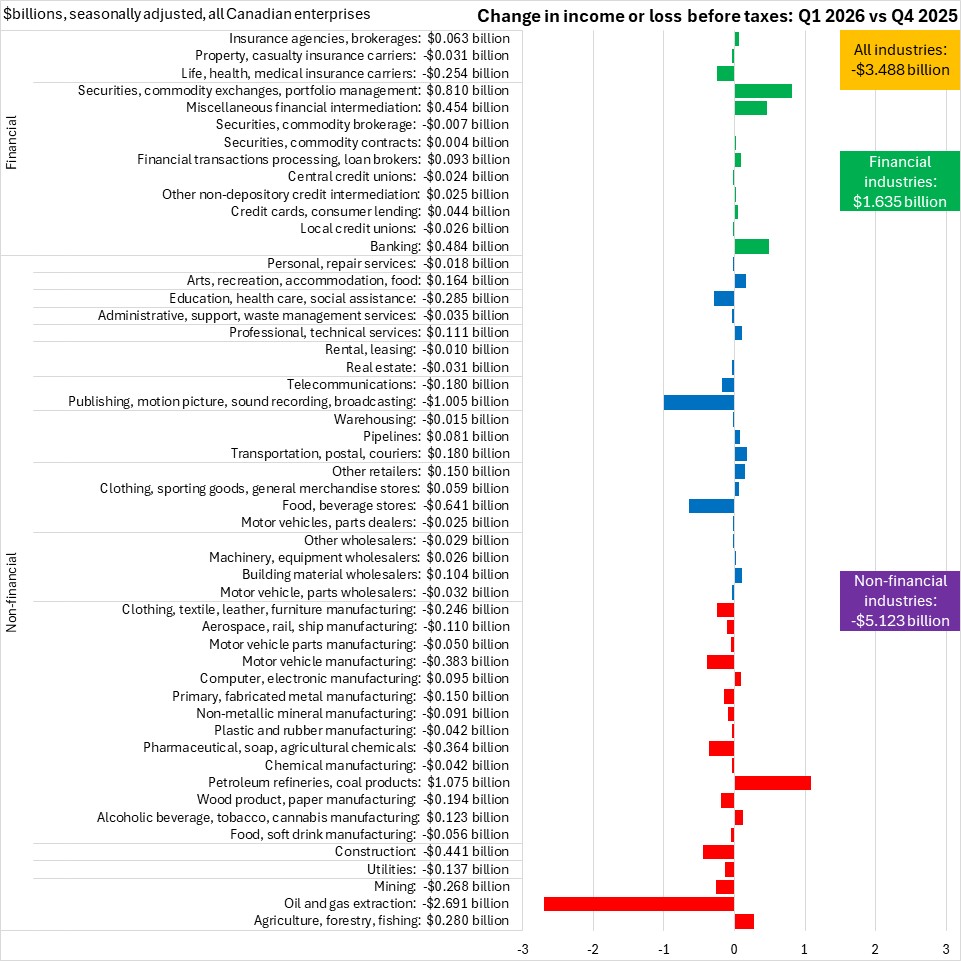
Compared with Q4 2025, net income before taxes fell by $3.488 billion across all industries. Net income rose by $1.635 billion for financial/insurance industries, with the largest gain in securities/commodity exchanges/portfolio management, and the largest decline in life/health/medical insurance carriers.
Net income for non-financial industries fell by $5.123 billion, the majority of which was attributable to a $2.691 billion decline in oil and gas extraction. The largest gain in net-income for non-financial industries was in petroleum refineries/coal products.
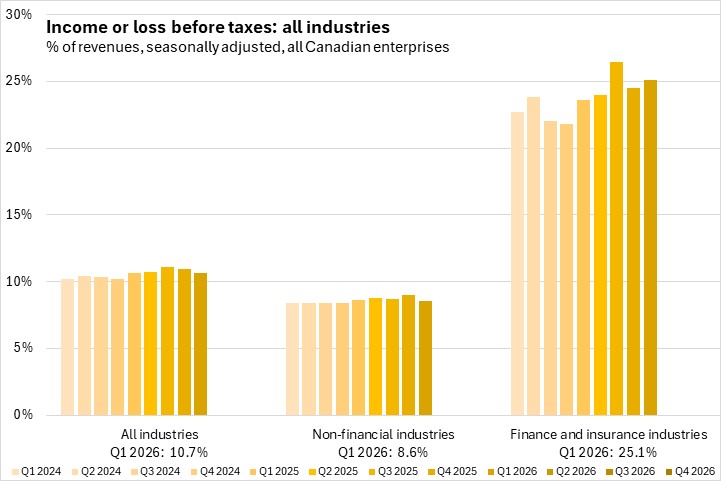
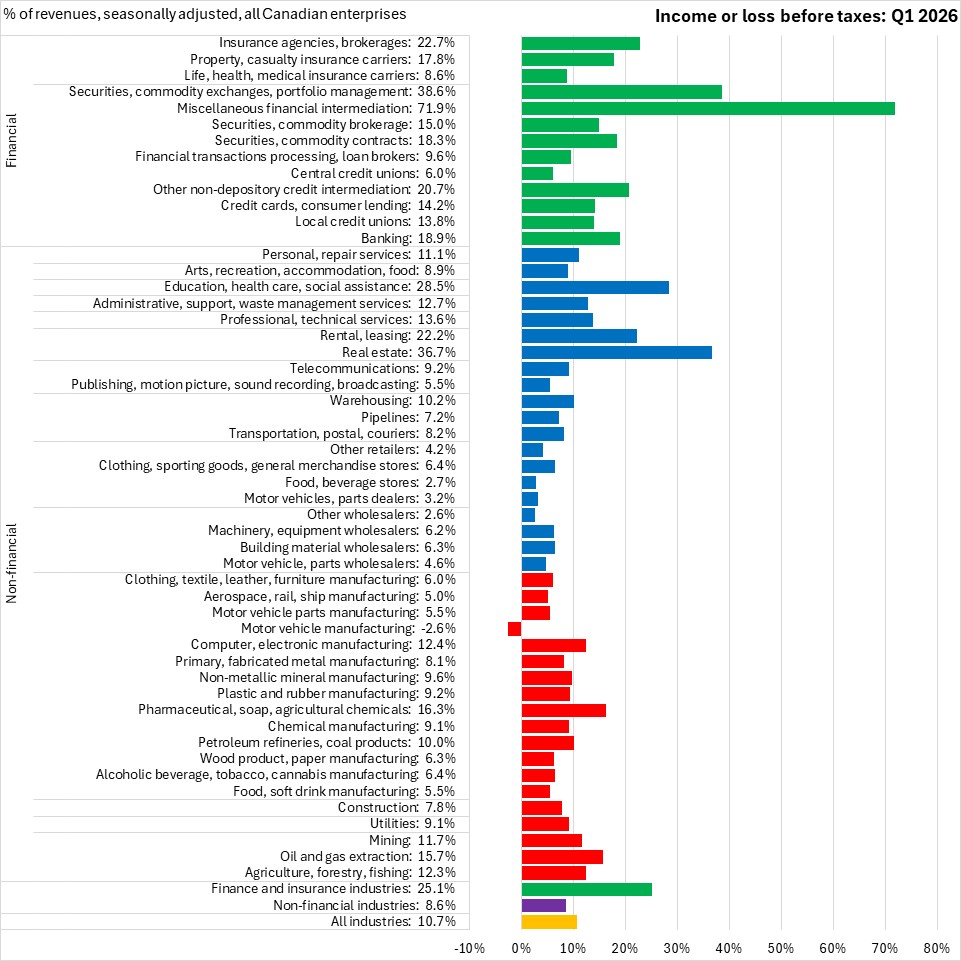
Measured as a share of revenue, income before taxes averaged 10.7% across all industries; 25.1% for financial industries and 8.6% for non-financial industries. Income as a share of revenues was down for non-financial industries and up for financial industries in Q1 2026.
Measured as a share of revenue, income before taxes was highest in miscellaneous financial intermediation (71.9% of revenues), followed by securities/commodity exchanges/portfolio management (38.6%), and real estate (36.7%).
Source: Statistics Canada. Table 33-10-0226-01 Quarterly balance sheet and income statement, by industry, seasonally adjusted (x 1,000,000)
<--- Return to Archive