The Economics and Statistics Division maintains archives of previous publications for accountability purposes, but makes no updates to keep these documents current with the latest data revisions from Statistics Canada. As a result, information in older documents may not be accurate. Please exercise caution when referring to older documents. For the latest information and historical data, please contact the individual listed to the right.
<--- Return to Archive
For additional information relating to this article, please contact:
July 15, 2026MANUFACTURING SHIPMENTS, MAY 2026 Monthly (seasonally adjusted, May 2026 vs April 2026)
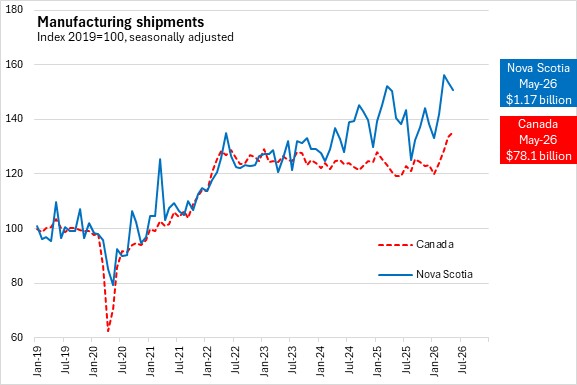
Nova Scotia's manufacturing shipments decreased 2.0% to $1.17 billion. National shipments rose 1.3% to $78.1 billion.
Manufacturing shipments were up in six provinces, led by Saskatchewan and Newfoundland and Labrador. Prince Edward Island reported the fastest decline.
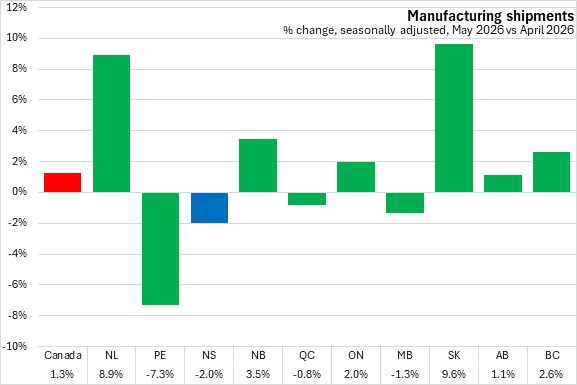
Note: Disruptions in global oil markets have elevated petroleum product prices causing significant volatility in the value of refined petroleum shipments.
Year-over-year (May 2026 vs May 2025)
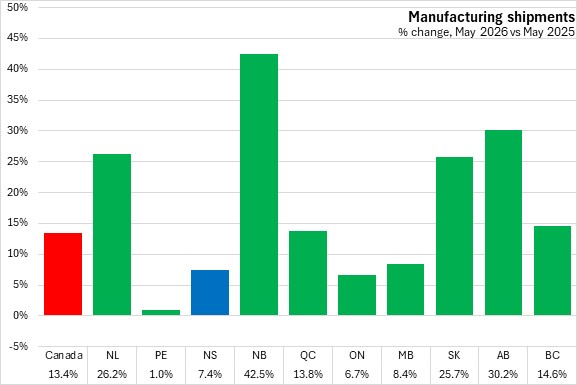
Nova Scotia's manufacturing shipments increased by 7.4% year-over-year. Nationally, manufacturing shipments grew 13.4% with all provinces reporting gains, led by New Brunswick.
Year-to-date (January-May 2026 vs January-May 2025)
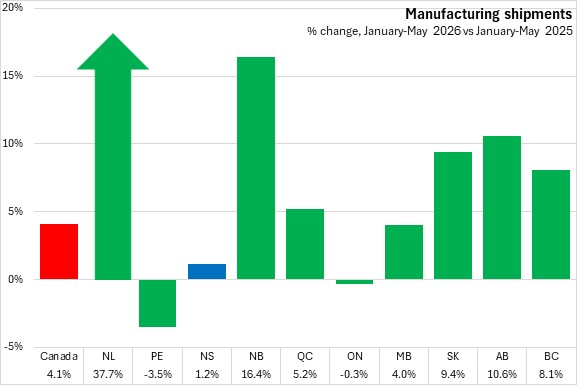
Nova Scotia's manufacturing shipments grew 1.2% in January-May 2026 compared to the same period in 2025. National shipments increased 4.1%. Eight provinces reported year-to-date increases, with the fastest rise in Newfoundland and Labrador, followed by New Brunswick. The fastest decline was reported in Prince Edward Island.
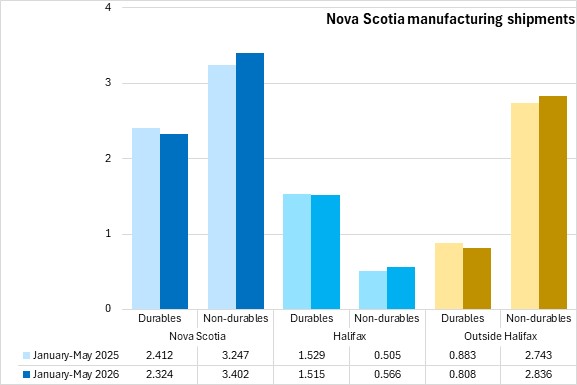
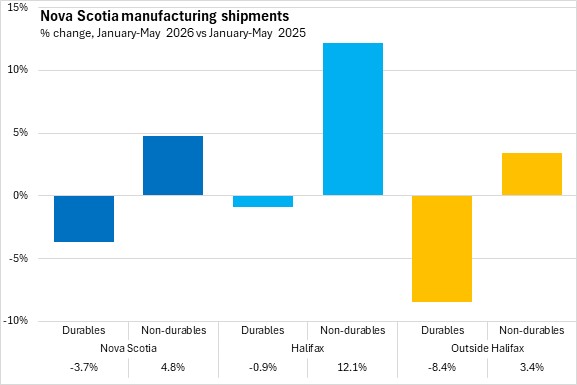
Across the province, durable shipments were down while non-durable shipments rose in January-May 2026 compared with the same period in 2025. Durable goods shipments from Halifax account for nearly two-thirds of the province's durables output. The majority of Nova Scotia's non-durable manufacturing shipments come from outside the city.
Trends
Nova Scotia's shipments values have exhibited greater volatility than national shipment in the last two years. National shipments have trended down for several years. Recent months have shown an improving trend both in Nova Scotia and nationally.
Statistics Canada. Table 16-10-0047-01 Manufacturers' sales, inventories, orders and inventory to sales ratios, by industry (dollars unless otherwise noted); Table 16-10-0048-01 Manufacturing sales by industry and province, monthly (dollars unless otherwise noted) (x 1,000); Table 16-10-0011-01 Manufacturing sales, by industry for 12 Selected Census Metropolitan Areas (x 1,000)
<--- Return to Archive


