The Economics and Statistics Division maintains archives of previous publications for accountability purposes, but makes no updates to keep these documents current with the latest data revisions from Statistics Canada. As a result, information in older documents may not be accurate. Please exercise caution when referring to older documents. For the latest information and historical data, please contact the individual listed to the right.
<--- Return to Archive
For additional information relating to this article, please contact:
August 28, 2026NON-RESIDENTIAL CAPITAL STOCK AND INVESTMENT, Q2 2026 Year-over-year (Q2 2026 vs Q2 2025)
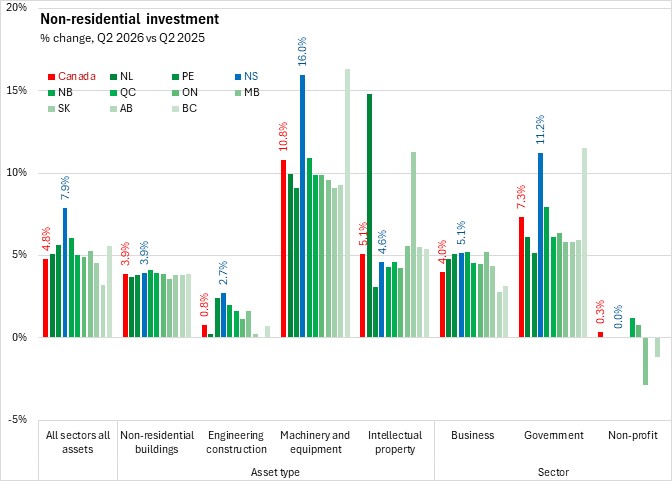
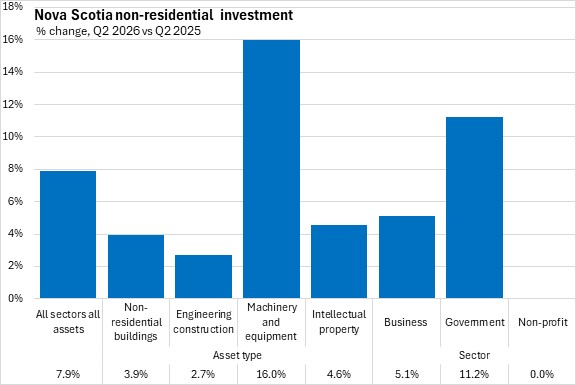
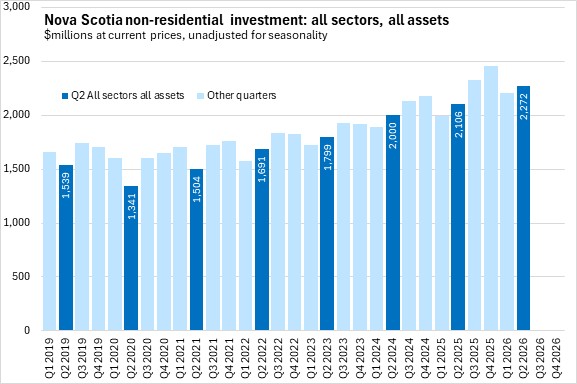
Nova Scotia non-residential investment (all sectors, all assets, current prices) rose by 7.9% from Q2 2025 to Q2 2026, leading all provinces in investment growth following growth of 10.5% in the previous quarter. Nationally non-residential investment was up 4.8% with gains in all provinces. The slowest growth in investment was reported in Alberta.
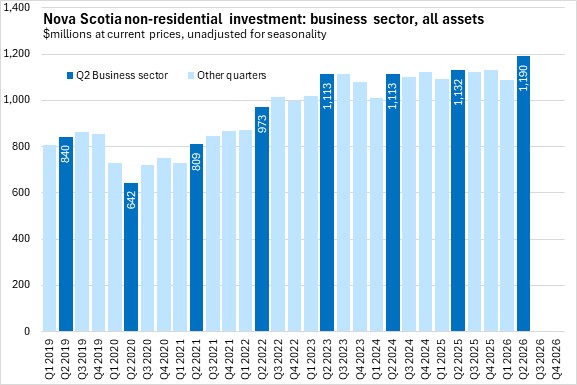
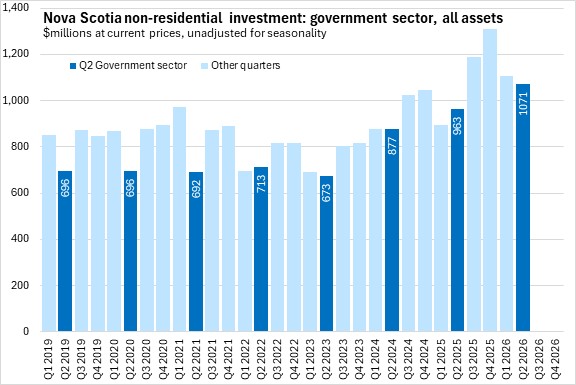
Nova Scotia's non-residential investment growth outpaced the national average for all asset types except intellectual property. Business sector capital investment was up 5.1% in Q2, tied for third fastest among provinces after declining in Q1. Government sector capital investment in Nova Scotia was up 11.2% - the fastest growth among provinces.
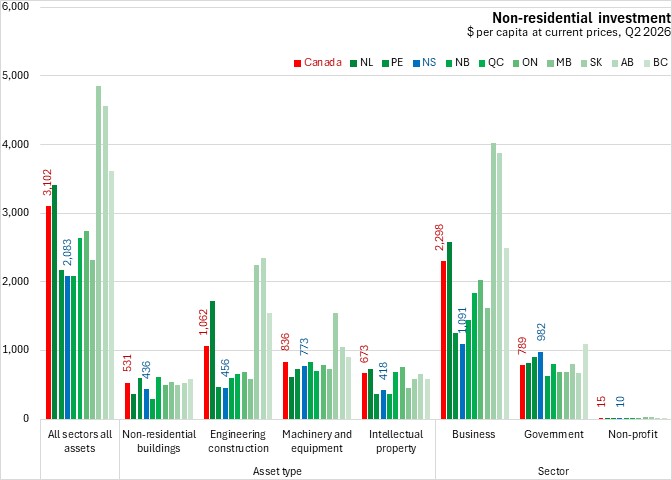
On a per capita basis, Nova Scotia's investment in non-residential assets amounted to $2,083 or 67.1% of the national per capita value. Nova Scotia's per capita investments were stronger than the national average for the government sector due to strength in government machinery and equipment. On average, investment per capita in all asset categories was lower than the national average.
Nova Scotia's per capita business investment was $1,091 per capita or 47.5% of the national per capita average. Business investment (notably for engineering construction) was substantially higher in Newfoundland and Labrador as well as in the three westernmost provinces.
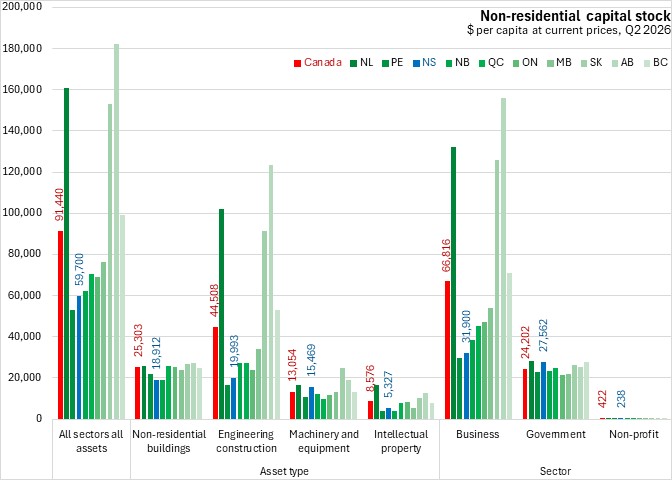
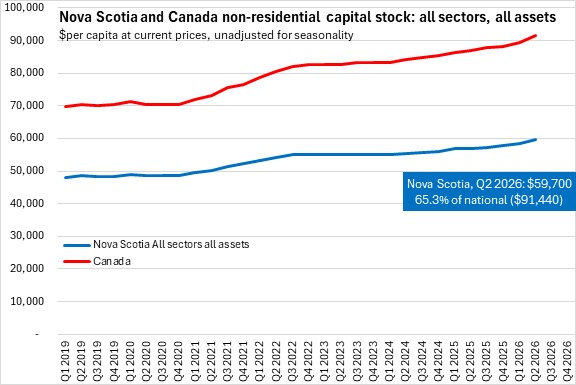
Nova Scotia's net capital stock (based on geometric depreciation) was $59,700 per capita as of Q2 2026. This was 65.3% of the national per capita capital stock. Capital stock per capita was notably higher for Canada's major natural resource regions: Newfoundland and Labrador, Saskatchewan and Alberta.
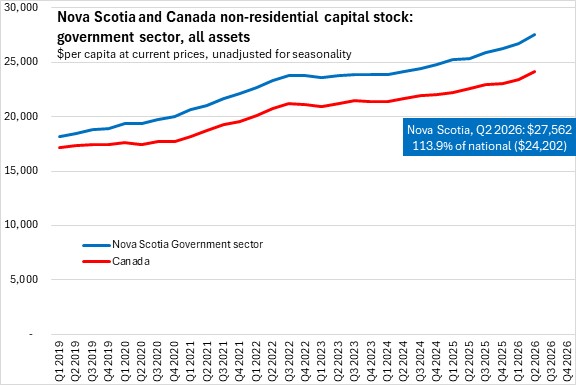
Nova Scotia's $27,562 capital stock per capita in the government sector (including military hardware) was substantially higher than the national average of $24,202 per capita.
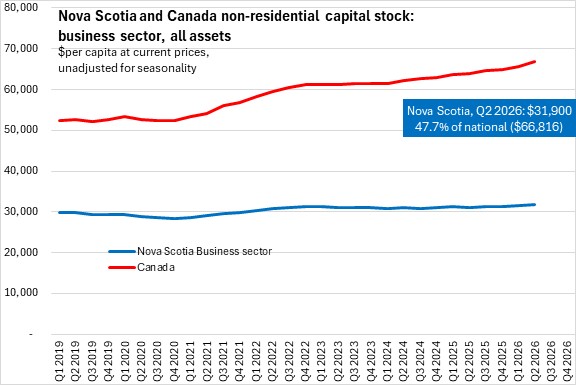
Nova Scotia's business sector capital stock was $31,900 per capita - second lowest among provinces and 47.7% of the national average of $66,816 per capita.
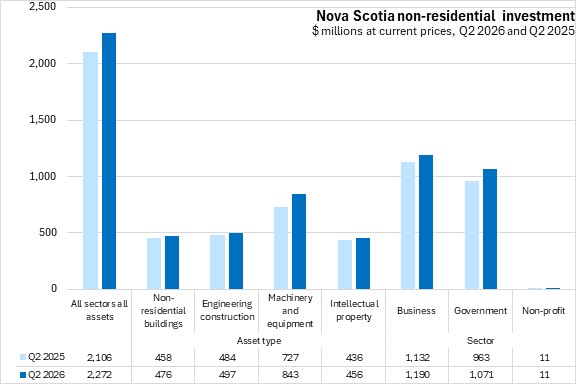
Compared to Q2 2025, Nova Scotia's investment levels increased for all major asset categories. Investment levels for business and government were up, while non-profit was unchanged.
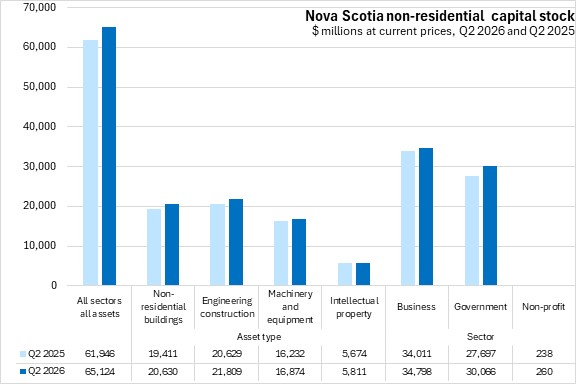
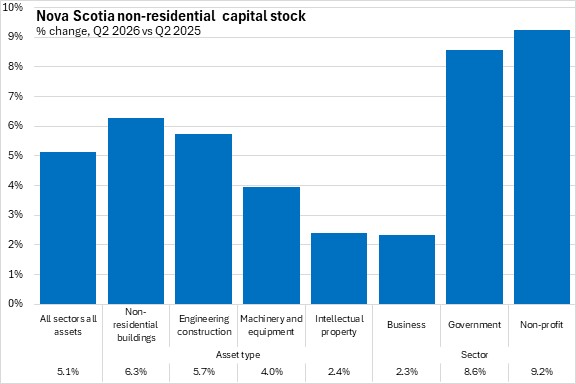
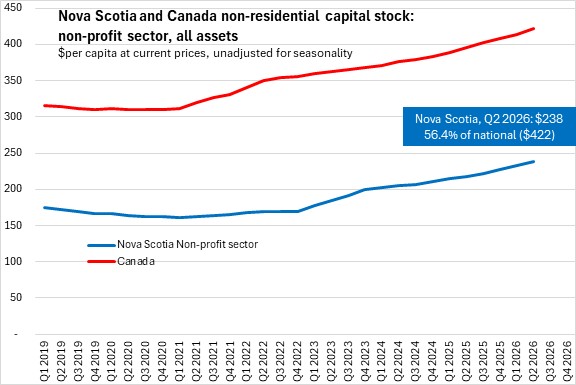
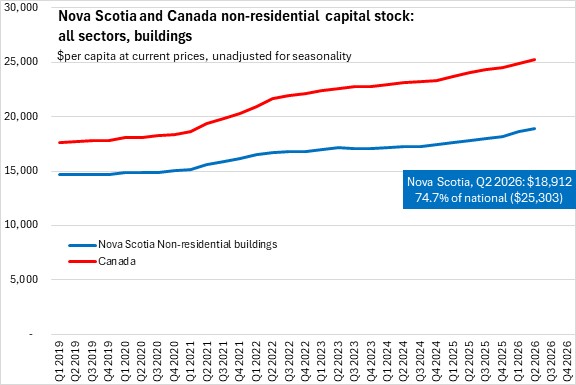
Net capital stock in Nova Scotia increased for all major asset types and for all three sectors. Government capital stock and non-residential buildings stock reported the fastest increases. The non-profit sector also reported a notable increase, but this is a very small share of Nova Scotia's capital stock.
Year-to-date (Q1-Q2 2026 vs Q1-Q2 2025)
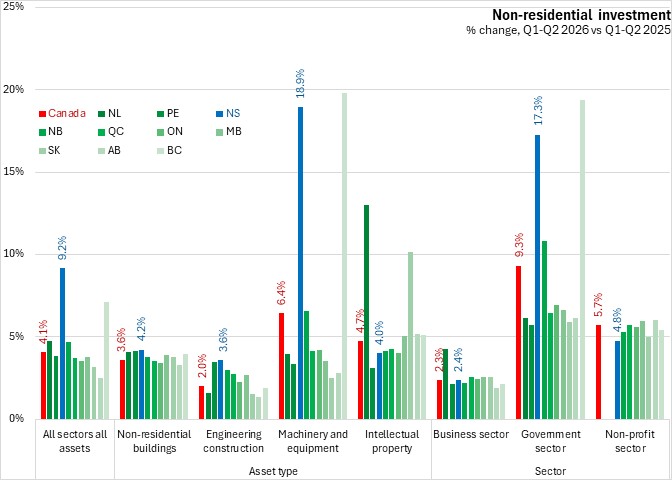
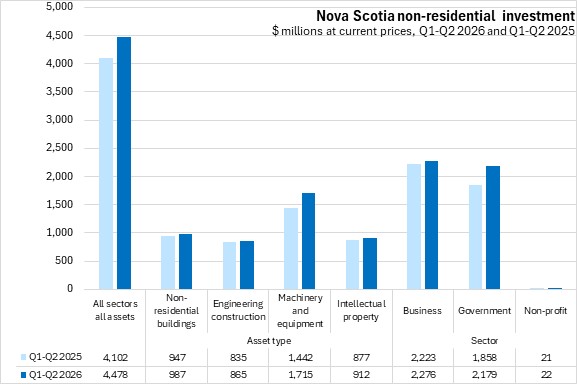
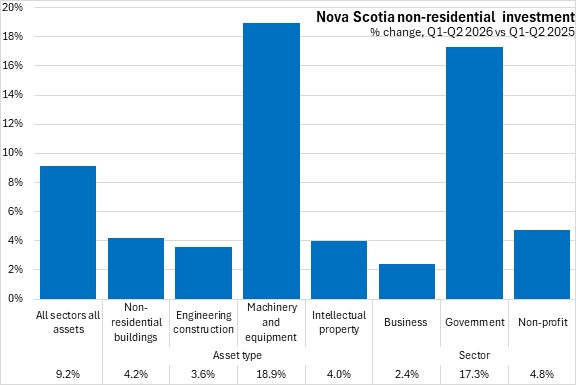
Comparing the first two quarters of 2026 with the same period in 2025, Nova Scotia's non-residential capital investment was up 9.2% - the strongest growth among provinces. National investment levels were up 4.1% year-to-date with the strongest growth in Nova Scotia followed by British Columbia. Alberta reported the slowest growth.
Nova Scotia's year-to-date non-residential investment growth outpaced the national averages for all asset categories except intellectual property, led by machinery and equipment.
Nova Scotia's year-to-date business investment was up 2.4%, outpacing the national average gain of 2.3%.
Nova Scotia's investment in government sector assets was up 17.3%, outpacing national government sector investment growth of 9.3%.
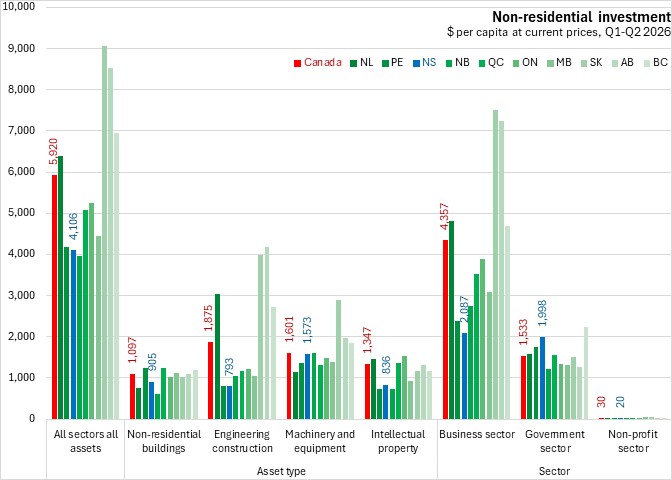
On a per capita basis, Nova Scotia's year-to-date non-residential investments were $4,106 or 69.4% of the national average. Although Nova Scotia had the highest per capita non-residential investments from the government sector ($1,998), it had the lowest levels of per capita non-residential investment from the business sector ($2,087).
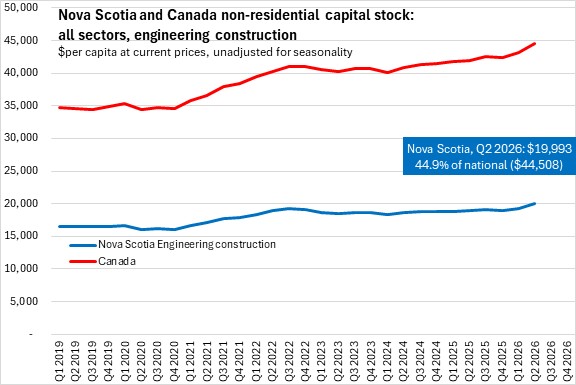
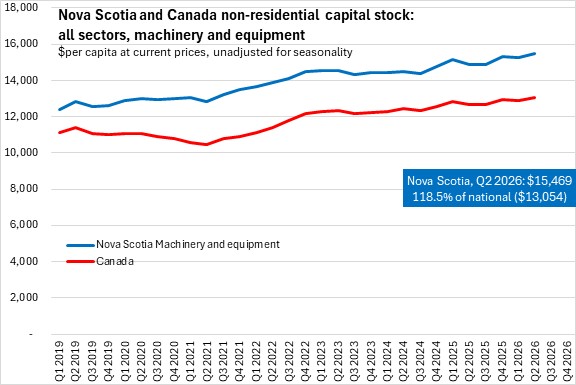
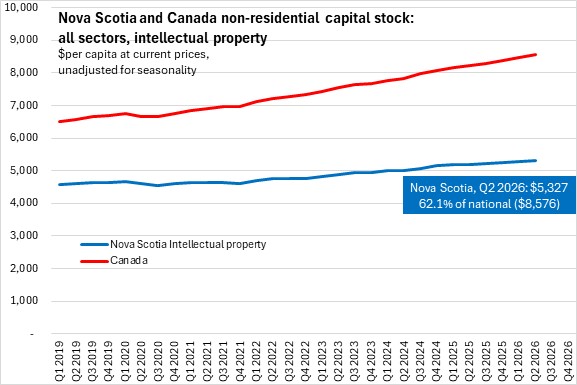
Nova Scotia's year-to-date investments in machinery/equipment (including military hardware in the government sector) were $1,573 per capita, just below the national average of $1,601. Per capita investments in non-residential buildings ($905, third lowest among provinces), engineering construction ($793, lowest among provinces) and intellectual property ($836. third lowest among provinces) were all well below national averages.
Nova Scotia's year-to-date non-residential investment reflects growth in all asset categories and sectors, led by government and machinery and equipment (in percentage terms).
Trends
Nova Scotia's non-residential investment has generally trended up on a year-over-year basis since 2022.
Business sector non-residential investment trended downward to 2021, before trending upwards over 2021-2023. Business sector investment exhibited slower growth in 2024 and 2025. Results for Q2 2026 reflect the strongest quarterly result for business sector non-residential investment in this data series.
Government sector investment trended upwards from 2019 to 2021. Slowing investment in 2022 and 2023 was followed by a notable acceleration in the second half of 2024. Results for government investment in Q2 2026 put government investment at its highest level to date in any prior comparable period.
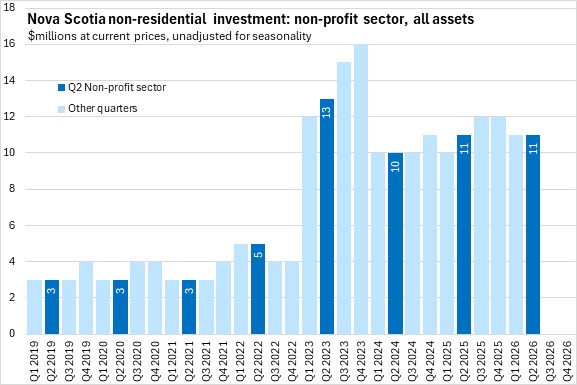
Non-profit institutions serving households have much lower investment levels than business or government sectors. Investment levels have been relatively stable in recent years.
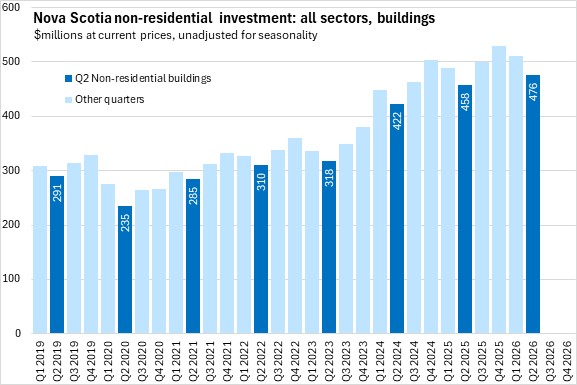
Nova Scotia's investment in non-residential buildings have grown steadily since 2020.
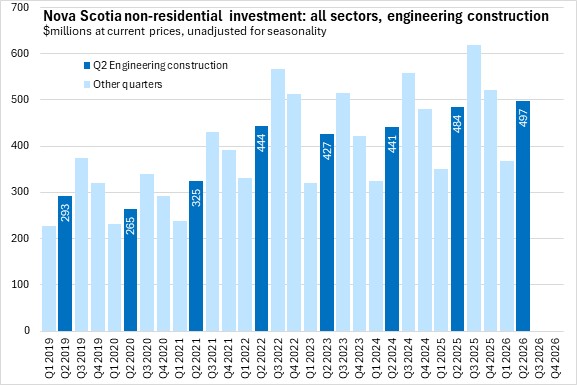
Nova Scotia's investment in engineering construction assets trended up prior to 2022, after which investment has grown at a slower pace.
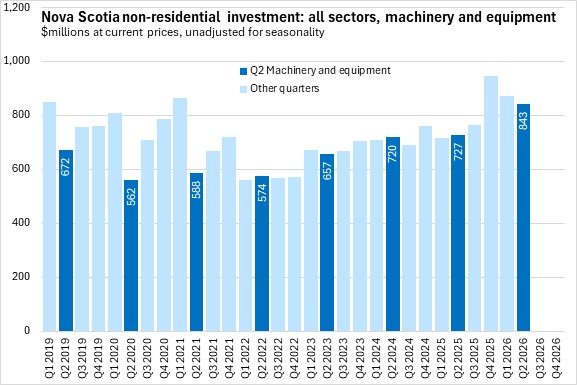
Nova Scotia's investments in machinery and equipment assets have been rising since 2022.
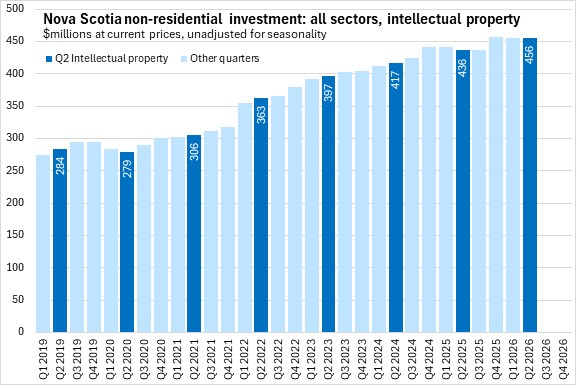
Nova Scotia's investments in intellectual property products have mostly trended up since 2019.
Nova Scotia's non-residential capital stock per capita has grown more quickly since 2020.
However, national non-residential capital stock per capita has grown faster than Nova Scotia's. This is particularly the case for business sector non-residential assets per capita as well as for buildings, engineering construction and intellectual property.
In contrast, Nova Scotia's per capita stocks of government sector assets as well as machinery/equipment assets have grown faster than the national pace and are now higher than national averages.
Notes: Non-residential fixed capital investment consists of expenditures made by business, governments and non-profit institutions serving households that add to the capital stock for production of goods and services in an economy. Investment that are included are buildings, engineering construction (i.e. bridge, mine structure), machinery and equipment, and intellectual property products (i.e. software, mineral exploration) but it doesn’t include non-reproducible assets (lands, mineral deposits, natural resources) or housing investment. The data are not seasonally adjusted and expressed in current prices.
Statistics Canada. Table 34-10-0163-01 Flows and stocks of fixed non-residential and residential capital, by sector and asset, provincial and territorial (x 1,000,000)
<--- Return to Archive


