The Economics and Statistics Division maintains archives of previous publications for accountability purposes, but makes no updates to keep these documents current with the latest data revisions from Statistics Canada. As a result, information in older documents may not be accurate. Please exercise caution when referring to older documents. For the latest information and historical data, please contact the individual listed to the right.
<--- Return to Archive
For additional information relating to this article, please contact:
May 16, 2024LIFE SATISFACTION AND QUALITY OF LIFE, Q4 2023 and Q1 2024 Statistics Canada has updated and expanded data about how Canadians perceive their quality of life. This information is collected as part of the Canadian Social Survey, conducted from October 2023-March 2024. National data does not include any results from the Territories.
This survey reports on Canadians' overall satisfaction with life, sense of meaning and purpose, loneliness, having someone on whom to depend on when needed, hope for the future, sense of belonging to community, satisfaction with time use, satisfaction with local environment, confidence in institutions, trust is news/media. For the first time, quality of life data reports on Canadians' experiences of discrimination or unfair treatment.
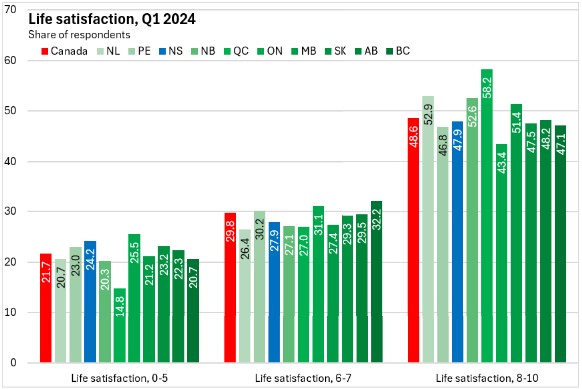
Life satisfaction
Respondents were asked "How do you feel about your life as a whole right now?" where 0 meant "Very dissatisfied" and 10 meant "Very satisfied."
In Nova Scotia, 47.9% of respondents rated their life satisfaction in the most satisfied categories (8-10) while 24.2% responded with the least satisfied categories (0-5). Across Canada, 48.6% of the respondents were in the most satisfied categories while 21.7% were in the least satisfied categories. High life satisfaction (8-10) was most prevalent in Québec while it was least prevalent in Ontario.
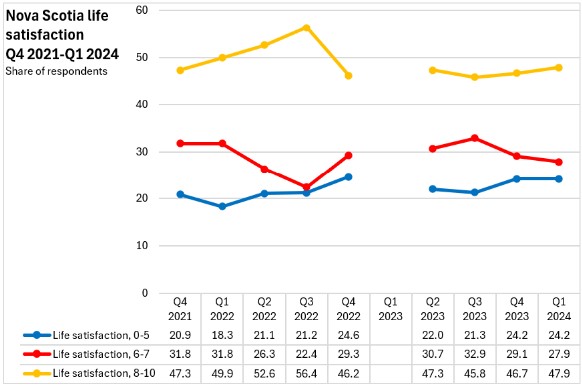
In Nova Scotia, levels of life satisfaction deteriorated after peaking in Q3 2022 (note: quality of life indicators were not collected consistently from Q4 2021 to Q1 2024). Since Q3 2023, there has been modest improvement in life satisfaction in Nova Scotia.
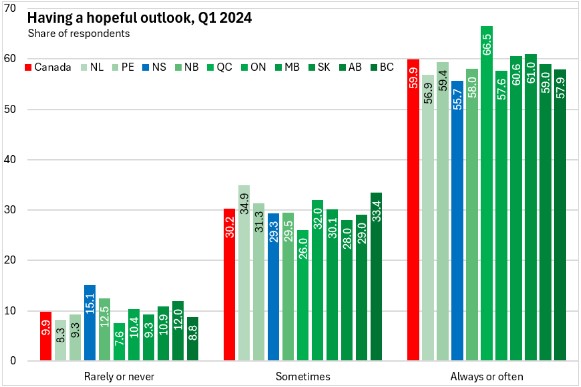
Hopeful Outlook for the Future
Respondents were asked how often they felt hopeful about the future.
55.7% of Nova Scotians reported feeling hopeful about the future always or often while 15.1% of Nova Scotians rarely or never felt hopeful about the future. Nova Scotians were least likely to always or often feel hopeful about the future. Respondents in Québec were most likely to report a hopeful outlook for the future.
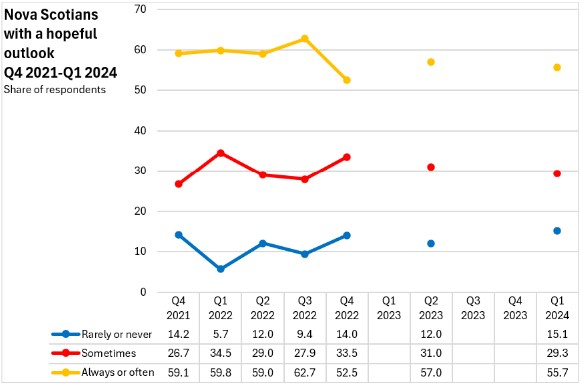
Although not measured frequently, the prevalence of a hopeful outlook deteriorated in Nova Scotia in Q4 2022 and has recovered somewhat since then.
Discrimination
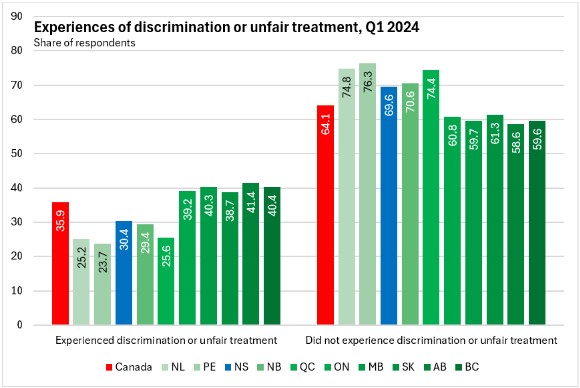
In Q1 2024, Canadians were asked about their experiences of discrimination or unfair treatment in the last 5 years based on any of: Indigenous identity, ethnicity or culture, race or skin colour, religion, language, accent, physical appearance, sex, sexual orientation, gender identity or expression, age, physical or mental disability or some other reason.
In Nova Scotia, 30.4% of respondents reported experiences of discrimination or unfair treatment while 69.6% of the population did not report these experiences. Across Canada, 35.9% of the population reported discrimination or unfair treatment, with higher prevalence in Ontario and the western provinces.
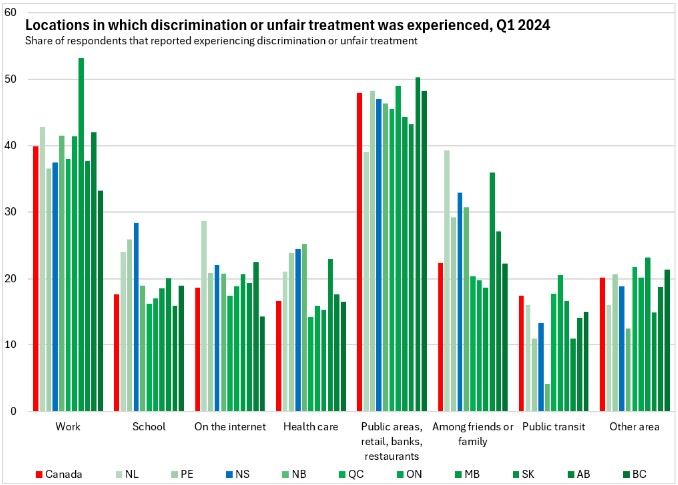
Among those that reported experiences of discrimination, the most common contexts were in workplaces or in public/retail spaces. In Nova Scotia, there were notably higher incidences of discrimination (among those that experienced it) in schools and health care as well as among family and friends.
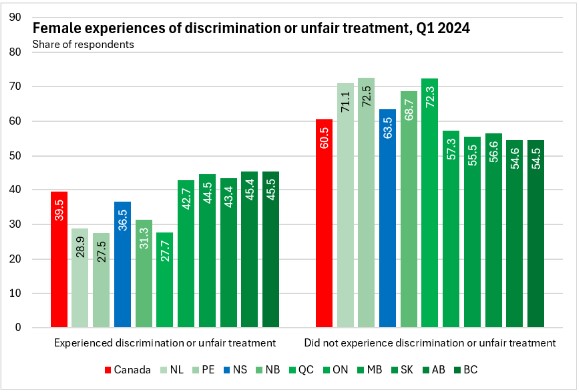
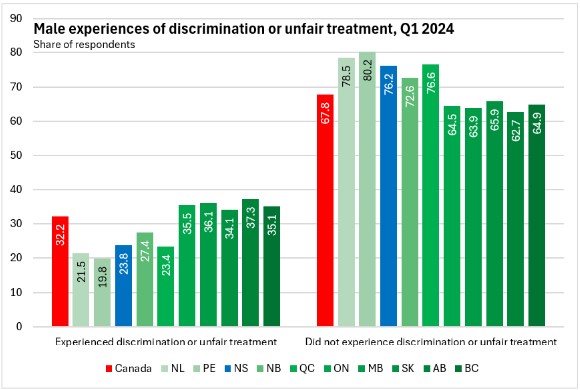
Females in Nova Scotia were notably more likely to report experiencing discrimination or unfair treatment than were males.
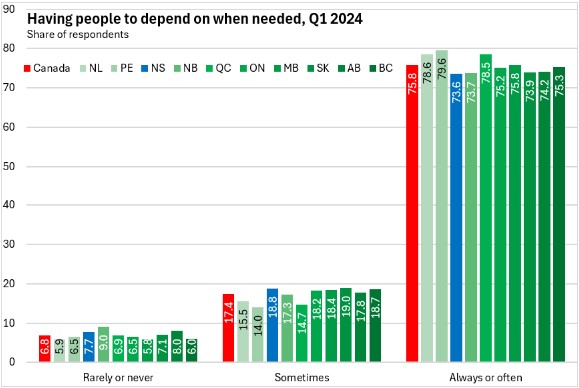
Someone to Depend on When Needed
Respondents were asked whether they felt they had someone on whom to depend on when needed.
In Nova Scotia, 73.6% of the population felt they always or often had someone on whom to depend when needed. Across Canada, 75.8% of respondents felt they always or often had someone upon whom to rely (highest: Prince Edward Island; lowest: Nova Scotia, New Brunswick, Saskatchewan).
7.7% of Nova Scotians felt they rarely or never had someone upon whom to rely.
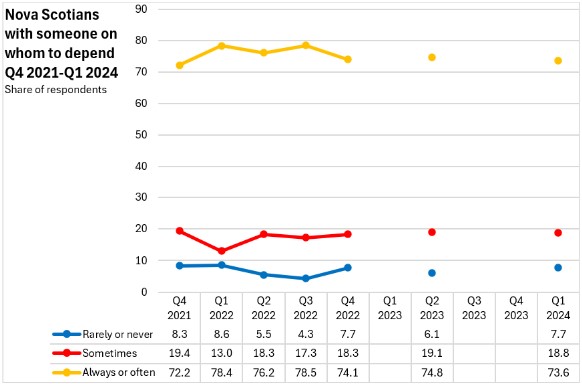
At one point, Nova Scotians were among the most likely to report always or often having someone upon whom to depend. This has eroded in the last 18 months.
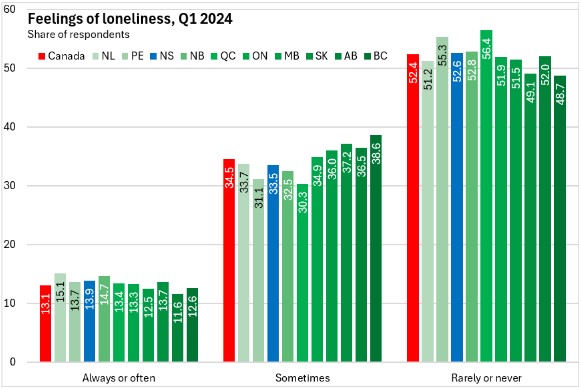
Loneliness
Survey respondents were asked about the frequency of feelings of loneliness.
In Nova Scotia, 52.6% of the population reported rarely or never feeling lonely. A further 33.5% reported feeling lonely sometimes while 13.9% reported feeling lonely often or always.
Nationally, 52.4% of the population are rarely or never lonely, 34.5% are lonely sometimes and 13.1% are often or always lonely. The share of the population that are rarely or never lonely was highest in Québec and lowest in British Columbia. The share of the population reporting frequent loneliness was highest in Newfoundland and Labrador and lowest in Alberta.
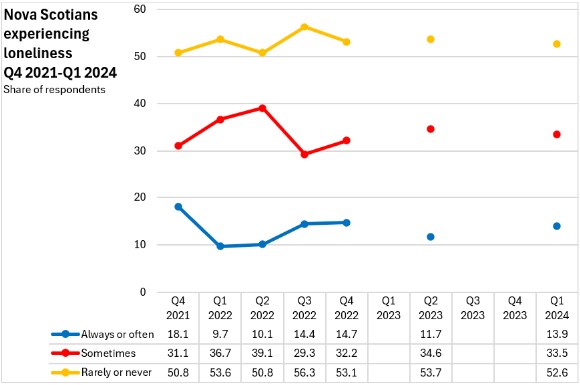
Over he last 18 months, there has been some increase in feelings of loneliness in Nova Scotia.
Sense of Meaning and Purpose
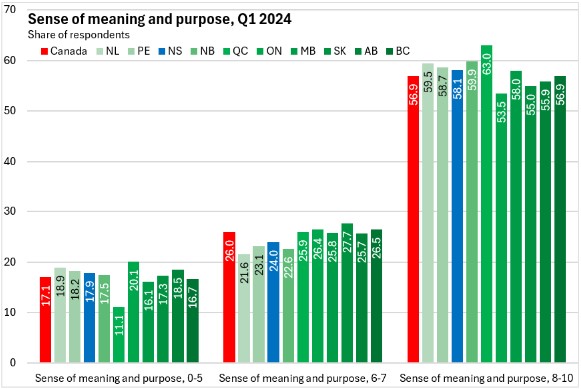
Respondents were asked whether the things to do in life felt worthwhile, ranked on a scale of 0 to 10 where '0' indicated 'not at all worthwhile' and '10' indicated 'completely worthwhile'.
In Nova Scotia, 58.1% of respondents replied in the three strongest categories (8-10) for sense of meaning and purpose. Across Canada, 56.9% reported the strongest sense of meaning and purpose. The highest share of respondents in these categories were in Québec.
17.9% of Nova Scotians responded that their sense of meaning and purpose in the things they do in life were in the lowest categories (0-5). The national average response in the lowest categories was 17.1%.
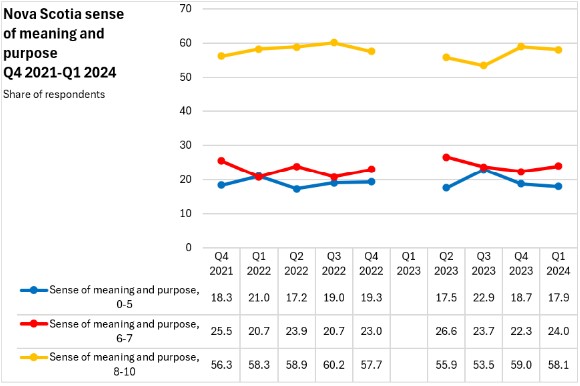
In Nova Scotia, there was a decline in respondents reporting high sense of meaning and purpose in life from Q3 2022 to Q3 2023, but these has reversed in the last two quarters.
Sense of Belonging to Community
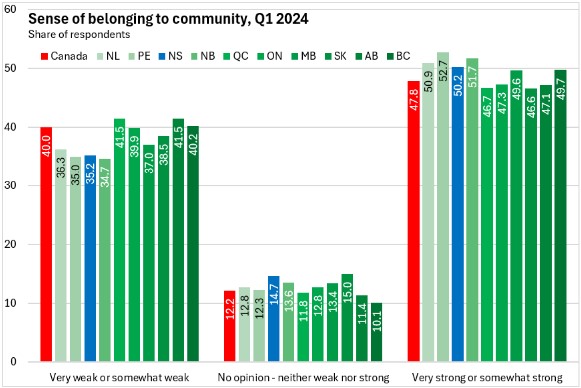
Respondents to the survey were asked about their sense of belonging to their local community.
In Nova Scotia 50.2% of respondents indicated a somewhat or very strong sense of belonging to their community - above the national average of 47.8% of Canadians. A stronger sense of belonging to community was more prevalent in Atlantic Canada and less prevalent in Québec and Saskatchewan.
In Nova Scotia, 35.2% of respondents reported a somewhat or very weak sense of belonging to community - the second lowest prevalence among provinces.
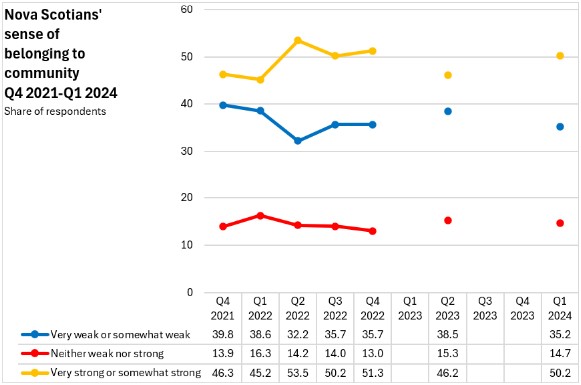
Although Nova Scotia's sense of belonging to community declined from Q4 2022 to Q2 2023, it has recovered partially in recent data.
Satisfaction with Time Use
Satisfaction with amount of free time (satisfaction with time use) is measured on a scale from 0 to 10. Respondents were asked, “On a scale from 0 to 10, where 0 means ‘Very dissatisfied’ and 10 means ‘Very satisfied,’ how satisfied are you with the amount of time you have to do the things that you like doing?”
In Nova Scotia, 41.8% of respondennts reported low satisfaction with time use (0-5). This was above the national average. Low satisfaction with time use was more prevalent in Saskatchewan.
35.0% of Nova Scotians reported the highest levels of satisfaction with time use, which was also above the national average (34.5%). Respondents in Québec reported the highest satisfaction with time use.
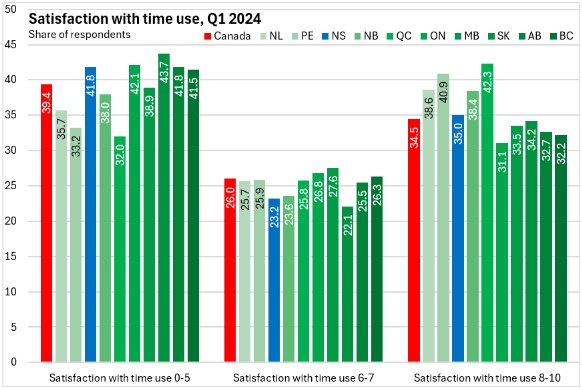
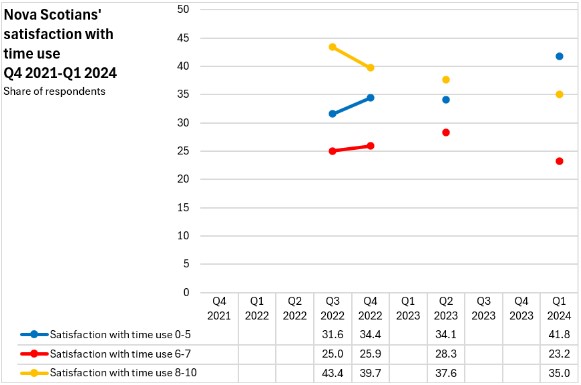
Although infrequently measured, satisfaction with time use appears to be declining in Nova Scotia.
Satisfaction with local environment
Satisfaction with local environment is measured on a scale from 0 to 10. Respondents were asked, “On a scale from 0 to 10, where 0 means ‘Very dissatisfied’ and 10 means ‘Very satisfied,’ how satisfied are you with the quality of your local environment such as access to green space, and air or water quality?”
In Nova Scotia, 57.0% of respondents reported the highest levels of satisfaction with the local environment - above the national average. High satisfaction with the local environment was notably more prevalent in Prince Edward Island and least prevalent in Ontario.
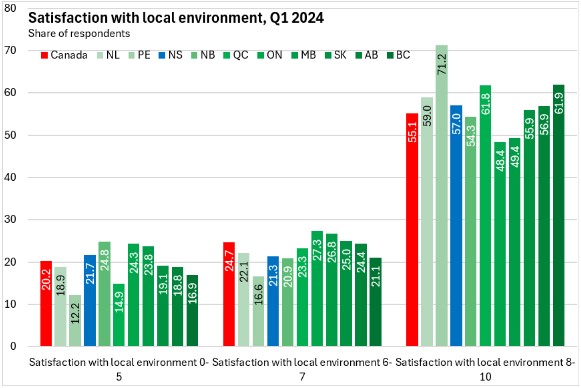
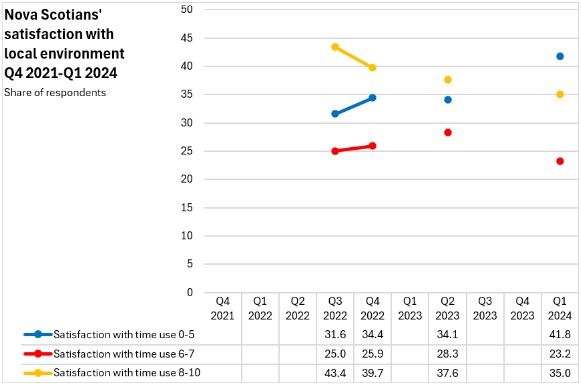
Satisfaction with the local environment appears to be declining in Nova Scotia (though this is infrequently assessed).
Confidence in Institutions
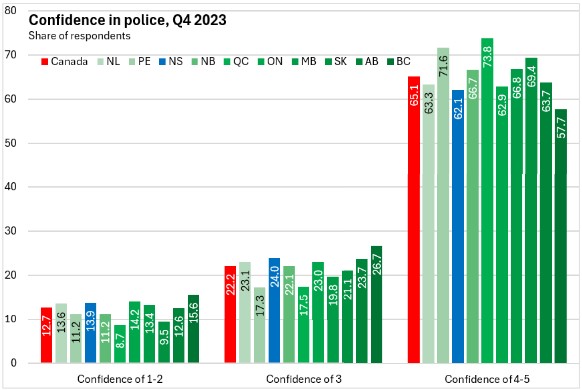
Confidence in institutions is measured on a scale from 1 to 5. Respondents were asked, “Using a scale of 1 to 5 where 1 means ‘No confidence at all’ and 5 means ‘A great deal of confidence,’ how much confidence do you have in the following institutions: the police, the justice system and courts, the school system, the Federal Parliament, the Canadian media?”
Canadians generally reported higher levels of confidence in the police with somewhat lower levels of confidence for the justice/courts and school systems. Strong confidence in the Federal Parliament and Canada's media was less prevalent.
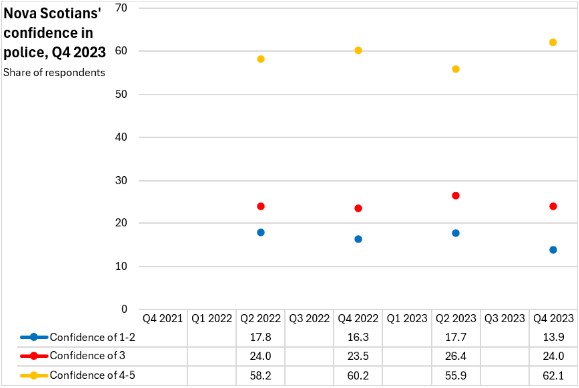
Respondents in Nova Scotia and British Columbia were least likely to report high levels of confidence in police.
Over time, Nova Scotians' confidence in police appears to be stable (although only measured every second quarter).
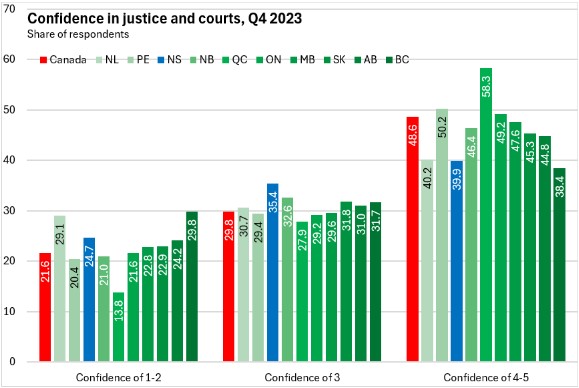
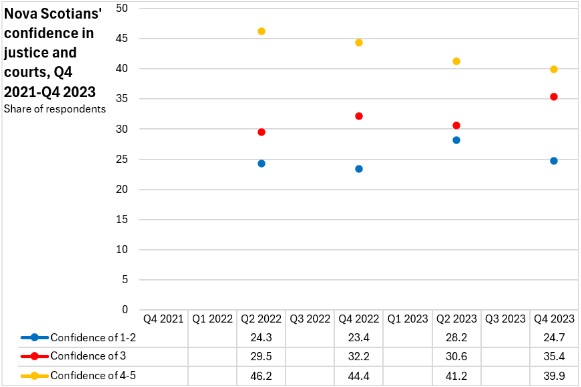
As with police, Nova Scotia and British Columbia residents were less likely to express high confidence in justice and the courts.
Nova Scotians' confidence in justice and the courts appears to be declining over time.
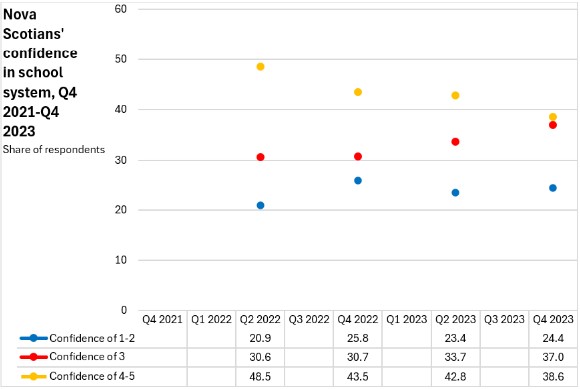
Nova Scotians were the least likely to report strong confidence in the school system.
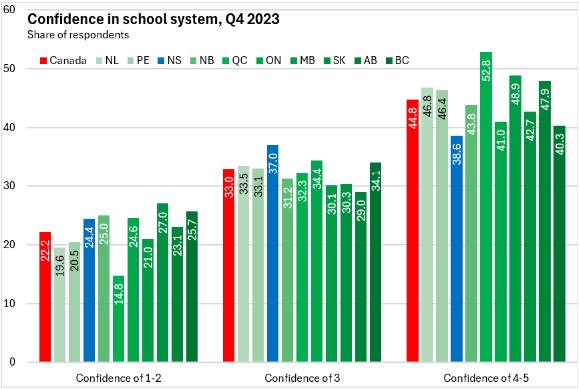
Nova Scotians' confidence in schools has been declining.
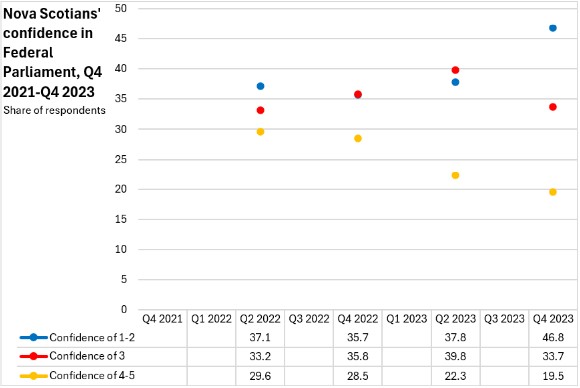
Nova Scotia's were also the least likely to report high confidence in Canada's Federal Parliament.
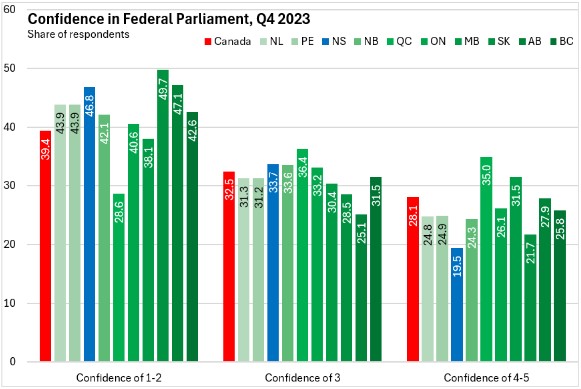
Nova Scotians' confidence in Federal Parliament has been falling.
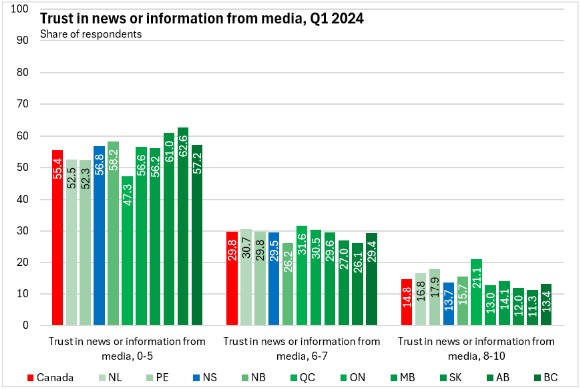
Trust in news and information received from media
More than half of respondents in every province except Québec reported low levels of trust in news and information from media. Only in Québec did more than 20% of respondents have high trust in news or information from media.
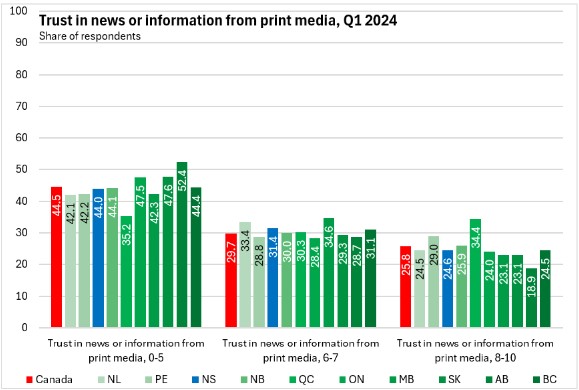
Print media enjoyed stronger levels of trust than overall media, particularly in Québec.
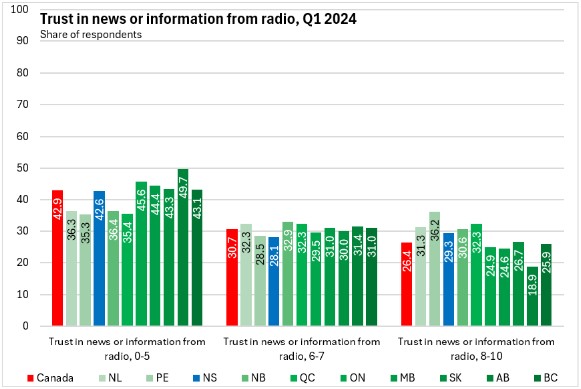
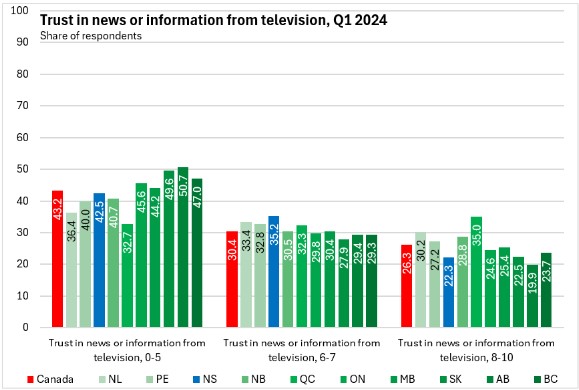
Trust levels in news and information from radio were stronger in Prince Edward Island while those in Québec reported more confidence in television.
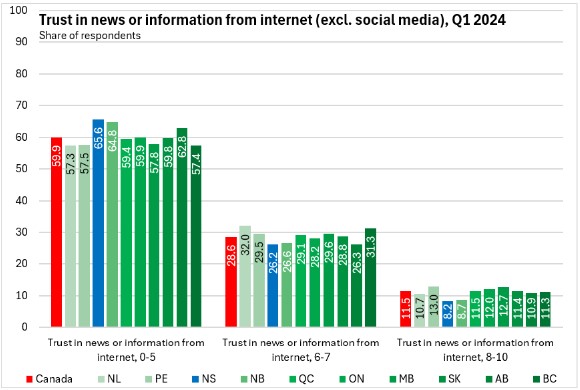
More than half of respondents in every province reported low levels of trust in news or information from the internet (excluding social media).
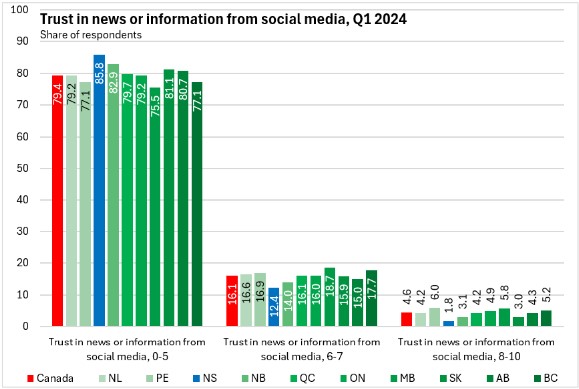
A large majority of respondents in every province reported the lowest levels of trust in news or information from social media. Nova Scotians reported the lowest levels of trust in social media.
Source: Statistics Canada. Table 13-10-0843-01 Life satisfaction by gender and province; Table 13-10-0845-01 Sense of meaning and purpose by gender and province; Table 45-10-0079-01 Perceived mental health, by gender and province; Table 45-10-0081-01 Perceived health, by gender and province; Table 45-10-0086-01 Difficulty meeting financial needs, by gender and province; Table 45-10-0090-01 Satisfaction with family relationships by gender and province; Table 45-10-0092-01 Satisfaction with friend relationships by gender and province; Table 45-10-0094-01 Trust in people by gender and province; Table 45-10-0096-01 Trust in news or information from media by gender and province; Table 45-10-0100-01 Discrimination and unfair treatment by gender and province
<--- Return to Archive