The Economics and Statistics Division maintains archives of previous publications for accountability purposes, but makes no updates to keep these documents current with the latest data revisions from Statistics Canada. As a result, information in older documents may not be accurate. Please exercise caution when referring to older documents. For the latest information and historical data, please contact the individual listed to the right.
<--- Return to Archive
For additional information relating to this article, please contact:
May 22, 2024NOVA SCOTIA POPULATION ESTIMATES BY COUNTY AND CENSUS SUBDIVISION - JULY 1, 2023 Statistics Canada has released estimates of the population by county as of July 1, 2023. With recent postcensal adjustments following the 2021 Census, populations have been revised for the period from 2016 to 2022 as well.
Provincial population estimates for July 1, 2023 were released on February 21, 2024 and updated to January 1, 2024 on March 27, 2024. These population estimates should not be confused with Census counts. Estimates of the population adjust for net undercoverage from the Census as well as incompletely enumerated Indian reserves.
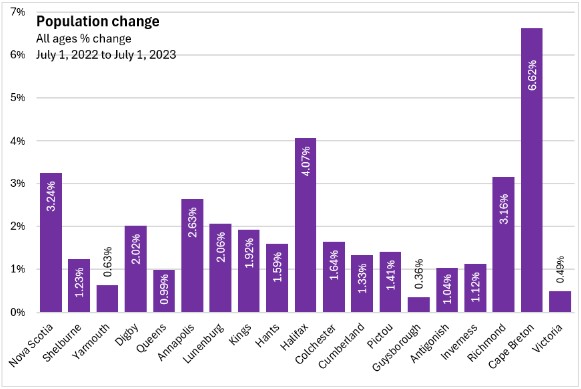
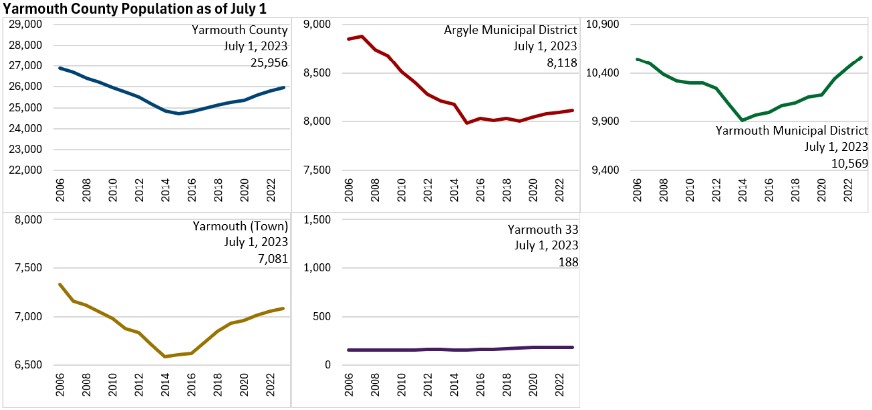
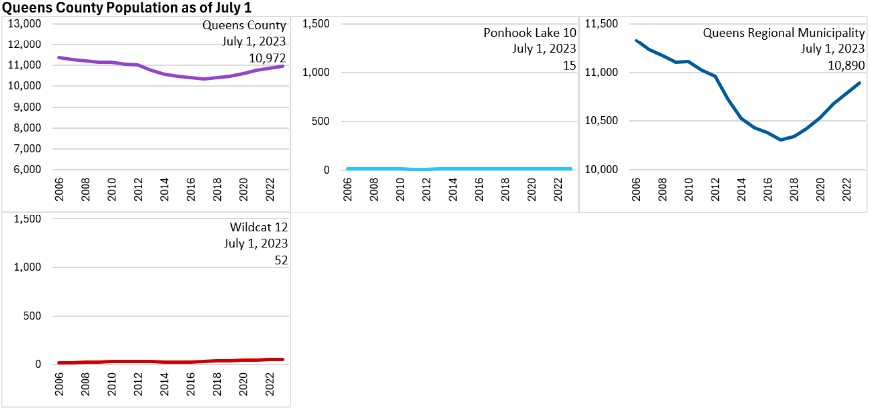
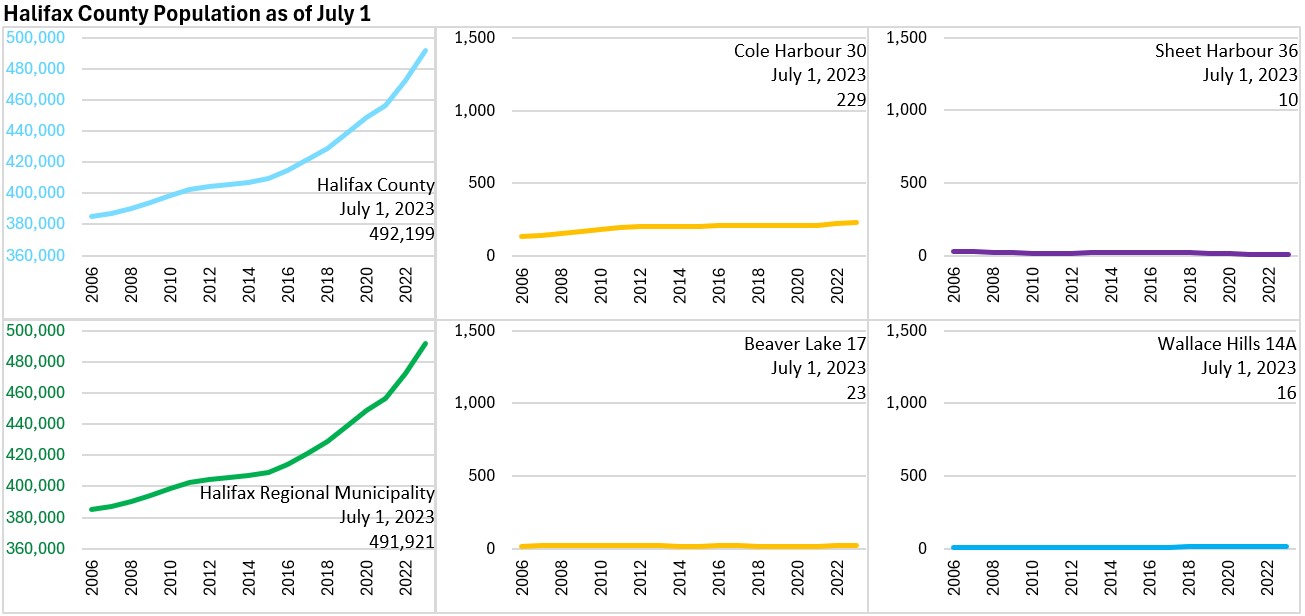
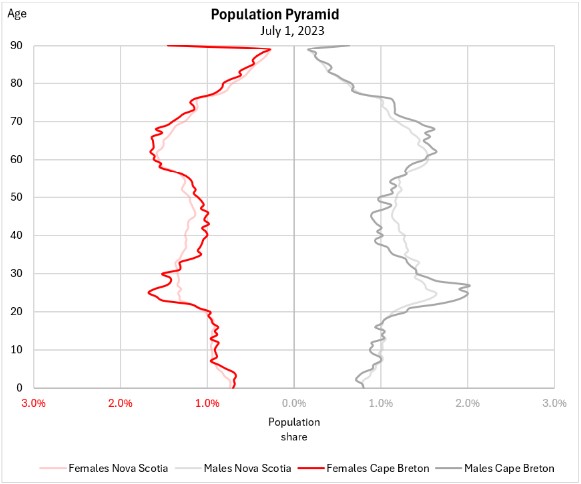
Between July 1, 2022 and July 1, 2023 Nova Scotia's population increased by 3.24% or 33,249 persons, reaching 1,058,694 as of July 1, 2023. Across Nova Scotia, all 18 counties reported population growth from July 1, 2022 to July 1, 2023. Cape Breton county had the fastest growth at 6.62%, followed by Halifax county at 4.07%. Growth was slower in Victoria, Guysborough, Queens and Yarmouth counties.
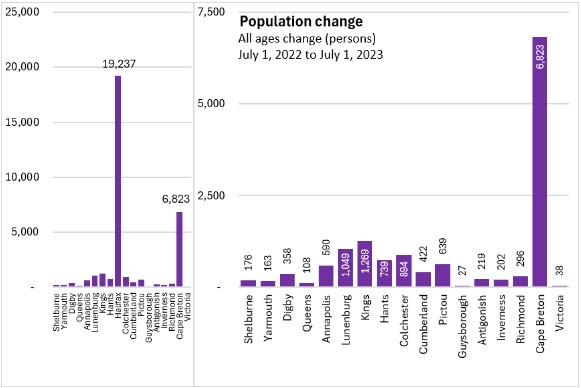
Of the 33,249 persons added to Nova Scotia's population from July 1, 2022 to July 1, 2023, Halifax accounted for the largest portion at 19,237. Cape Breton county accounted for the next largest amount of population increase after adding 6,823 to the population.
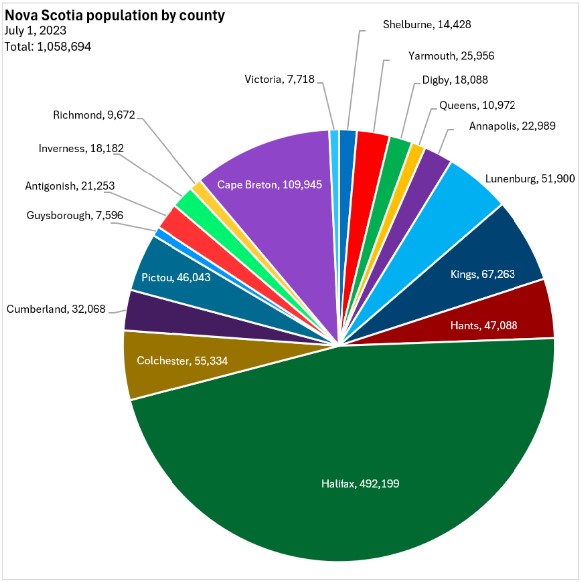
Halifax's population has risen to 492,199 or 46.5% of the provincial population as of July 1, 2023.
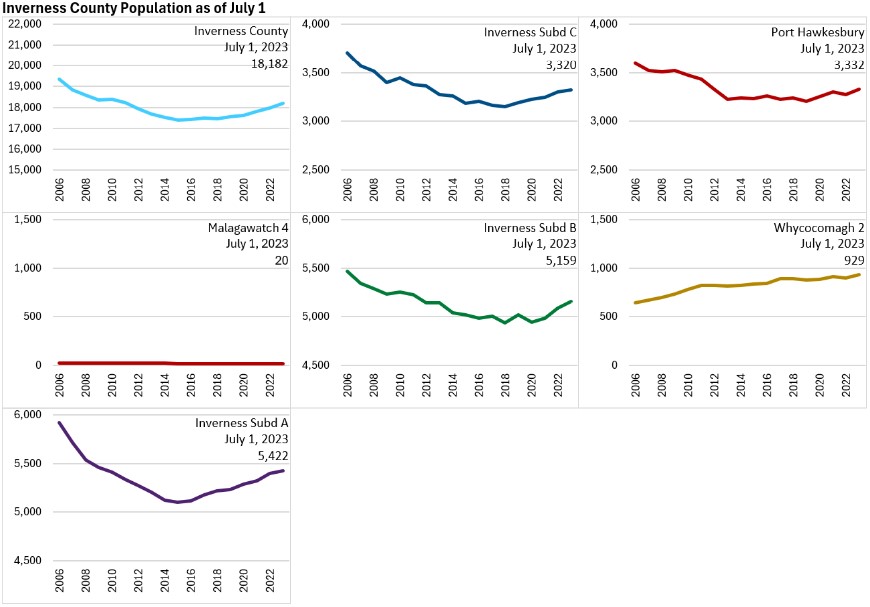
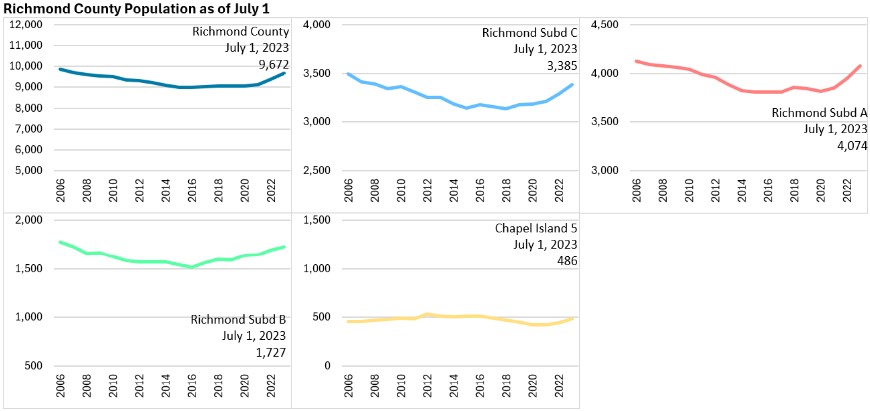
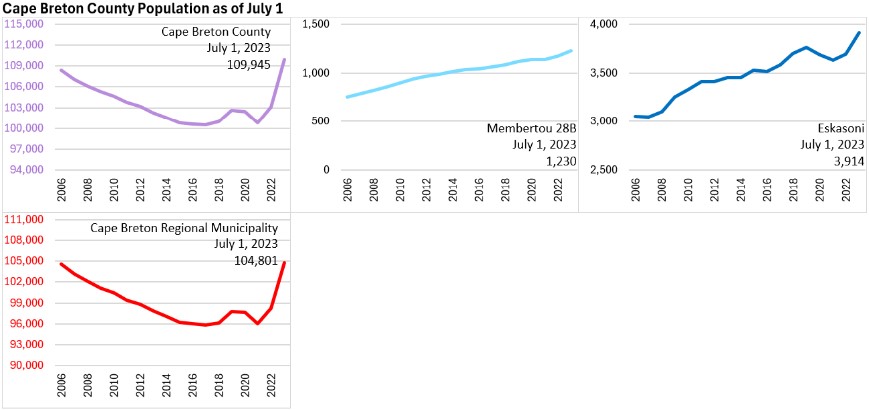
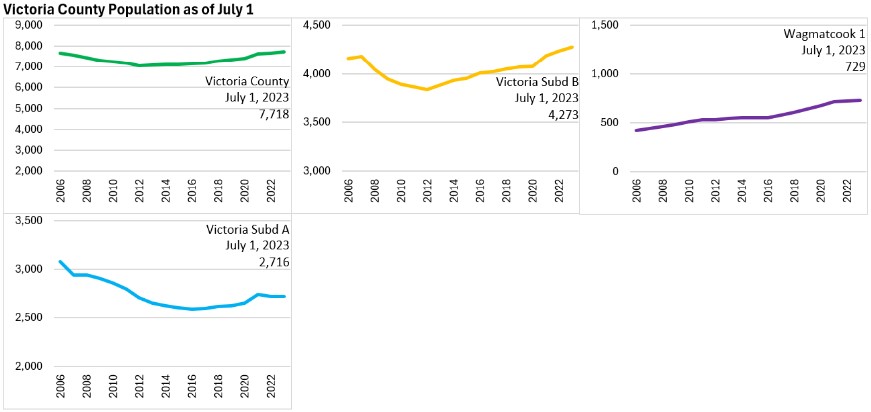
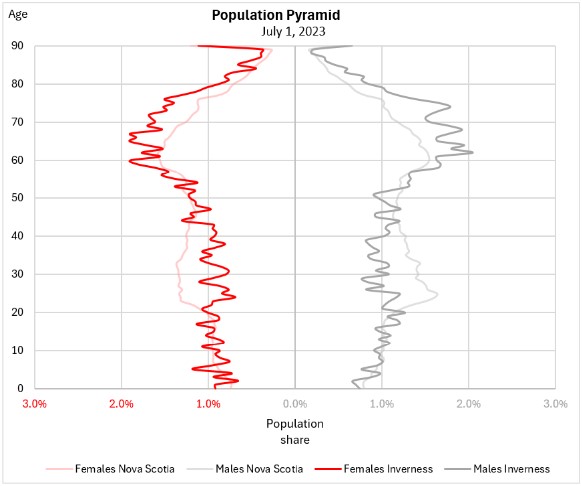
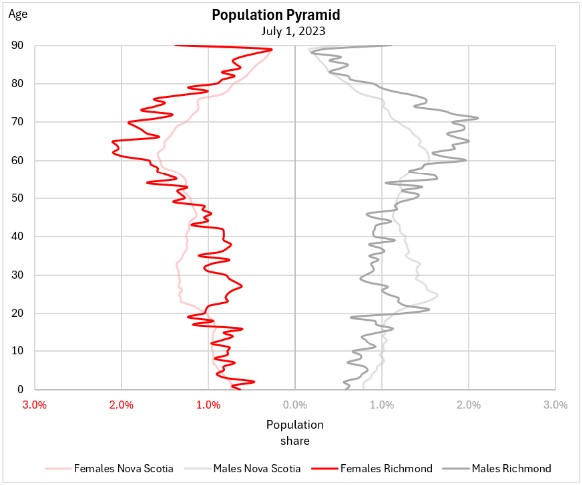
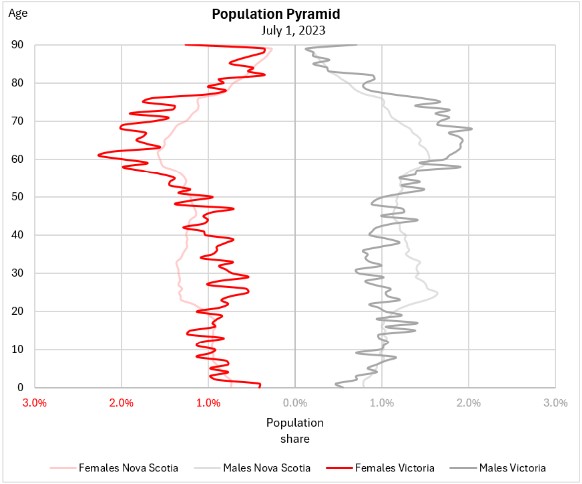
Cape Breton county's population was 109,945 and accounted for 10.4% of the provincial population. The other three counties on Cape Breton Island (Inverness, Richmond and Victoria) made up 3.4% of the provincial population (35,572).
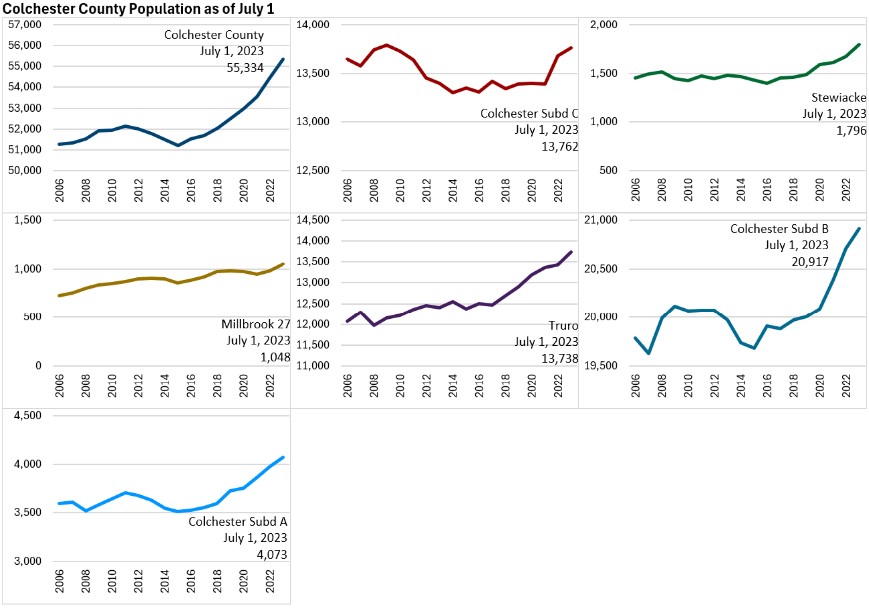
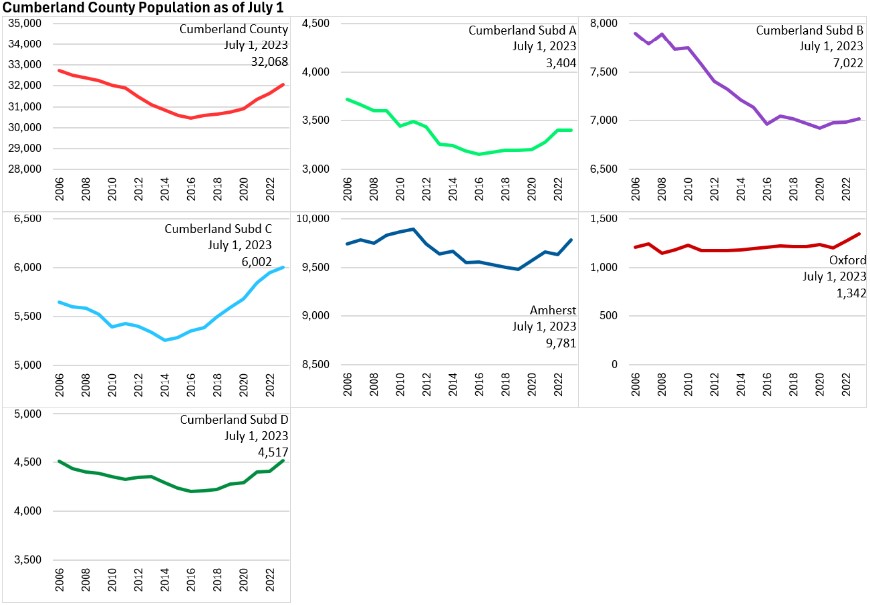
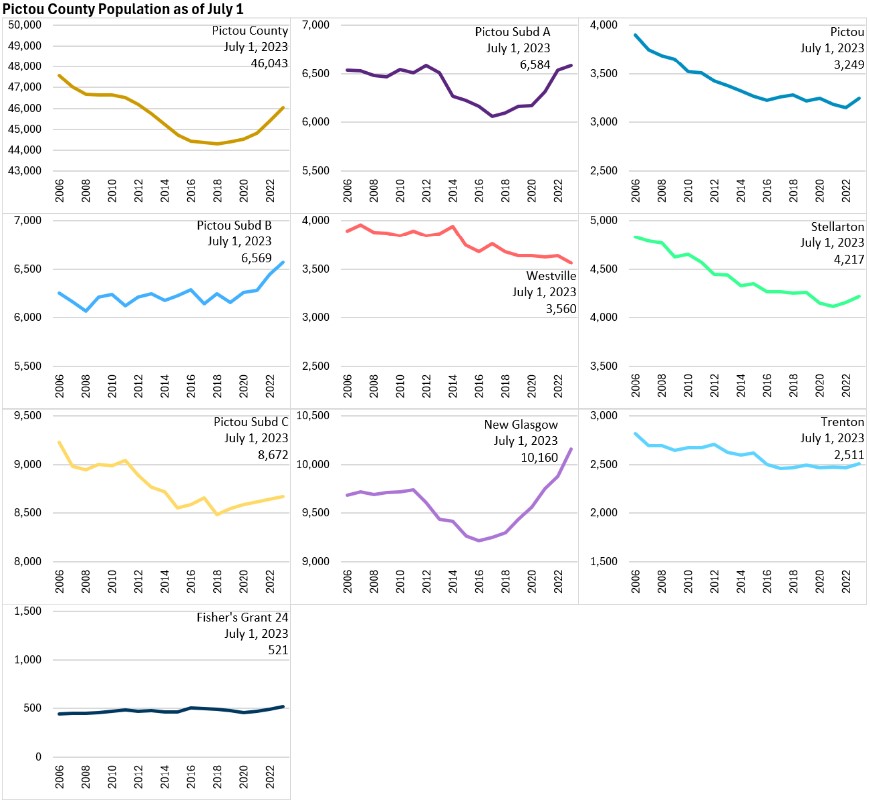
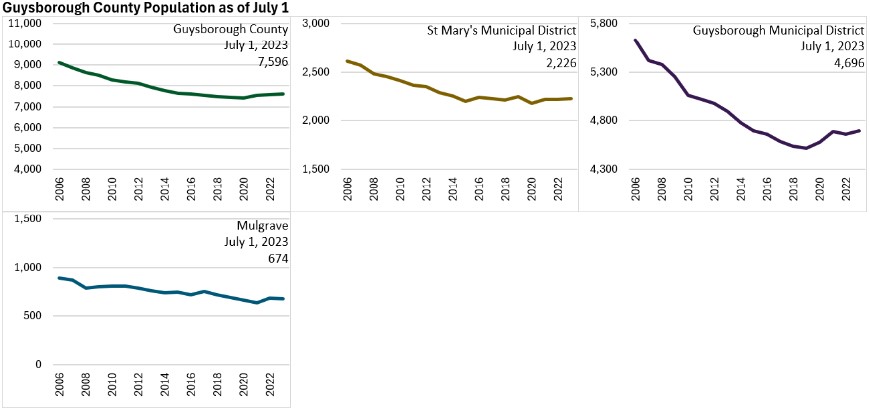
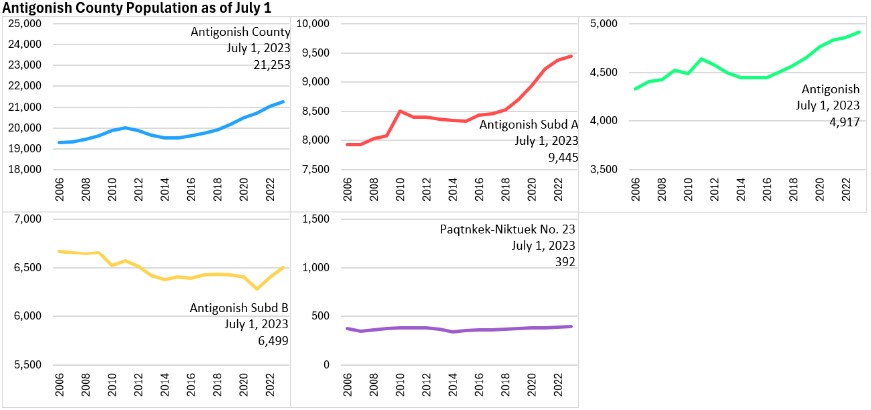
Counties in the North Shore economic region (Colchester, Cumberland, Pictou, Guysborough, and Antigonish) had a population of 162,294 or 15.3% of the provincial total.
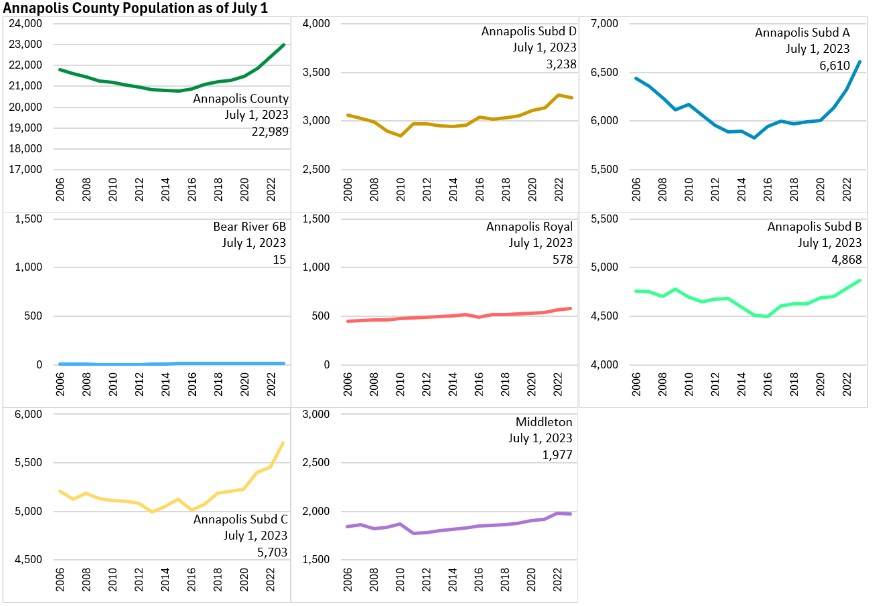
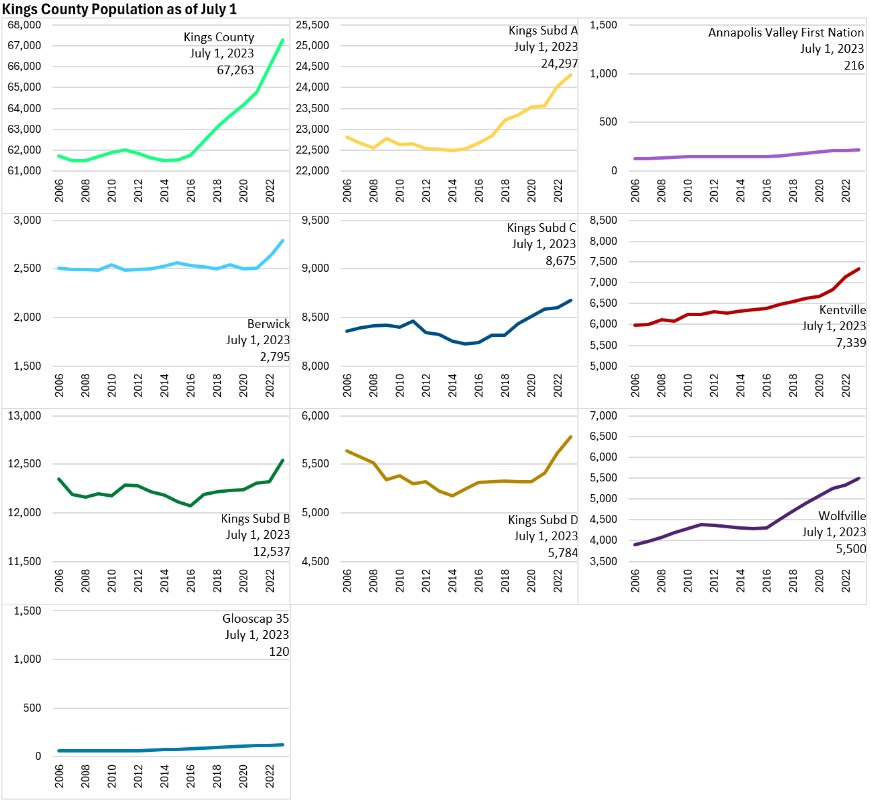
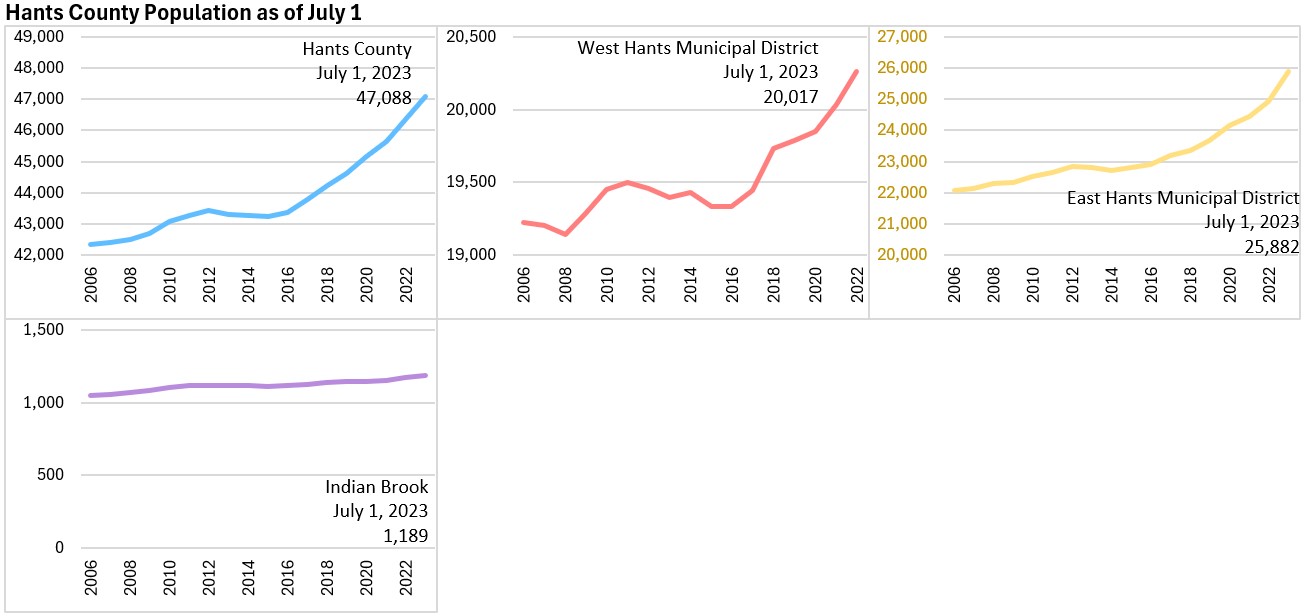
Counties in the Annapolis Valley (Annapolis, Kings and Hants) had 137,340 residents or 13.0% of Nova Scotia's population.
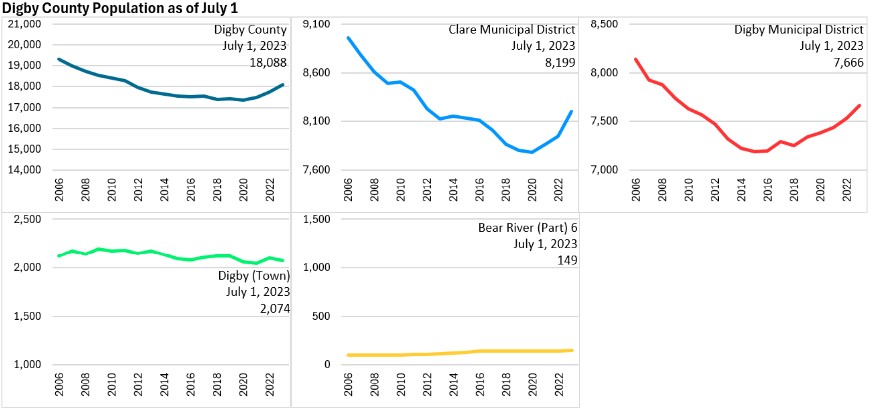
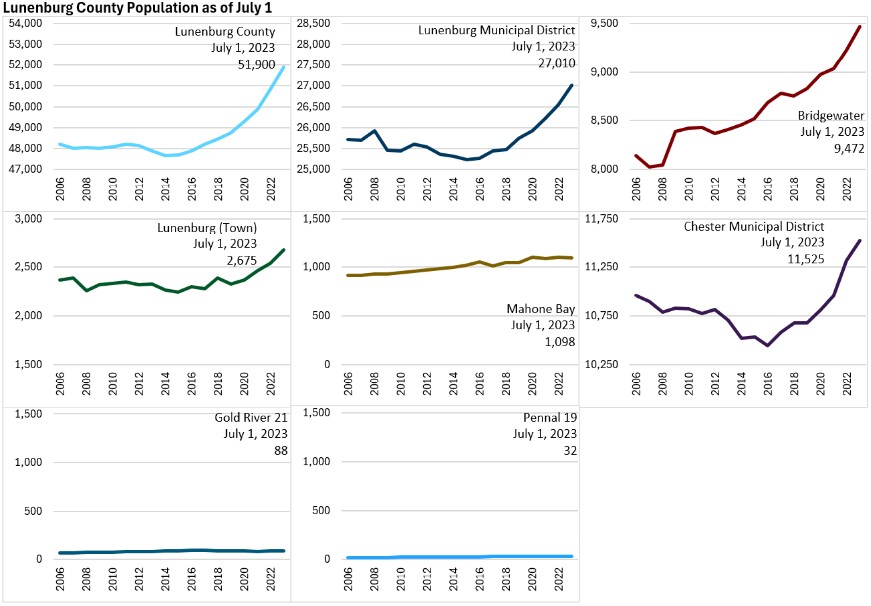
The counties of Southern Nova Scotia (Shelburne, Yarmouth, Digby, Queens and Lunenburg) had a population of 121,344 or 11.5% of the provincial total.
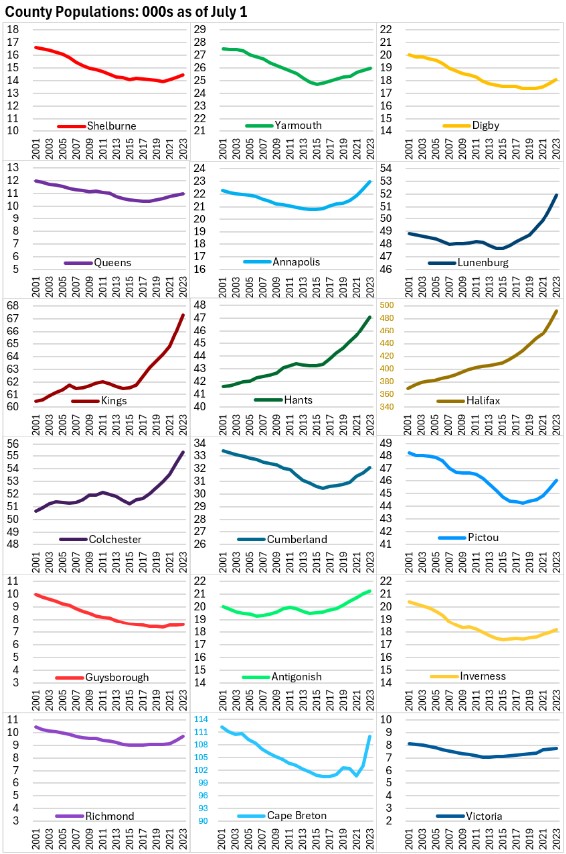
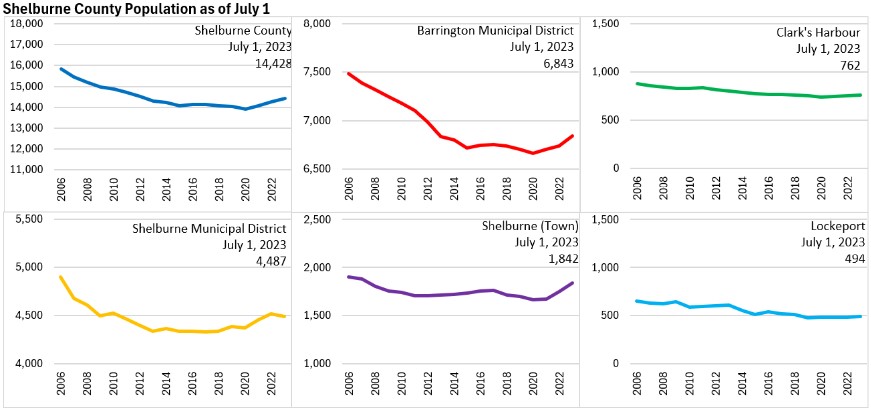
Outside of Halifax, Hants, Lunenburg, Colchester, Antigonish and Kings counties, most parts of the province have experienced periods of population decline. However, in recent years, population decline has stopped and reversed for all counties. Reversal of population decline was particularly sharp in Cape Breton county.
Note: vertical axis range from minimum to maximum for most counties are set to 8,000 except Cape Breton (24,000) and Halifax (160,000).
Components of county population change
Population estimates for counties change from one year to the next based on natural change (births less deaths), international migration (immigration, less net emigration, plus net change in non-permanent residents), net interprovincial migration (in-migrants from other parts of Canada to Nova Scotia less out-migrants from Nova Scotia to other parts of the country) and net intraprovincial migration (in-migrants from elsewhere in Nova Scotia less out-migrants bound for other parts of the Province).
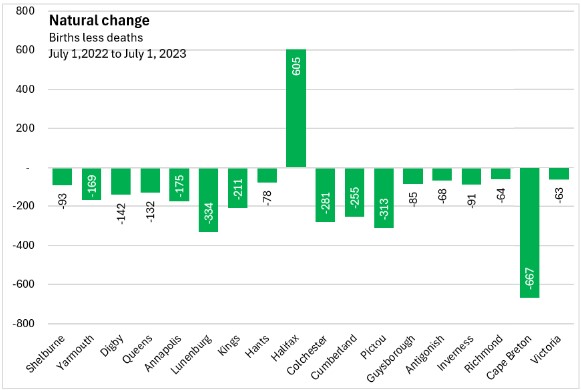
All counties except Halifax reported more deaths than births between July 1, 2022 and July 1, 2023. The natural population decline was largest in Cape Breton (-667) while Halifax had a natural population increase of 605.
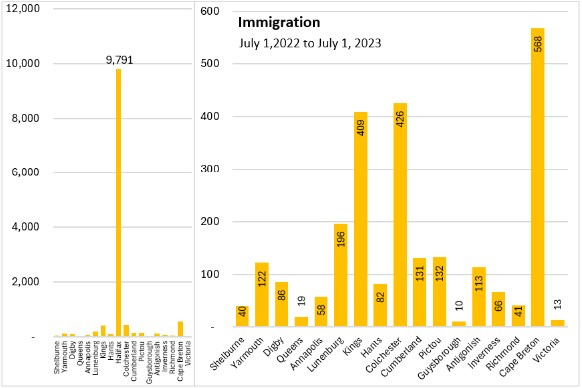
Immigration added 12,303 to Nova Scotia's population between July 1, 2022 and July 1, 2023. Immigration was concentrated in Halifax with 9,791 immigrants added to the population. The next highest numbers of immigrants added were in Cape Breton (568), Colchester (426) and Kings (409) counties.
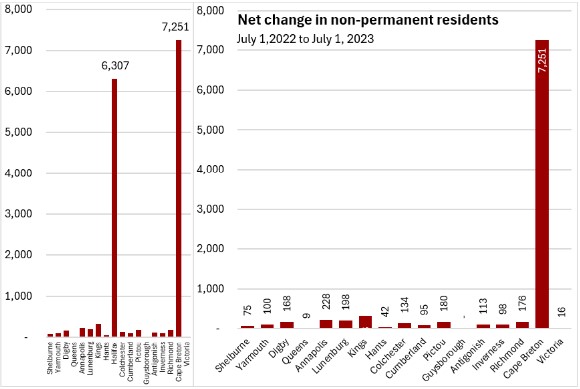
The flow of non-permanent residents (such as temporary foreign workers and international students) accelerated sharply in the most recent year, adding 15,518 to the population between July 1, 2022 and July 1, 2023. Cape Breton county added the most non-permanent residents with a net change of 7,251. Halifax had the next largest net increase in non-permanent residents at 6,307. All counties except Guysborough (unchanged) reported net increases in the number of non-permanent residents.
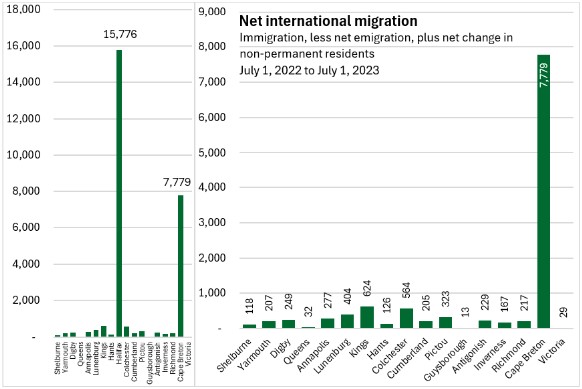
Overall net international migration contributed 27,339 to population growth in every county from July 1, 2022 to July 1, 2023. The province's net international population gain was concentrated in Halifax (15,776) and Cape Breton (7,779) counties. Queens, Victoria and Guysborough counties reported the least population gains from net international migration.
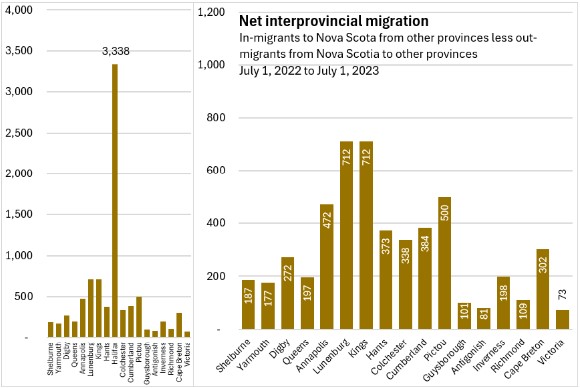
From July 1, 2022 to July 1, 2023 there was net interprovincial migration of +8,526 for the province as a whole (24,226 in-migrants less 15,700 out-migrants).
As with many other components of population change, net interprovincial migration was concentrated in Halifax with a net gain of 3,338 persons. Following Halifax, the largest net interprovincial migration gains were reported in Kings (712), Lunenburg (712), Pictou (500) and Annapolis (472) counties. All counties reported positive net interprovincial migration in the last year.
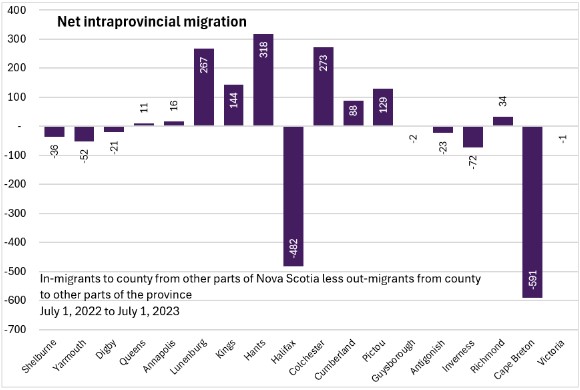
Net intraprovincial migration was negative for Halifax from July 1, 2022 to July 1, 2023 as 482 more people moved out of the city to other parts of the province than moved into the city from elsewhere in Nova Scotia. Cape Breton county reported the largest net intraprovincial population decline (-591). There were also modest net intraprovincial population declines in Shelburne, Yarmouth, Digby, Guysborough, Antigonish, Inverness, Richmond and Victoria counties. Hants, Lunenburg and Colchester counties reported the largest net gains from intraprovincial migration. Positive intraprovincial migration levels were also reported in Queens, Annapolis, Kings, Cumberland, Pictou and Richmond counties.
Cities
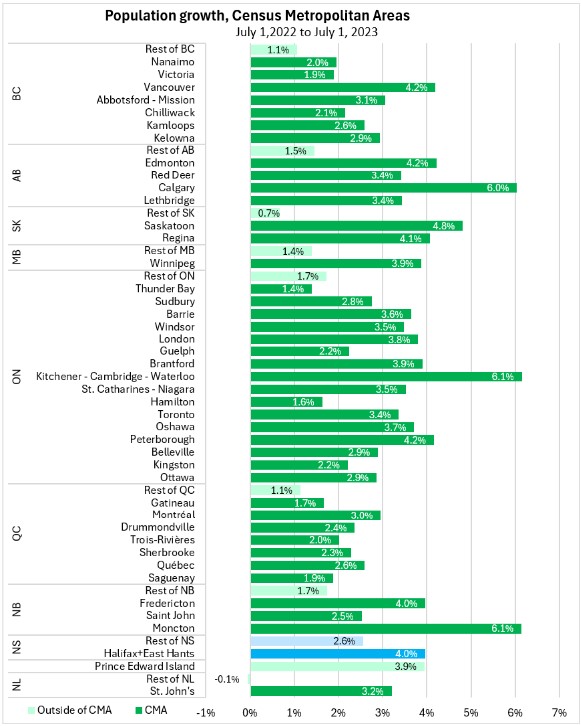
In the 2021 Census, Statistics Canada changed the Halifax Census Metropolitan Area's boundaries to include the population of East Hants as well.
The Halifax and East Hants Census Metropolitan Area grew by 4.0% from July 1, 2022 to July 1, 2023 (following Moncton). Outside Halifax and East Hants, Nova Scotia's population growth was 2.6% in the last year. Among Census Metropolitan Areas, Moncton and Kitchener-Waterloo-Cambridge reported the fastest growth from July 1, 2022 to July 1, 2023 (6.1%). Across Canada, Census Metropolitan Areas grew more rapidly than areas outside CMAs
Census Subdivisions
Census subdivisions are towns, municipal districts, regional municipalities, Indian reserves and rural areas (identified as Subdivisions A, B, C, or D in their counties). A map of Nova Scotia's census subdivisions can be found here: Standard Geographical Classification, census division – census subdivision maps, Nova Scotia
Age cohorts
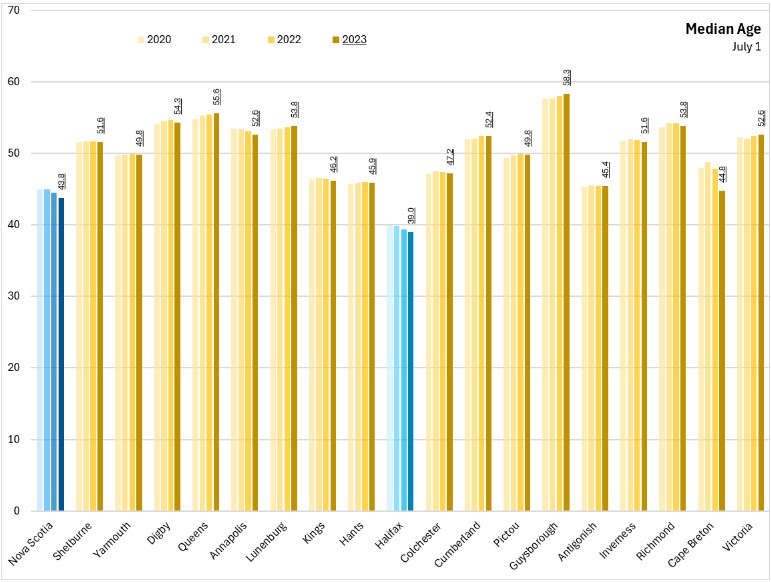
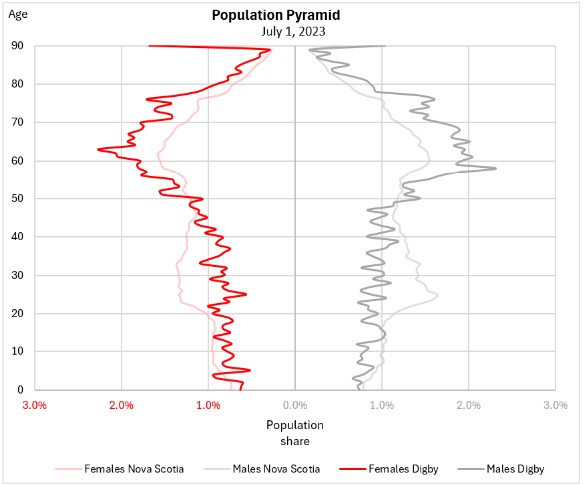
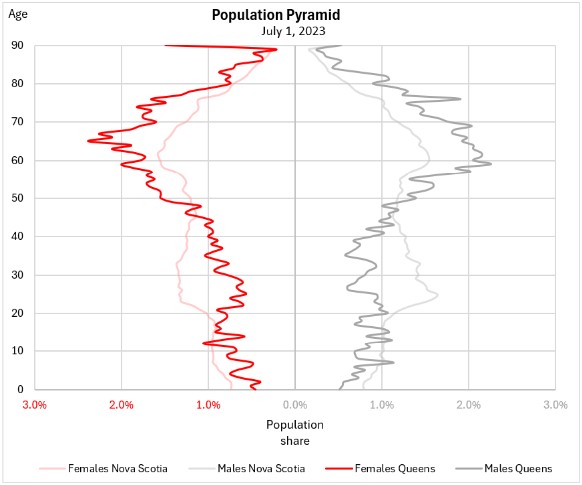
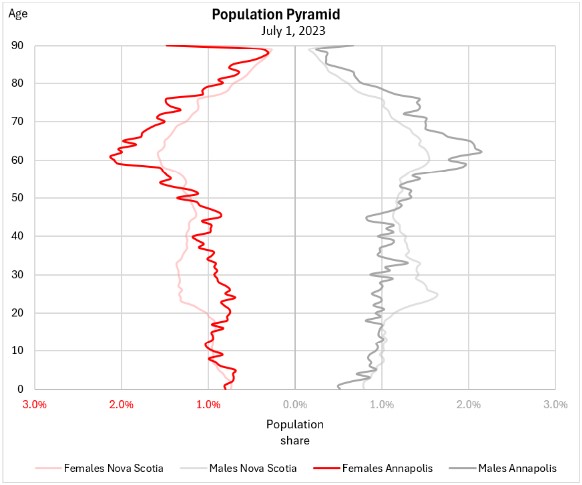
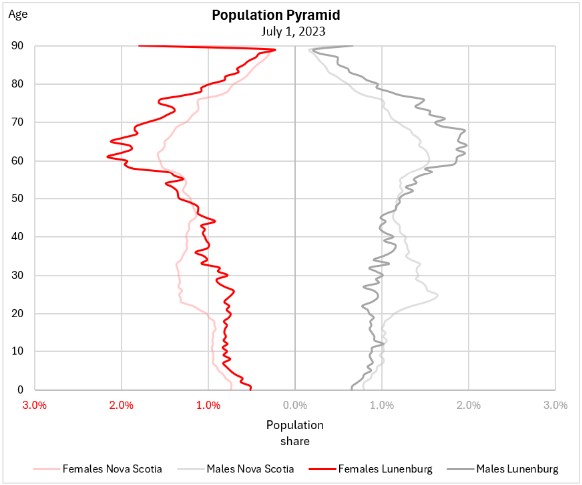
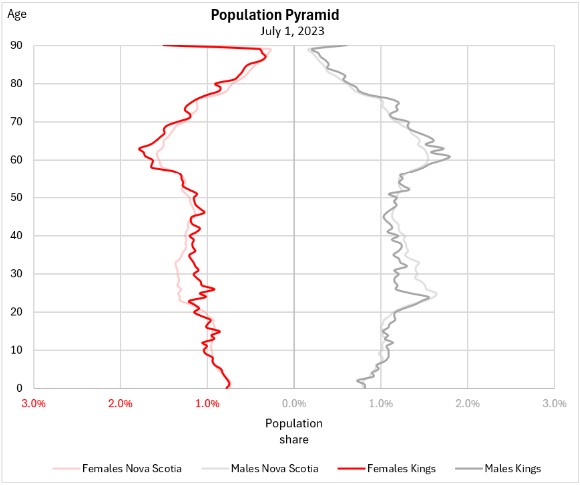
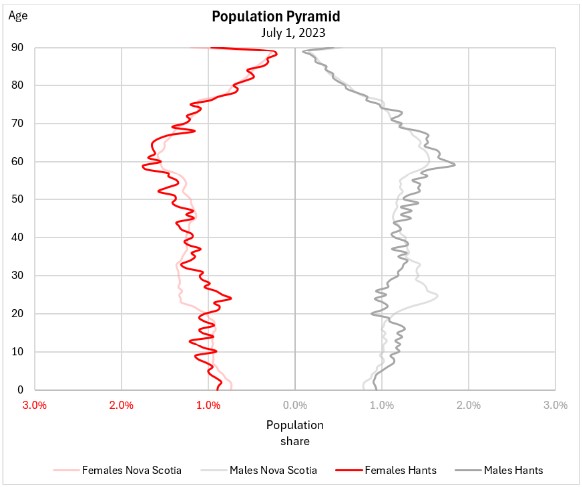
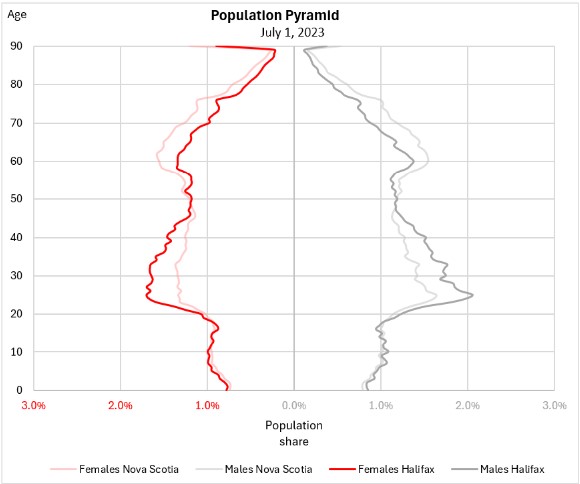
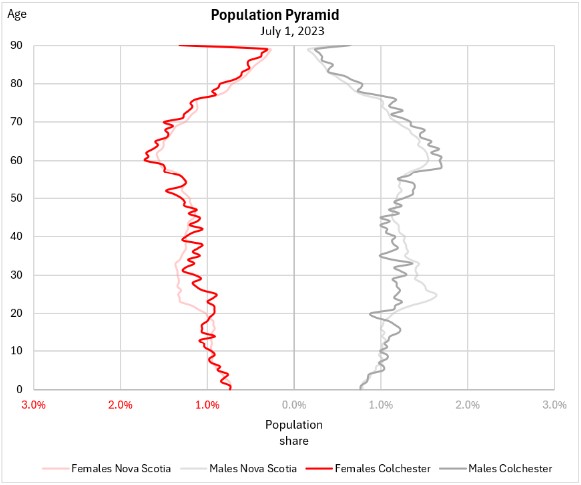
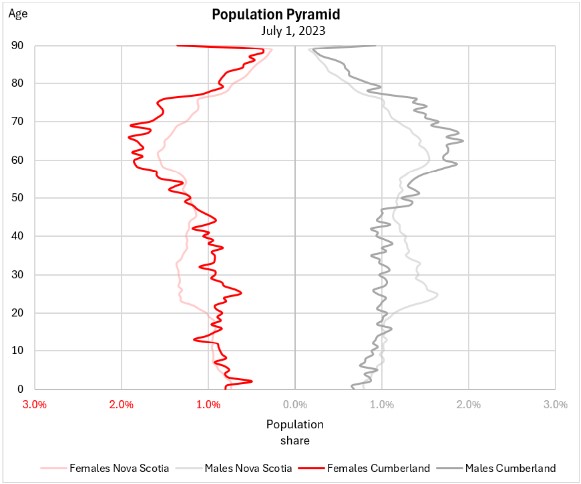
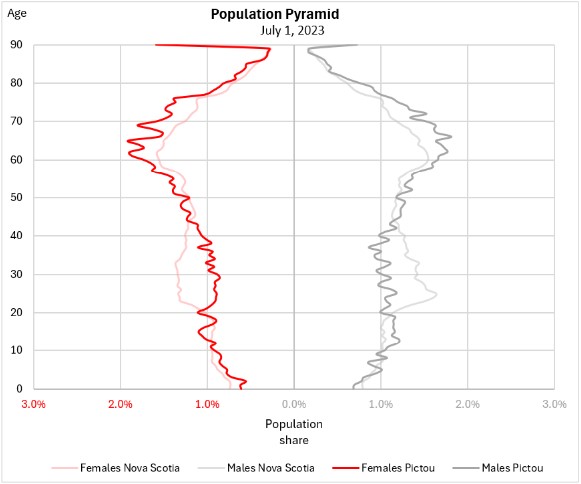
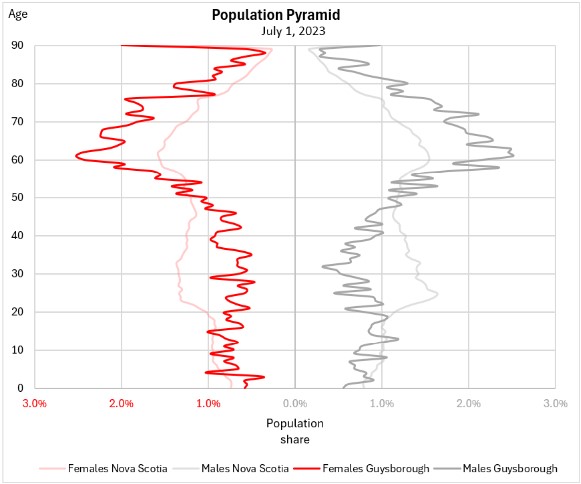
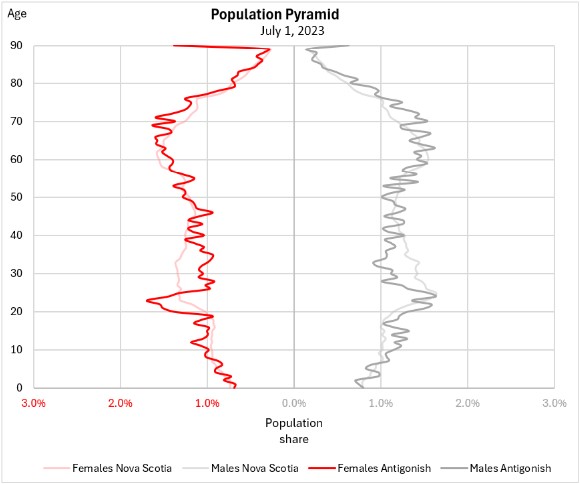
Nova Scotia's overall median age declined from 44.5 years on July 1, 2022 to 43.8 years on July 1, 2022. Median age declined for most counties, but the decline in Cape Breton county's median age was particularly sharp, falling from 47.9 on July 1, 2022 to 44.8 on July 1, 2023. Only Queens, Lunenburg, Guysborough and Victoria counties reported rising median age. Median ages were unchanged in Cumberland and Antigonish counties.
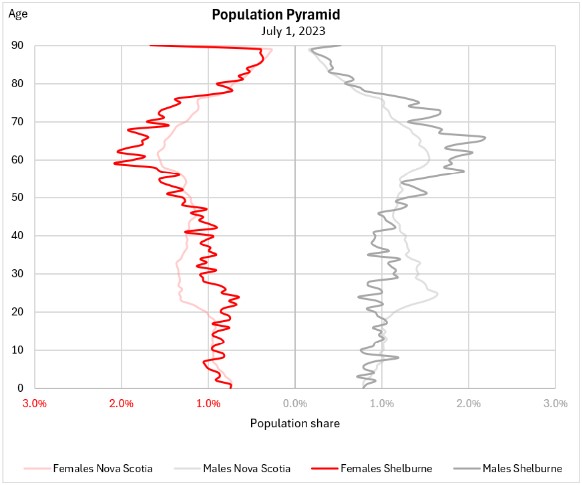
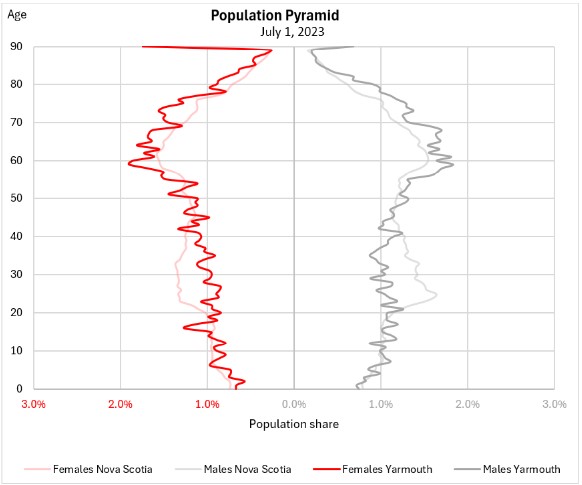
In population pyramids, Halifax, Cape Breton and Antigonish counties report higher than average shares of population in younger cohorts (20-40). Shares of population aged 50-70 were notably higher in Shelburne, Yarmouth, Digby, Queens, Annapolis, Lunenburg, Cumberland, Pictou, Guysborough, Inverness, Richmond and Victoria counties.
Sources: Statistics Canada. Table 17-10-0152-01 Population estimates, July 1, by census division, 2021 boundaries; Table 17-10-0153-01 Components of population change by census division, 2021 boundaries; Table 17-10-0155-01 Population estimates, July 1, by census subdivision, 2021 boundaries; Table 17-10-0148-01 Population estimates, July 1, by census metropolitan area and census agglomeration, 2021 boundaries
<--- Return to Archive