The Economics and Statistics Division maintains archives of previous publications for accountability purposes, but makes no updates to keep these documents current with the latest data revisions from Statistics Canada. As a result, information in older documents may not be accurate. Please exercise caution when referring to older documents. For the latest information and historical data, please contact the individual listed to the right.
<--- Return to Archive
For additional information relating to this article, please contact:
May 27, 2024SURVEY ON BUSINESS CONDITIONS: Q2 2024 Statistics Canada has conducted its 16th iteration of the Canadian Survey on Business Conditions. In April and early May, Statistics Canada surveyed businesses to collect information on businesses' expectations, obstacles, plans and practices.
The results reported here are a selection of the impacts found for Nova Scotia businesses, by industry, by size of business (measured by number of employees), by age of business and by urban or rural location. There are comparisons of the Nova Scotia average (all industries, ages, sizes, locations) with the national and provincial averages. The horizontal axis in all charts measures the share of businesses reporting each outcome. The total for many outcomes does not add to 100% of respondent businesses as many replied that the outcome was not applicable in their circumstances.
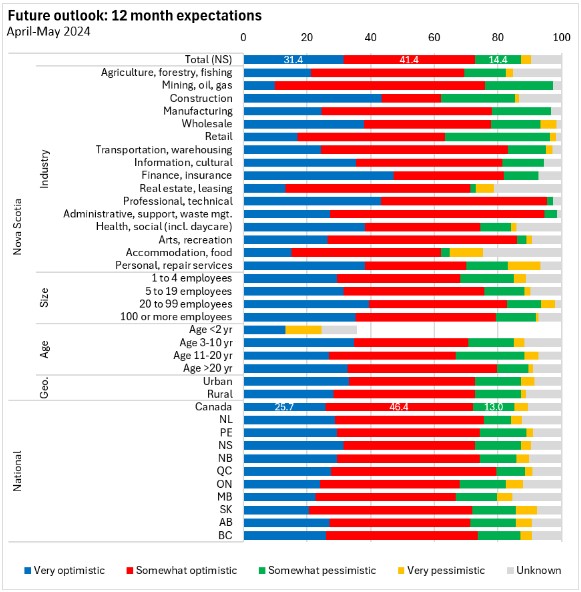
Future outlook over the next 12 months
In Nova Scotia, 31.4% of businesses were very optimistic about the next 12 months; a further 41.4% were somewhat optimistic, 14.4% were somewhat pessimistic and 3.2% were very pessimistic. Business optimism was lower (and pessimism higher) at the national level. The Atlantic Provinces enjoyed more optimistic outlooks.
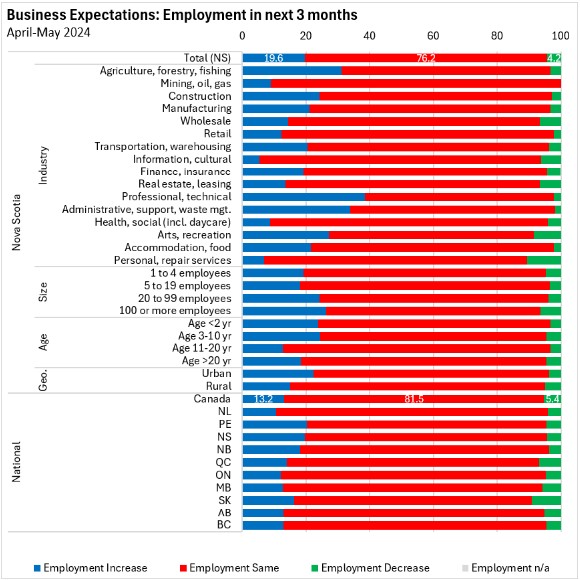
Business expectations for the next three months
The outlook for employment was stable for 76.2% of Nova Scotia businesses in the next three months. Rising employment is expected among 19.6% of Nova Scotia businesses while declining employment is expected by 4.2% of Nova Scotia businesses. Rising employment was most commonly reported by businesses in Nova Scotia's professional/technical services industries.
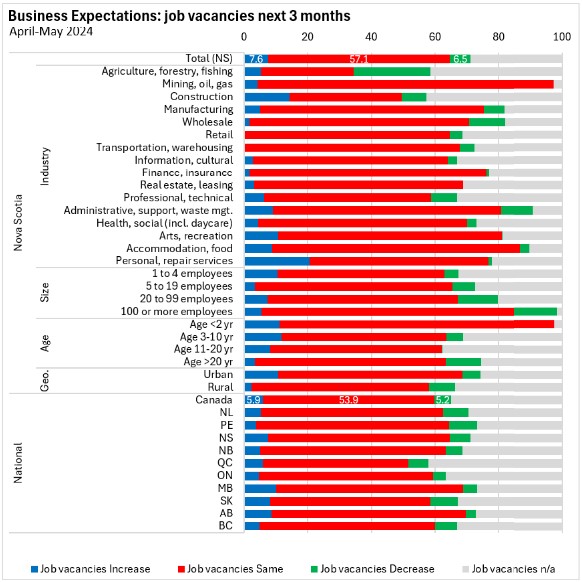
Most businesses in Nova Scotia expect stable job vacancies with similar portions expecting rising and declining job vacancies. Rising vacancies were more widely expected in Nova Scotia's personal/repair services and construction industries while falling vacancies were more widely expected in agriculture, forestry and fishing.
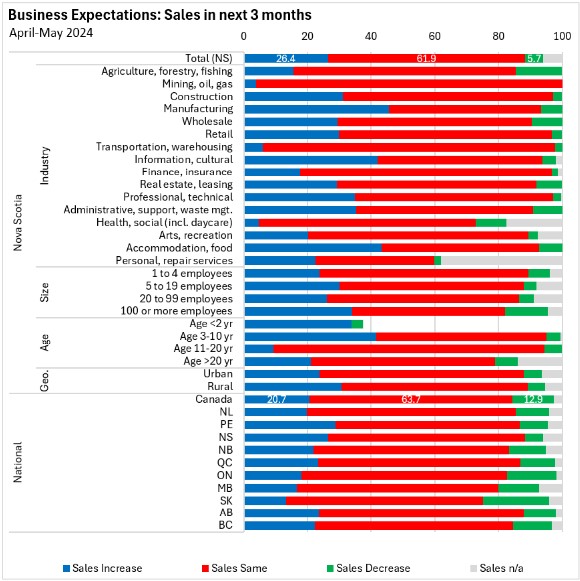
The majority of businesses in Nova Scotia (61.9%) expect stable sales while 26.4% expect rising sales and 5.7% expect declining sales. Rising sales were more likely to be expected among manufacturing, information/culture and accommodation/food businesses.
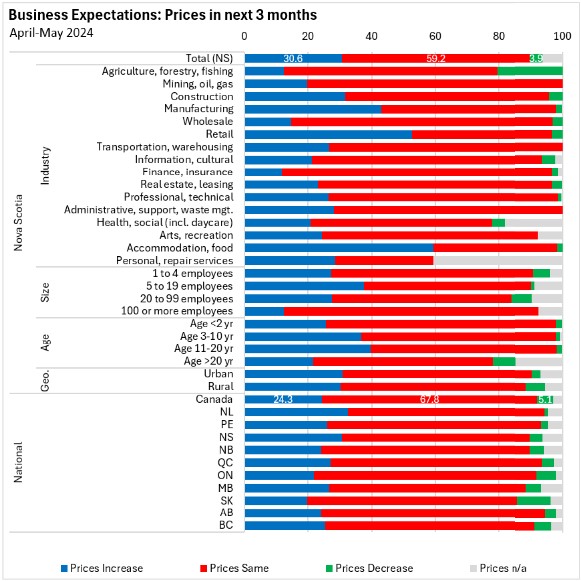
Prices are expected to be stable for 59.2% of Nova Scotia businesses while 30.6% expect rising prices. Only 3.9% of Nova Scotia businesses expect declining prices . Rising prices were more widely expected in Nova Scotia's accommodation/food and retail industries. Falling prices were a more prevalent expectation in agriculture, forestry and fishing businesses.
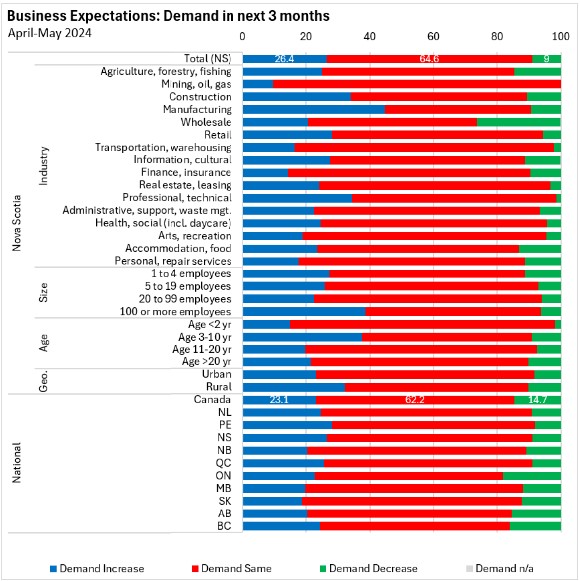
Almost two thirds (64.6%) of Nova Scotia businesses expect stable demand while 26.4% expect increasing demand and 9.0% expect declining demand. Rising demand was more widely expected among manufacturing, construction and professional/technical services businesses.
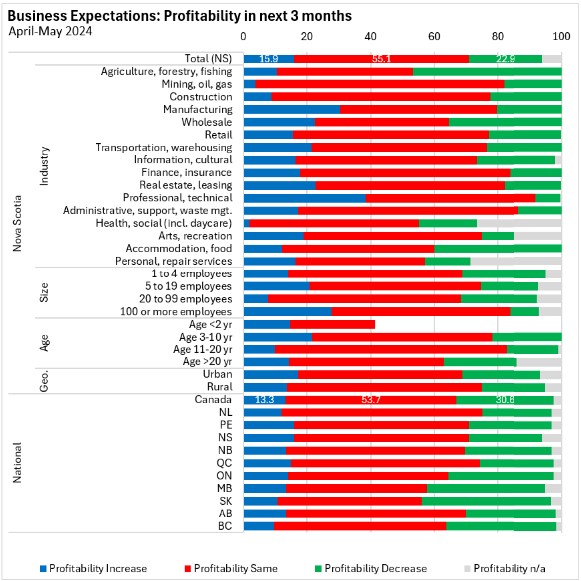
Stable profitability is expected by 55.1% of Nova Scotia businesses. Expectations of falling profitability (22.9%) outweighed expectations of rising profitability (15.9%). Rising profitability was notably more widely expected among professional/technical services and manufacturing businesses. Falling profitability was more widely expected in accommodation and food services food as well as in agriculture, forestry and fishing businesses.
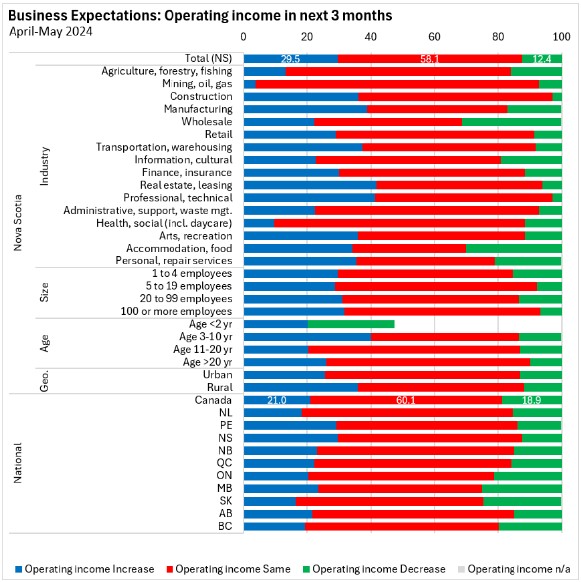
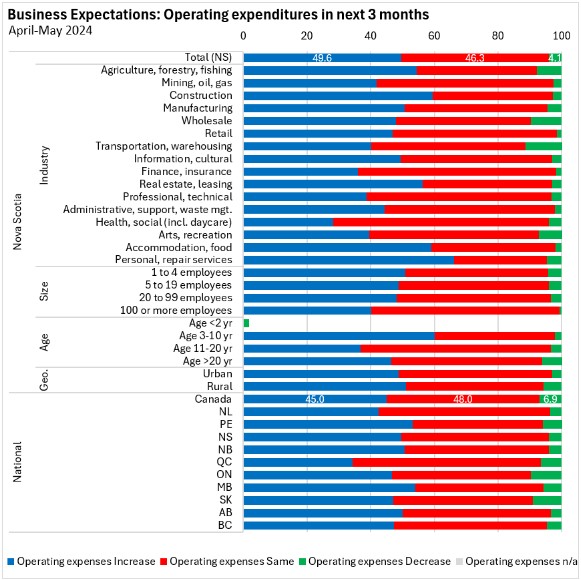
Rising operating income is expected by 29.5% of Nova Scotia businesses but higher operating expenditures are expected by 49.6% of Nova Scotia businesses. Stable operating income is expected by 58.1% of Nova Scotia businesses while stable operating expenditures are expected by 46.3% of Nova Scotia businesses.
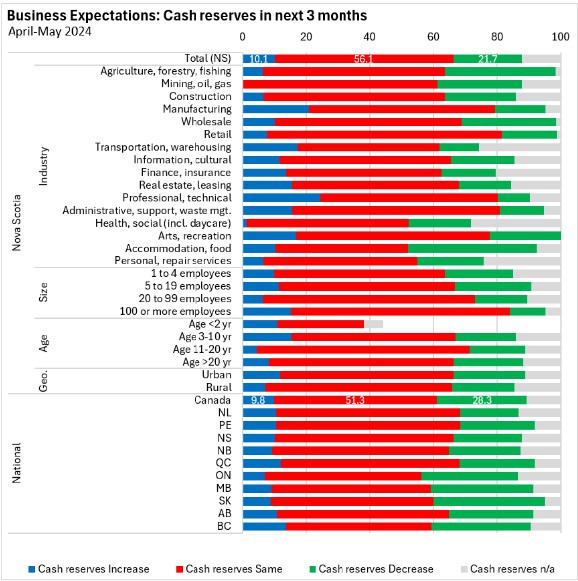
Cash reserves are expected to remain stable for 56.1% of Nova Scotia businesses while 10.1% expect rising cash reservices and 21.7% expect falling cash reserves.
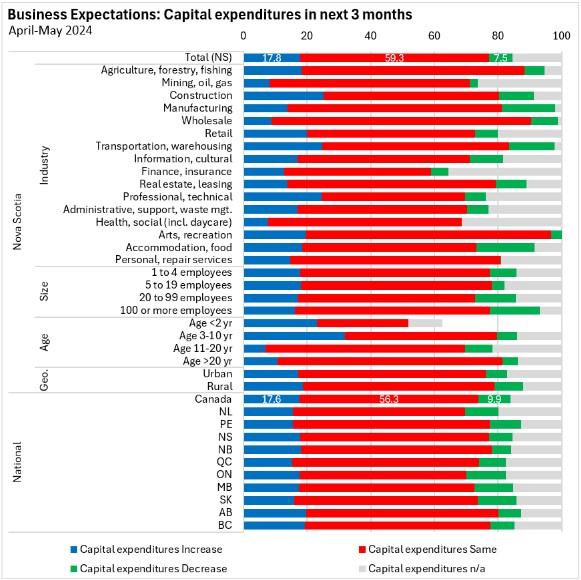
Capital expenditures are expected to be stable for 59.3% of Nova Scotia businesses; rising for 17.8% and falling for 7.5%.
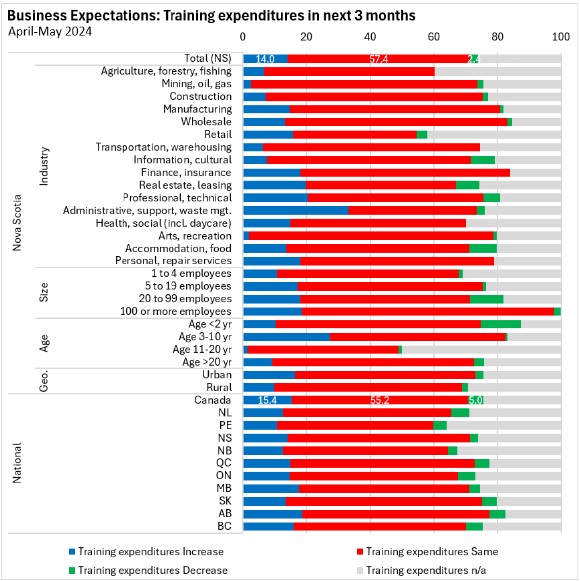
Training expenditures are expected to be stable for 57.4% of Nova Scotia businesses with 14.0% expecting rising training spending (notably: administrative support which includes call centres).
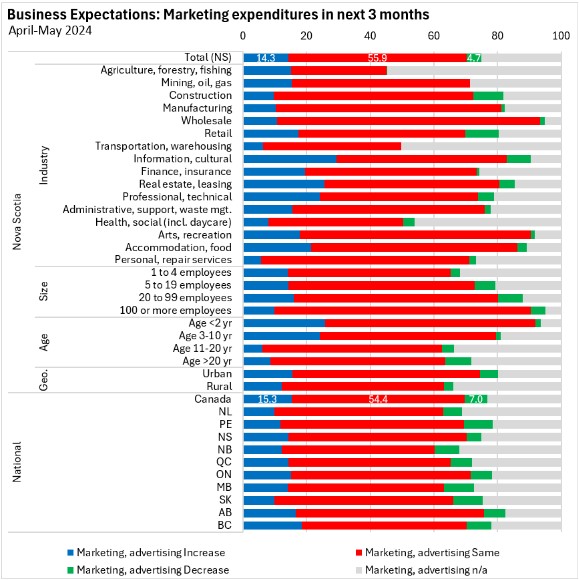
Most businesses in Nova Scotia (55.9%) expect stable marketing expenditures in the next three months while 14.3% expect rising marketing expenditures (particularly in information/culture industries).
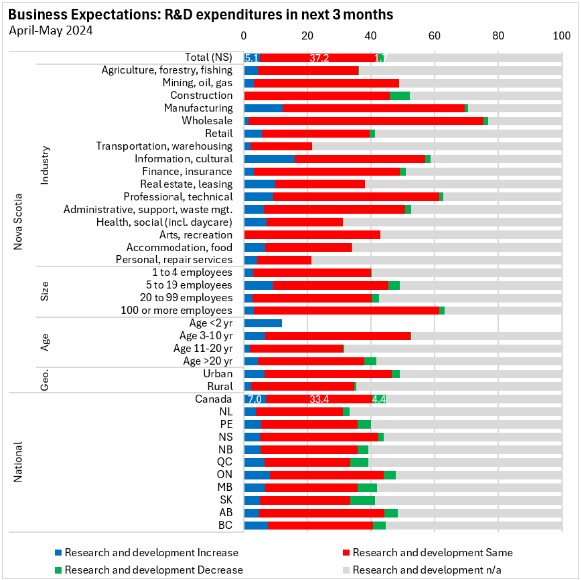
Although research and development (R&D) expenditures are not relevant for the majority of businesses, most businesses that conduct R&D expect stable spending in the next three months.
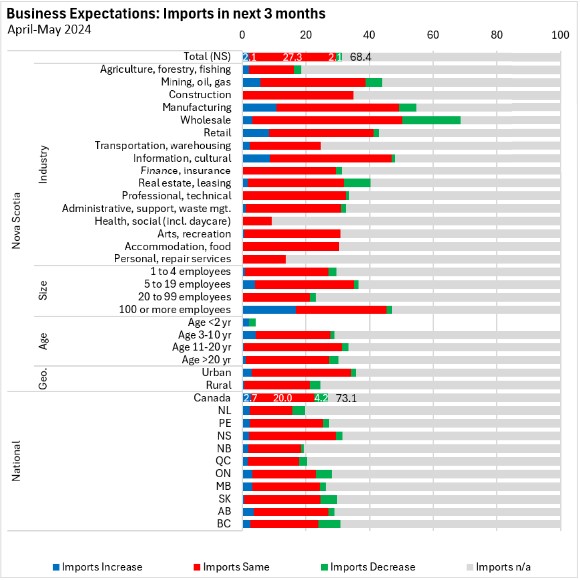
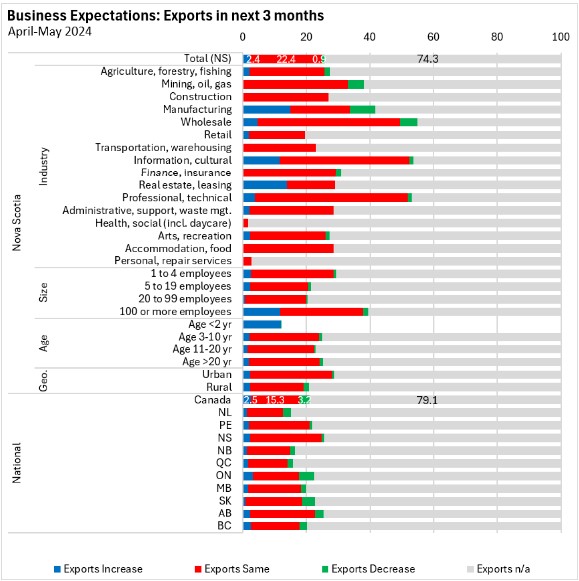
Although few Nova Scotia businesses participate directly in international trade, the majority of these expect stable imports and exports in the next three months.
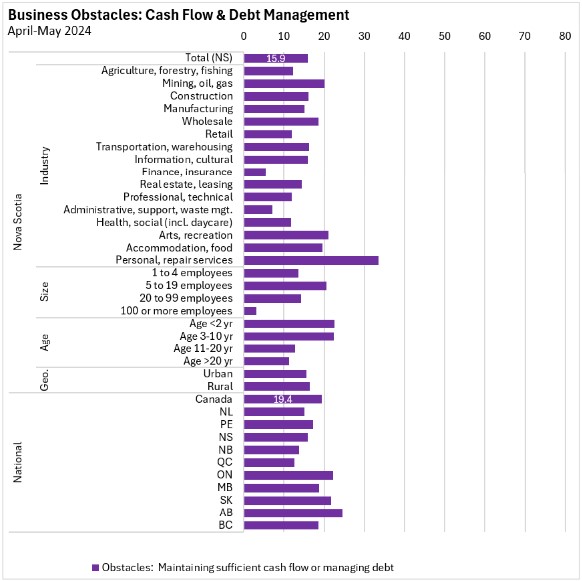
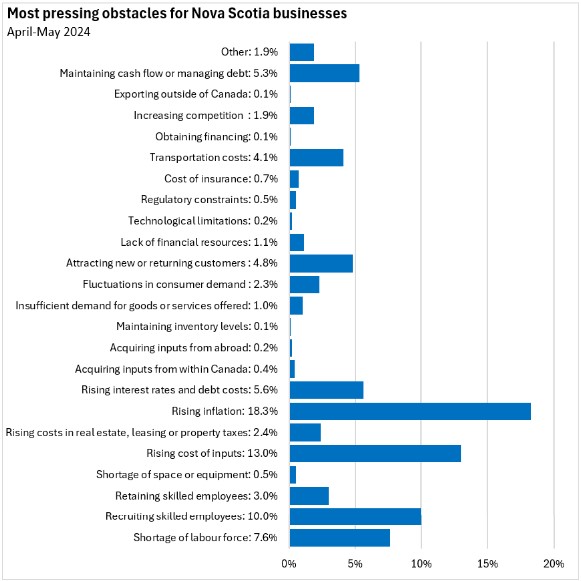
Obstacles for businesses
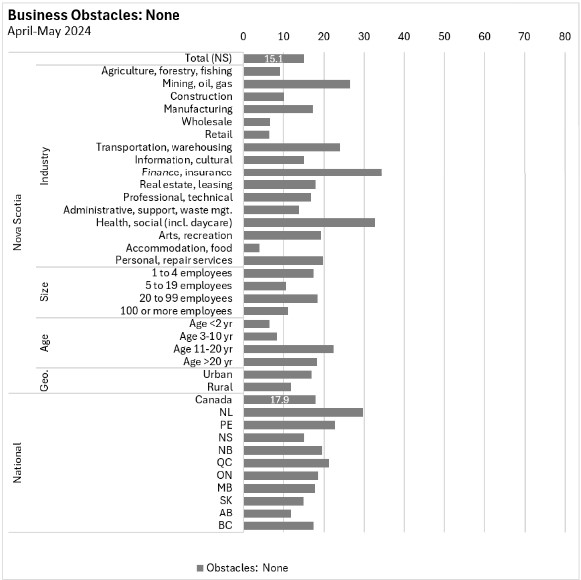
As part of the Survey of Business Conditions, businesses were asked about their obstacles. 15.1% of Nova Scotia businesses reported no substantial obstacles expected in the next three months (down from the previous quarter). Businesses in Nova Scotia's mining, finance/insurance and health/social/daycare services were more likely to report no substantial obstacles. Across Canada, 17.9% of businesses reported no obstacles.
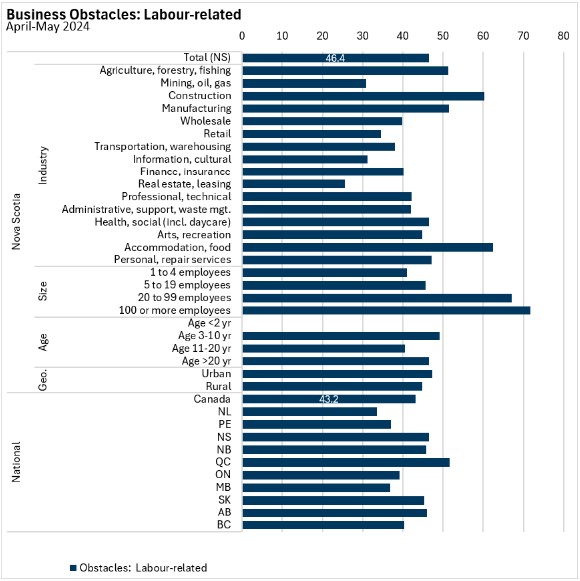
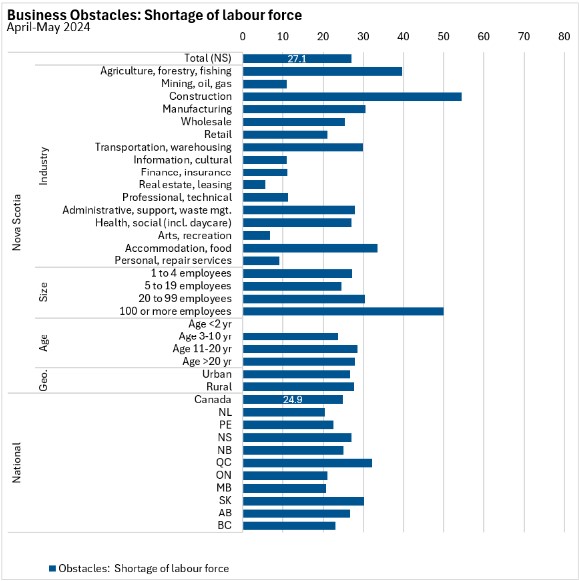
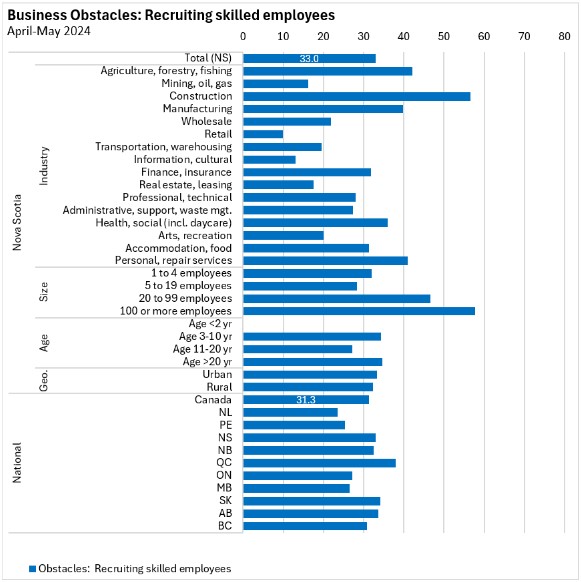
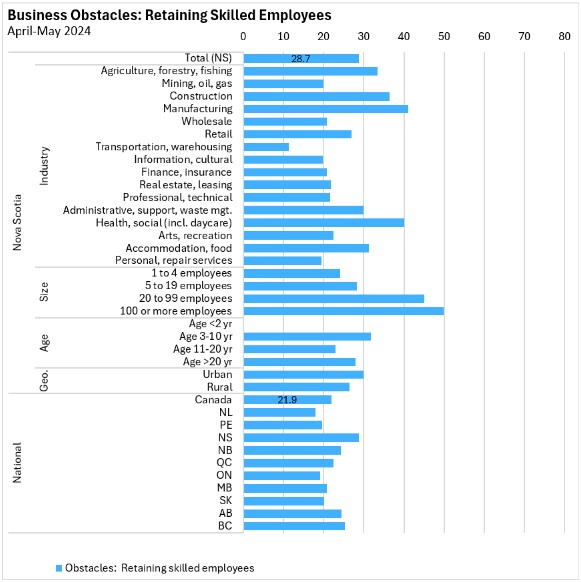
46.4% of Nova Scotia businesses reported some labour-related obstacles, such as labour force shortages as well as recruiting and retaining skilled employees . These were most prevalent in Nova Scotia's construction and accommodation/food services industries as well as among larger employers. Nationally, labour-related obstacles were reported by 43.2% of Canadian businesses, led by businesses in Québec.
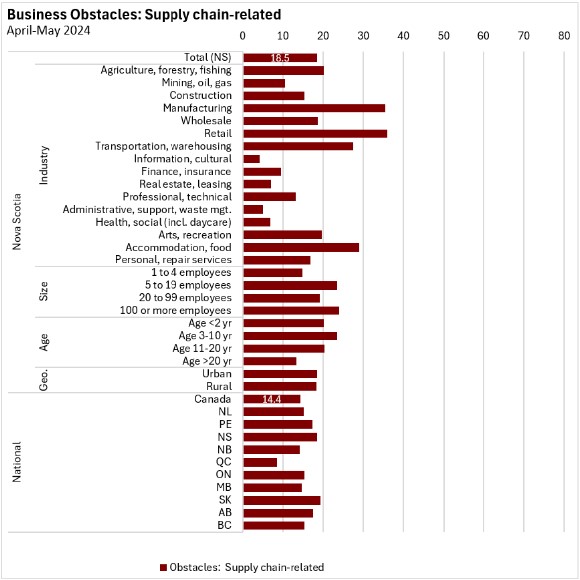
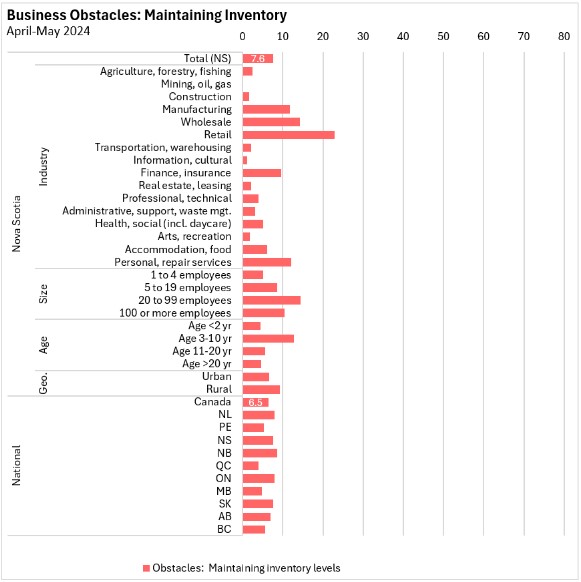
Supply-chain issues were reported as business obstacles by 18.5% of Nova Scotia's businesses, particularly in manufacturing and retail as well as in accommodation/food services. The prevalence of supply chain related obstacles has fallen since 2023 survey results.
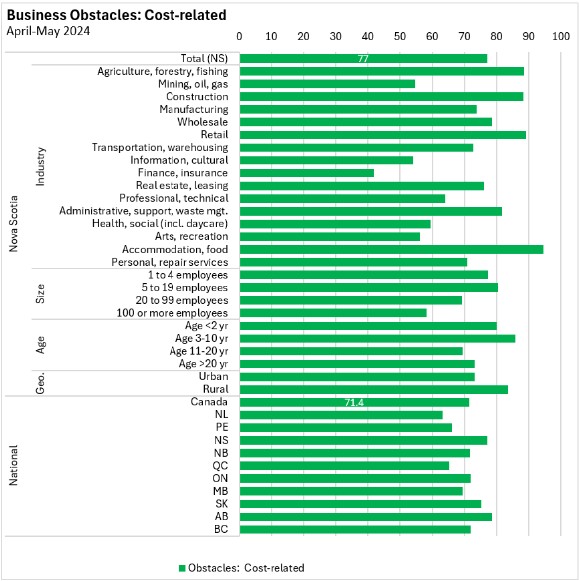
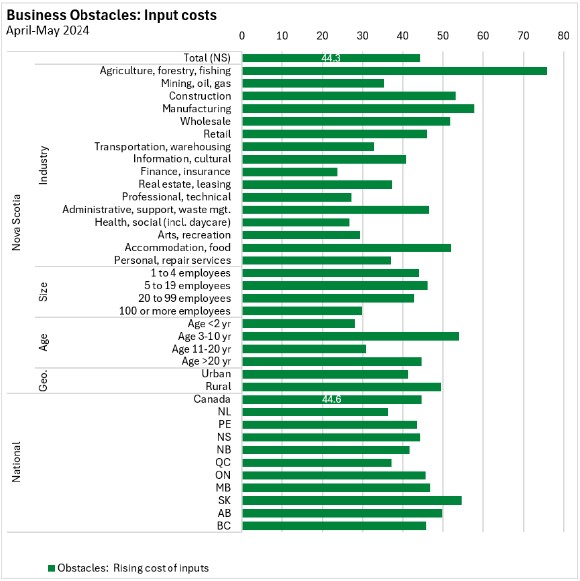
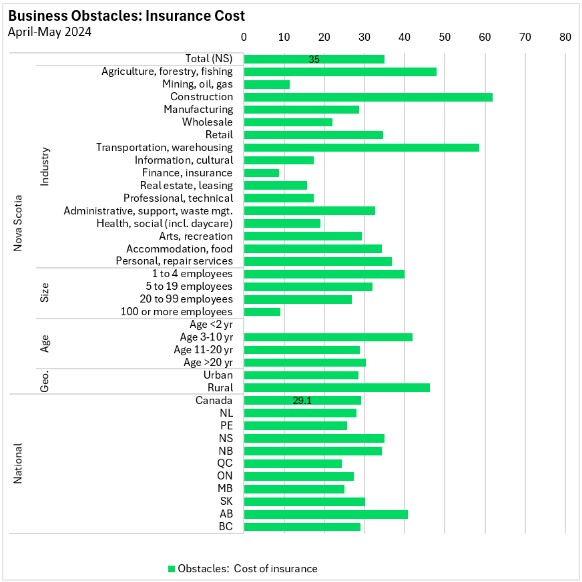
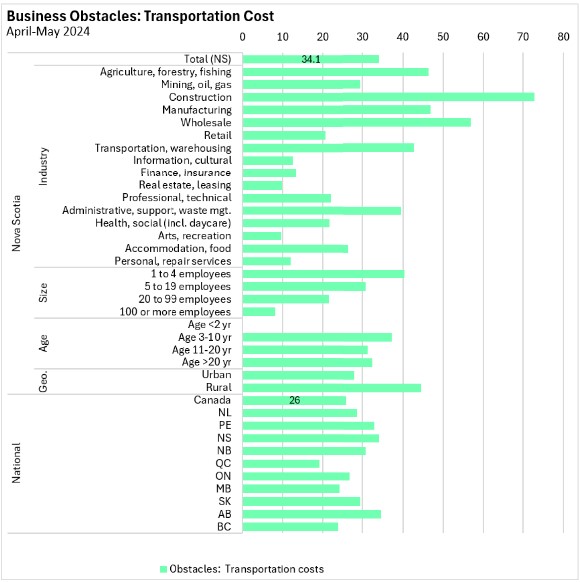
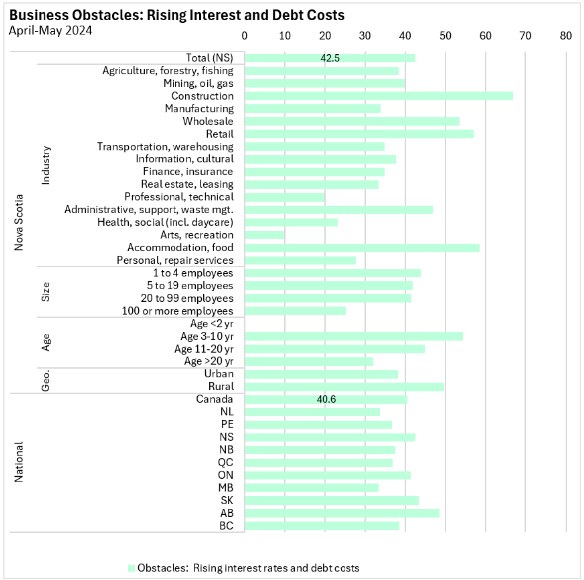
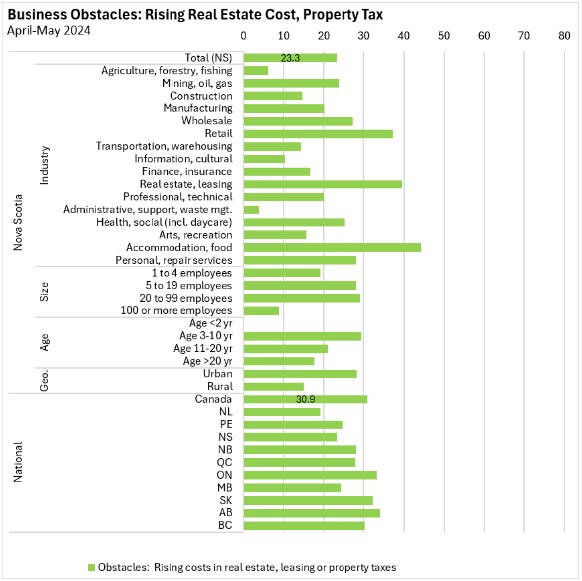
The most acutely-felt obstacles in Q2 2024 were cost-related. This category was reported by 77.0% of Nova Scotia businesses with the largest prevalence in agriculture/forestry/fishing, construction, accommodation and food services as well as retail industries. Input costs and general inflation were the most widely cited obstacles.
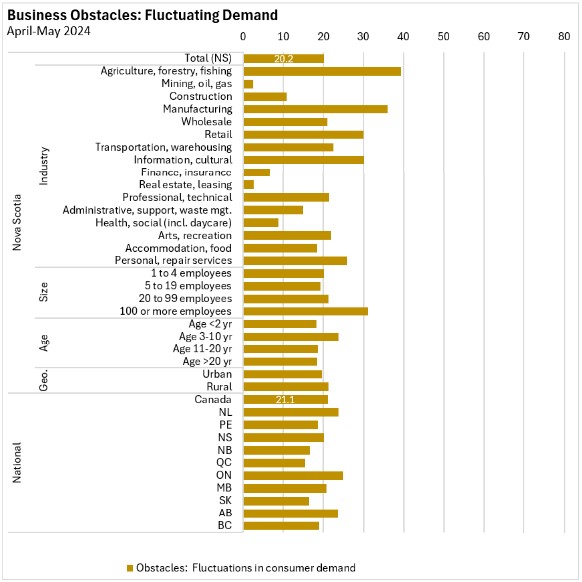
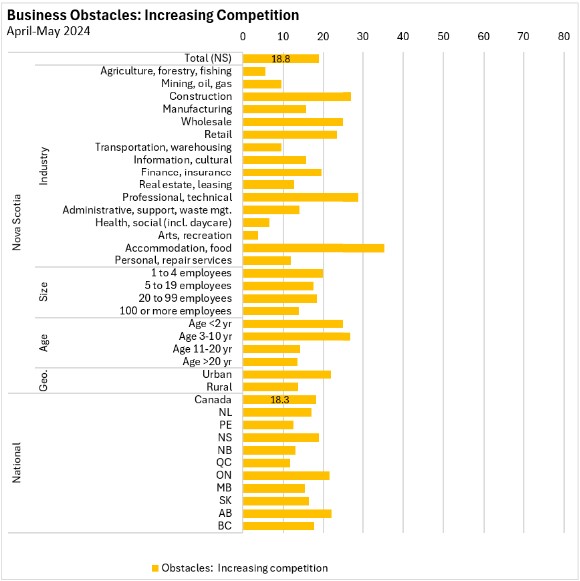
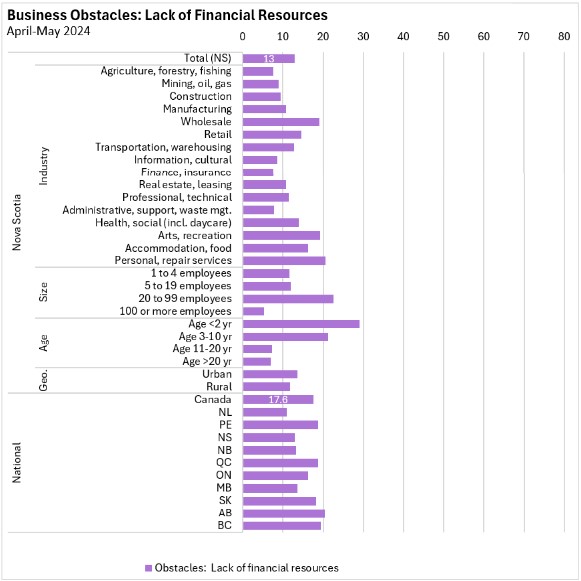
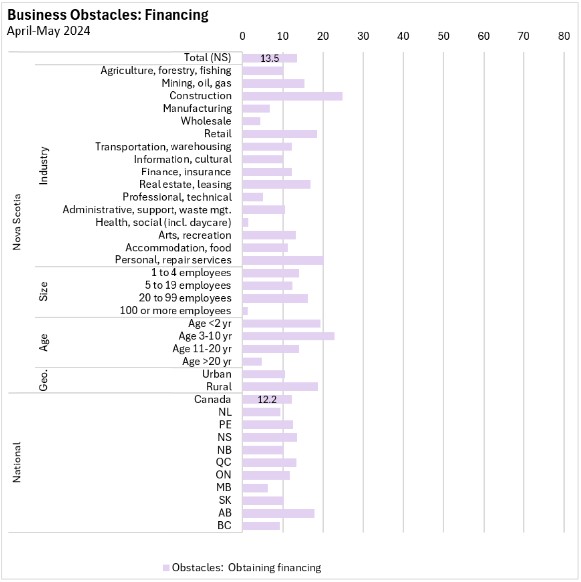
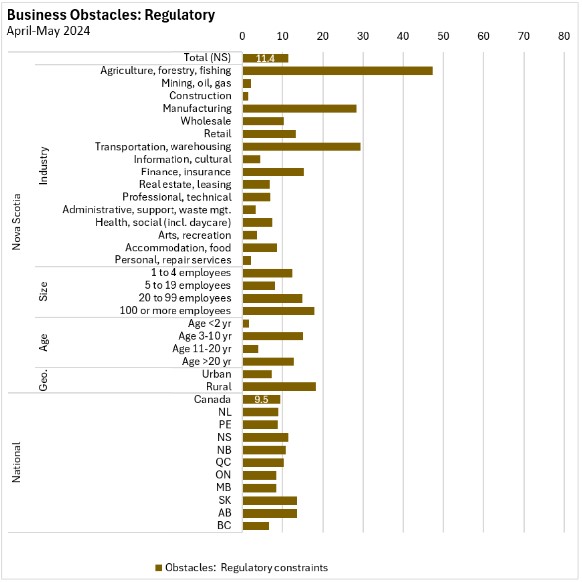
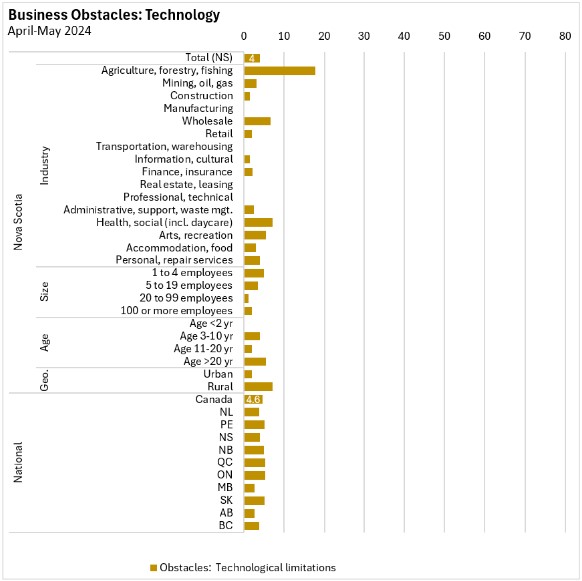
Market conditions, financing, regulatory barriers and technological limitations were less commonly cited obstacles.
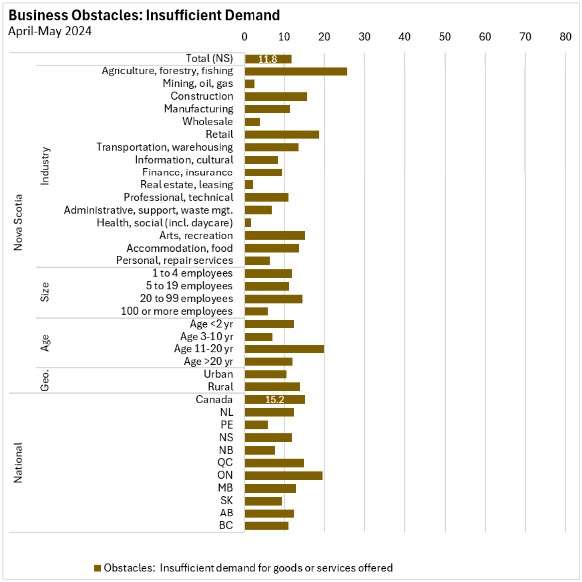
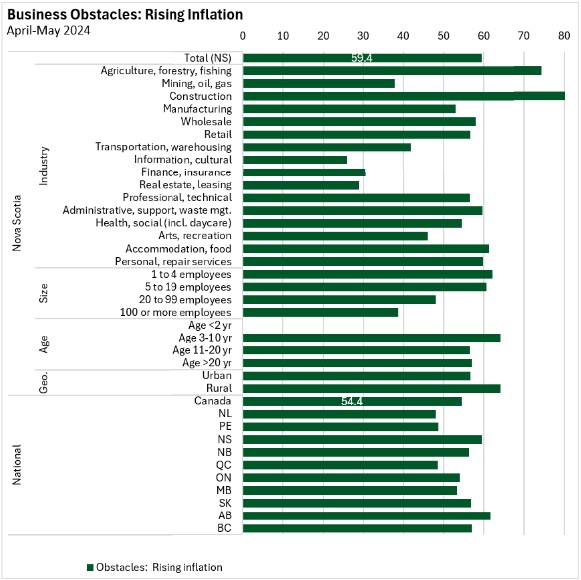
When asked what was the one most pressing obstacle for Nova Scotia businesses (across all industries), rising inflation (18.3%) and input costs (13.0%) were the most widely reported.
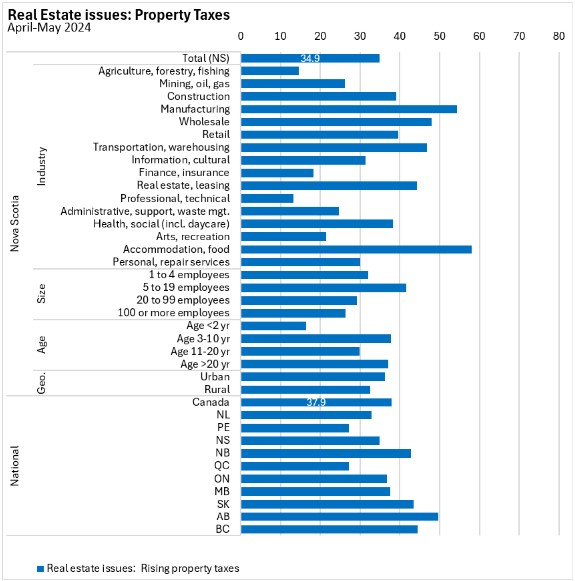
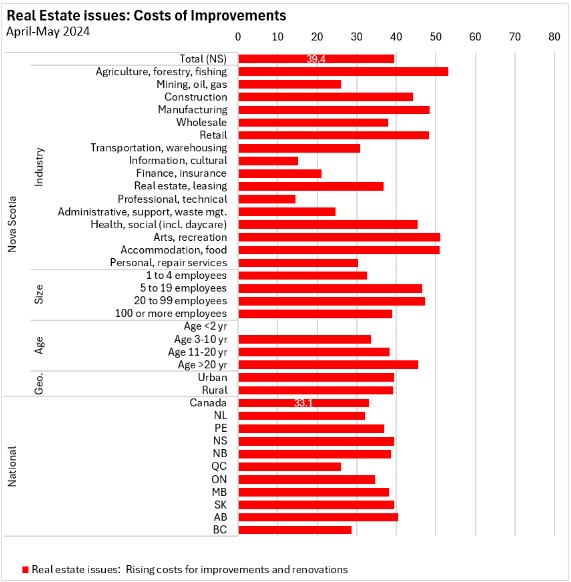
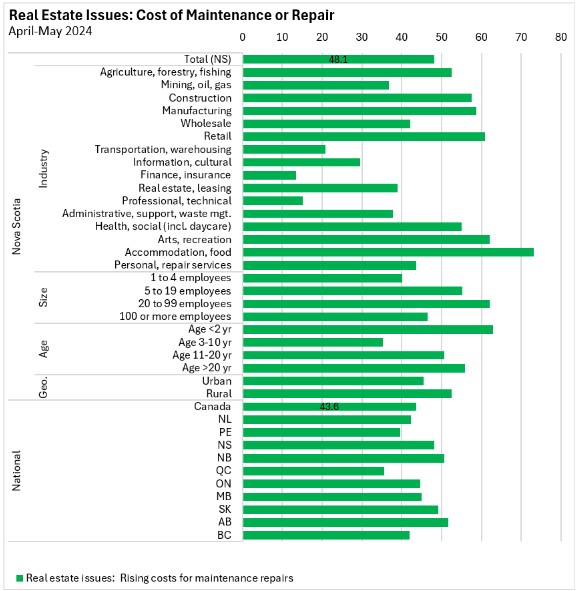
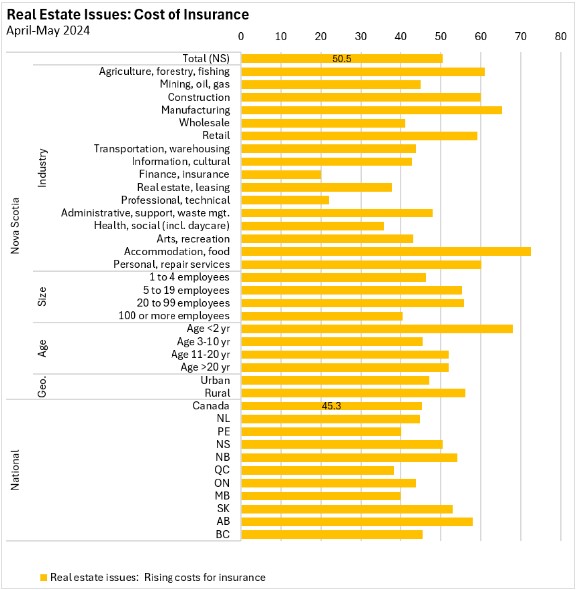
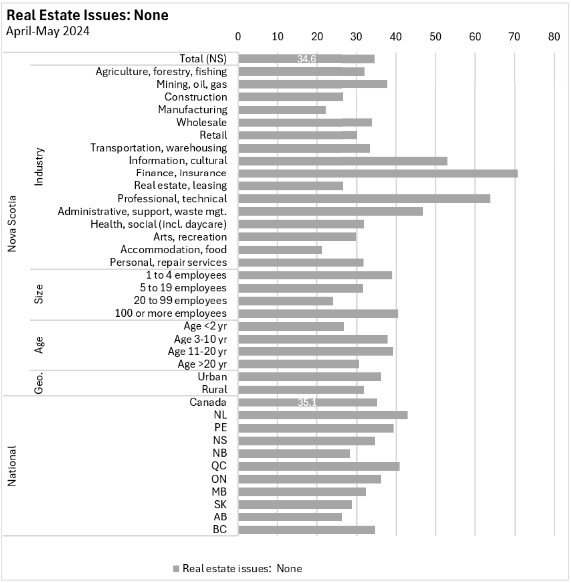
Real estate issues
Respondents to the Q2 survey were asked about real estate issues. In Nova Scotia
- 34.9% of businesses reported issues with rising property taxes
- 39.4% of businesses reported issues with rising costs of improvements and renovations
- 48.1% reported issues with rising costs of maintenance/repair
- 50.5% reported issues with rising real estate insurance costs
- 34.6% reported no real estate issues
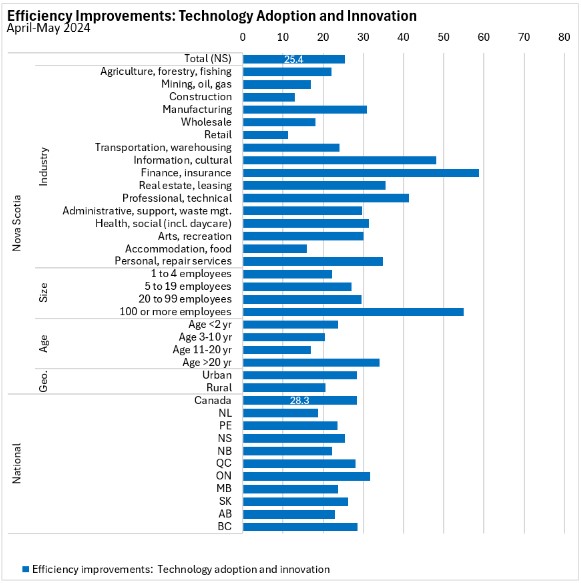
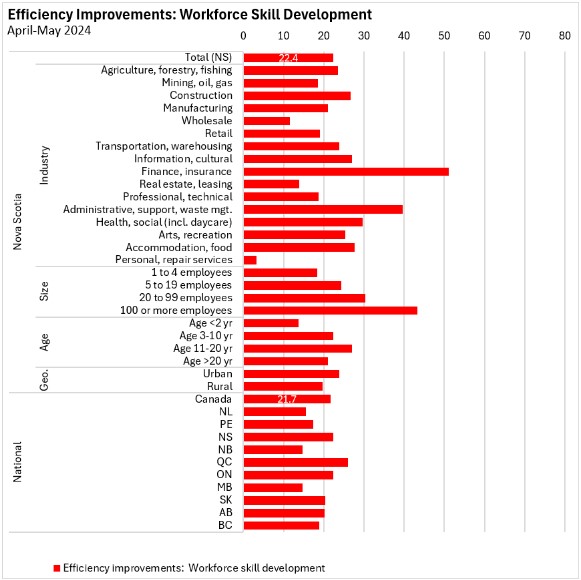
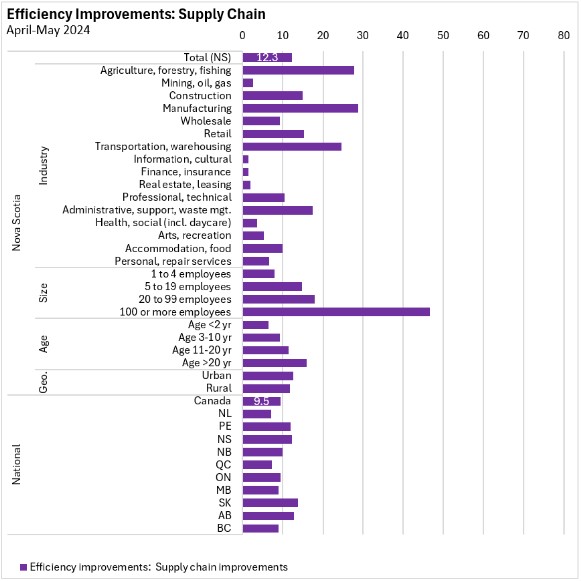
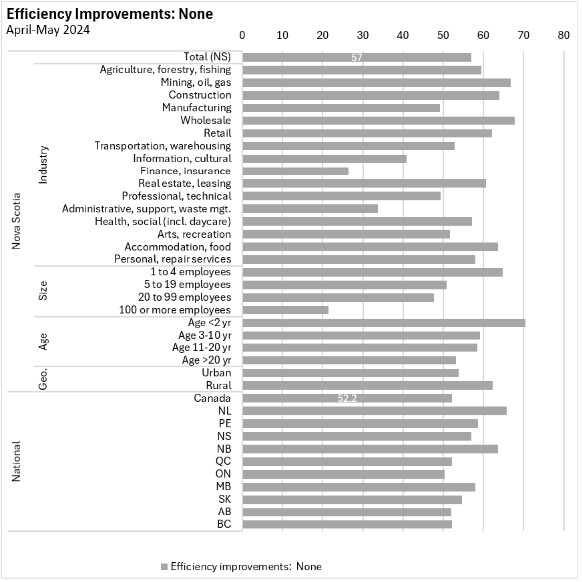
Efficiency improvements
Businesses in the Q2 2024 iteration of the Survey on Business Conditions were asked about their efficiency improvements in the last 12 months. In Nova Scotia, 57.0% of businesses reported no efficiency improvements in the past 12 months.
Technology adoption and innovation were cited as the source of efficiency improvements for 25.4% of Nova Scotia businesses while 22.4% cited workforce development as the source of efficiency improvements and 12.3% cited supply chain improvements. Smaller (<10%) portions of Nova Scotia businesses cited efficiency improvements from better global economic conditions (5.8%), market research (3.6%) and regulatory improvements (2.6%).
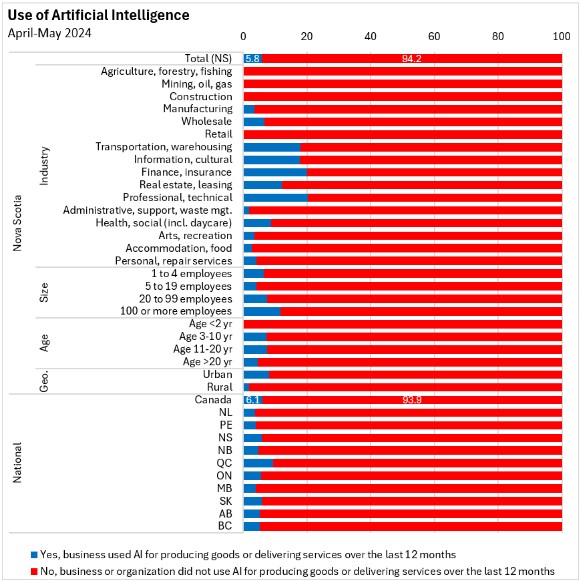
Artificial intelligence
The vast majority of Nova Scotia businesses (94.2%) made no use of artificial intelligence in producing output. Artificial intelligence was somewhat more widely used in transportation, information/culture, finance/insurance, real estate/leasing and professional/technical services businesses.
Natural disaster and weather events
Businesses were asked whether natural disaster and weather events had had an impact on their operations, the extent of that impact and their level of preparedness for further natural disasters and weather related impacts.
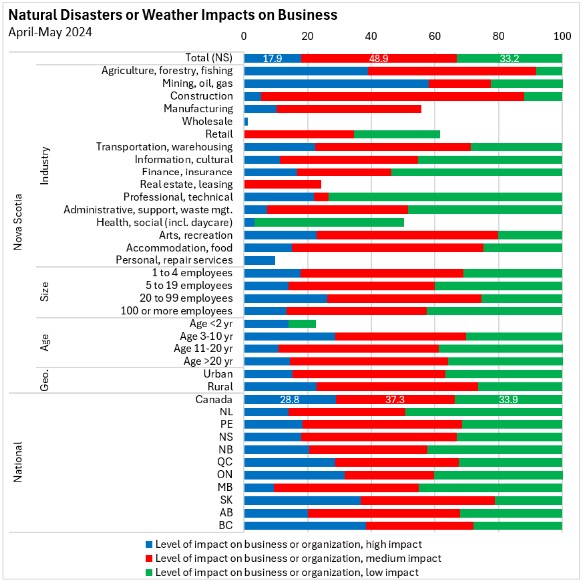
Over one-third of Nova Scotia businesses (37.6%) reported some natural disaster or weather related impacts. The most widely affected industries were finance/insurance, accommodation/food services, arts/recreation, agriculture/forestry/fishing and manufacturing.
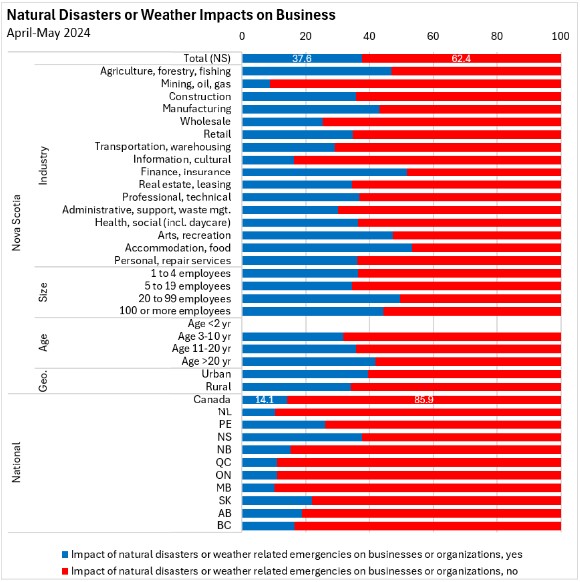
Of weather and natural disaster-affected businesses, two-thirds (66.8%) reported moderate or high impacts. High impacts were more commonly reported among resource extraction industries.
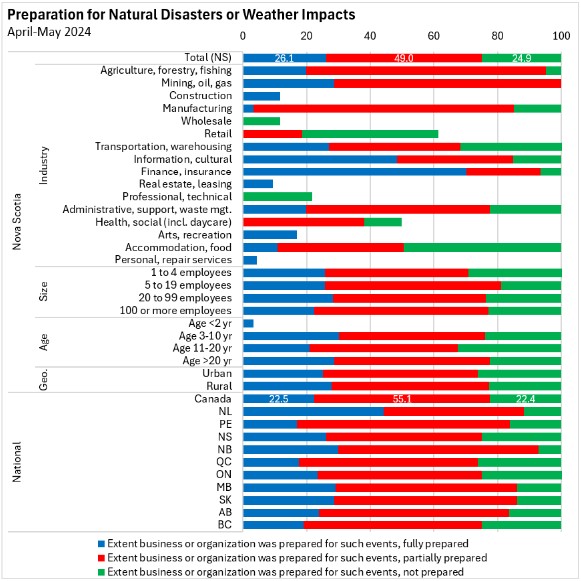
About half (49.0%) of Nova Scotia businesses feel partially prepared for weather or natural disaster-related impacts. A further 26.1% feel fully prepared while 24.9% feel unprepared.
Source: Statistics Canada. Table 33-10-0837-01 Future outlook over the next 12 months, second quarter of 2024; Table 33-10-0755-01 Business or organization expectations over the next three months, second quarter of 2024; Table 33-10-0809-01 Business or organization obstacles over the next three months, second quarter of 2024; Table 33-10-0810-01 Most challenging obstacle expected by the business or organization over the next three months, second quarter of 2024; Table 33-10-0818-01 Real estate issues businesses or organizations are currently facing, second quarter of 2024; Table 33-10-0819-01 Aspects that improved the ability of business or organization to operate efficiently over the last 12 months, second quarter of 2024; Table 33-10-0825-01 Use of artificial intelligence by businesses and organizations in producing goods or delivering services over the last 12 months, second quarter of 2024; Table 33-10-0830-01 Impact of natural disasters or weather related emergencies on businesses or organizations over the last 12 months, second quarter of 2024
<--- Return to Archive