The Economics and Statistics Division maintains archives of previous publications for accountability purposes, but makes no updates to keep these documents current with the latest data revisions from Statistics Canada. As a result, information in older documents may not be accurate. Please exercise caution when referring to older documents. For the latest information and historical data, please contact the individual listed to the right.
<--- Return to Archive
For additional information relating to this article, please contact:
May 30, 2024PAYROLL EMPLOYMENT AND AVERAGE WEEKLY EARNINGS, MARCH 2024 Monthly (March 2024 vs February 2024, seasonally adjusted)
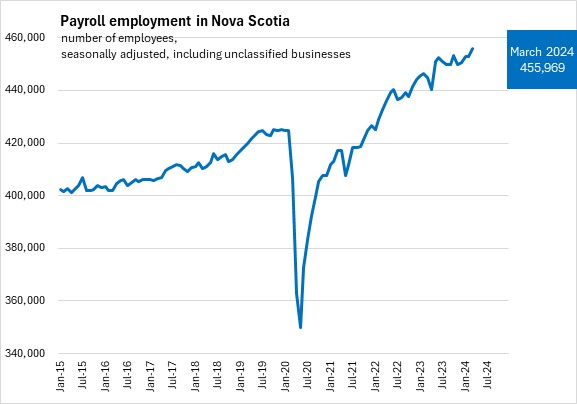
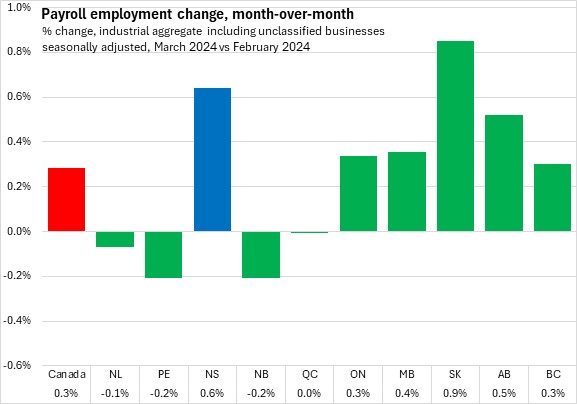
Nova Scotia had 455,969 payroll employees in March 2024, up 0.6% (+2,898) compared to February 2024. Canada had 18.16 million employees, up 0.3% from February 2024. There were gains in six provinces, led Saskatchewan. The largest declines were reported in Prince Edward Island and New Brunswick.
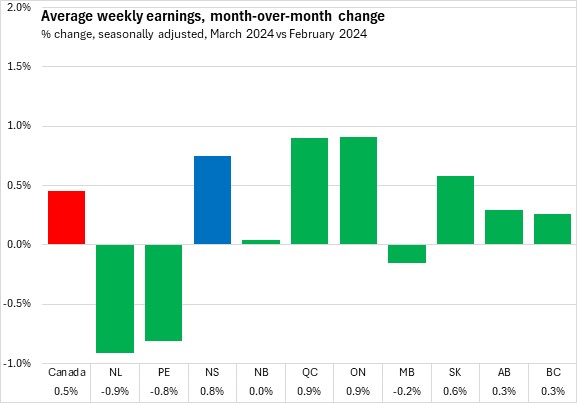
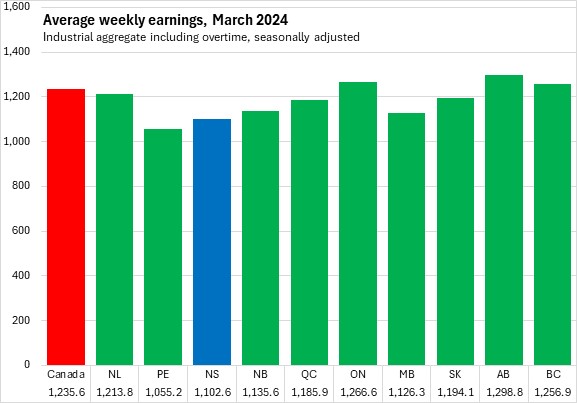
Nova Scotians' average weekly earnings were $1,102.67 in March of 2024, an increase of $8.22 (+0.8%) from revised February 2024 results.
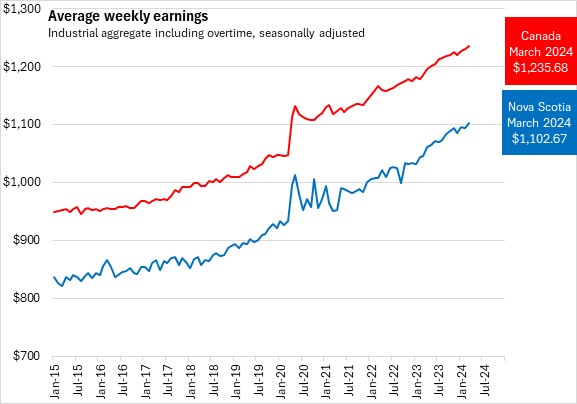
Nationally, average weekly earnings were $1,235.68, an increase of 0.5% (+$5.63) from average weekly earnings in February 2024. Seven provinces reported gains in average weekly earnings, with the largest gains in Ontario and Quebec. The largest declines were in Newfoundland and Labrador and Prince Edward Island.
Nova Scotia's average weekly earnings in March 2024 were second lowest among provinces (ahead of only Prince Edward Island). Alberta reported the highest average weekly earnings.
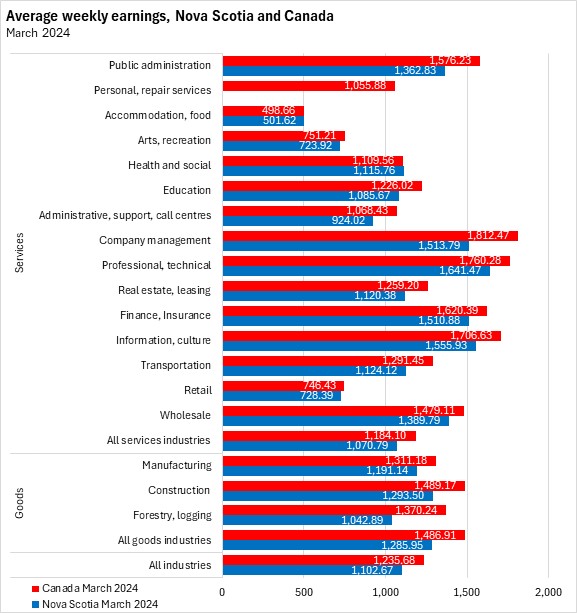
Nova Scotia's average weekly earnings were highest in professional and technical services, information and culture, company management, and finance and insurance industries. The lowest average weekly earnings were reported in Nova Scotia's accommodations and food service industries, arts, entertainment and recreation, and retail trade.
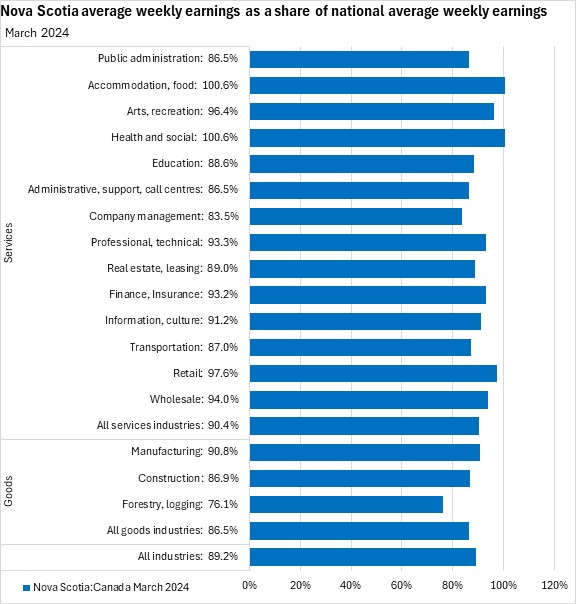
In March 2024, Nova Scotia's average weekly wages were 89.2% of the national average. Nova Scotia average weekly wages were below the comparable national average for every industry except health/social assistance services and accommodation/food services. The smallest gaps were in retail trade, arts/entertainment/recreation, and wholesale trade. The largest gap was in forestry/logging (76.1% of the national average).
Year-over-year (March 2024 vs March 2023)
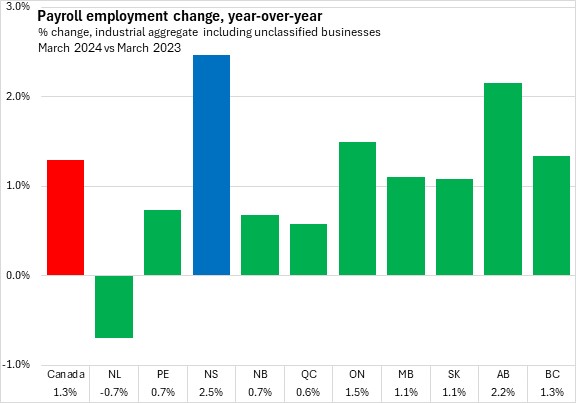
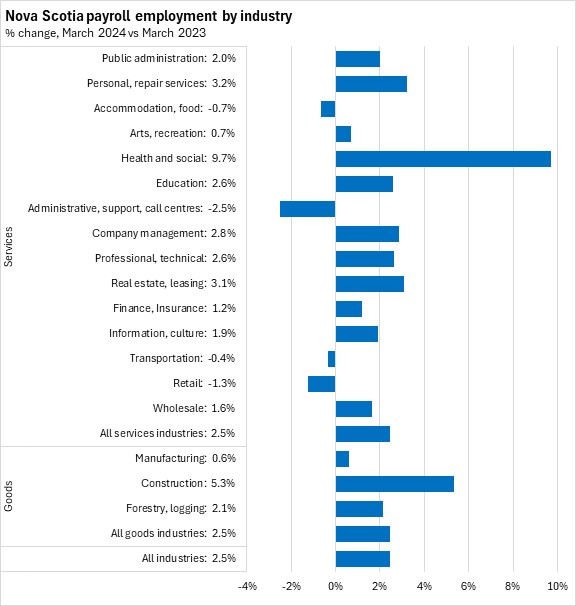
Compared with the same month in 2023, Nova Scotia's payroll employment grew by 2.5% (+11,000) in March 2024. This was higher than the national average gain of 1.3%. All provinces reported growth in payroll employment except Newfoundland and Labrador, with the fastest gains in Nova Scotia and Alberta.
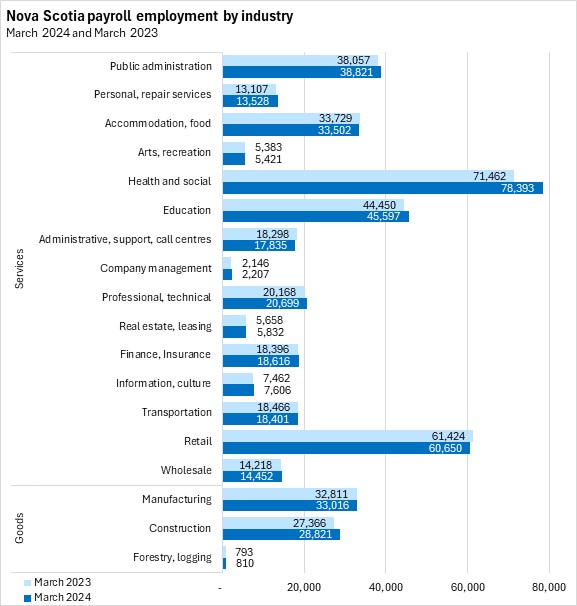
Among the industries reported by Statistics Canada, Nova Scotia's largest industries of employment were health care/social assistance (which includes daycares), followed by retail trade and education.
Health care/social assistance as well as construction had the fastest year-over-year growth in payroll employment in Nova Scotia. Administrative support/call centres reported the largest percentage decline in payroll employment.
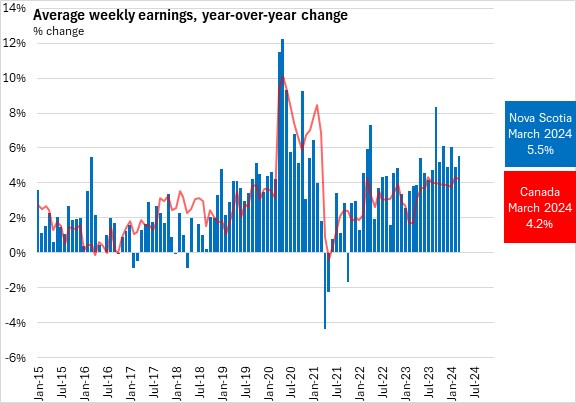
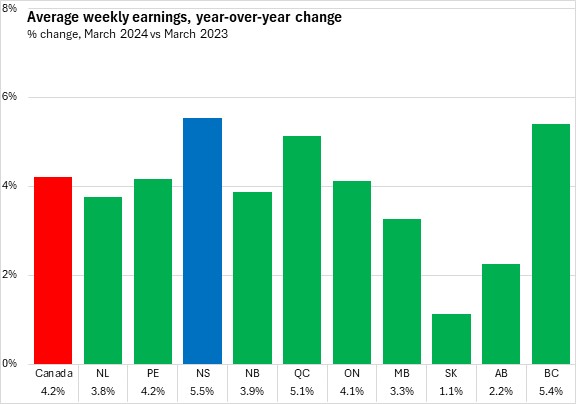
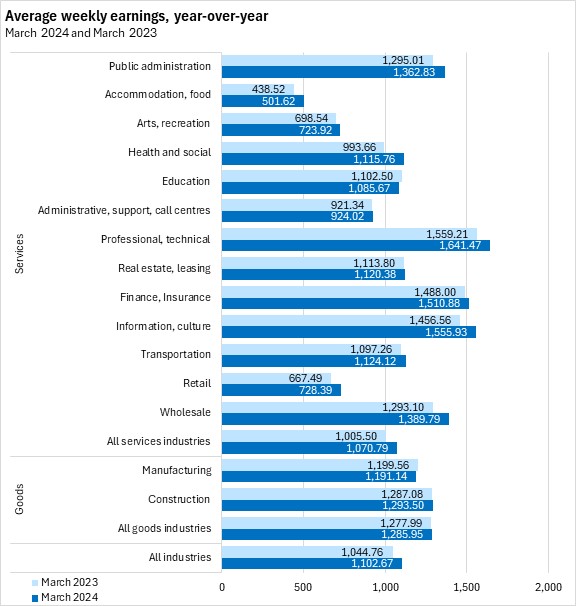
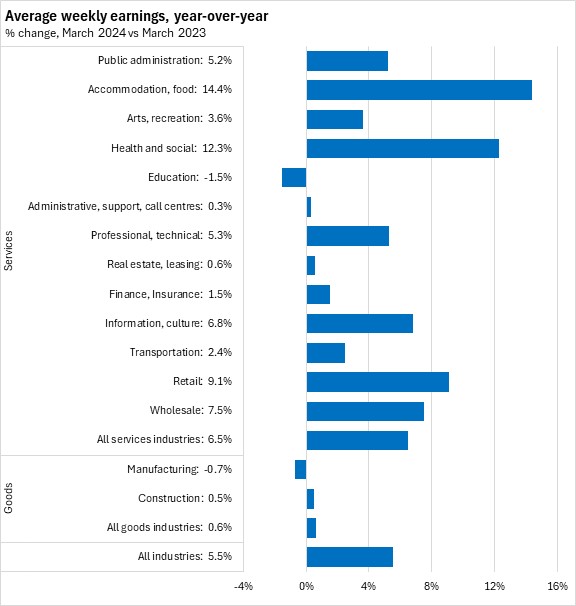
Average weekly wages grew by 5.5% in Nova Scotia from March 2023 to March 2024. This was stronger than the national pace of 4.2%.
Average weekly wages grew by 4.2% across Canada from March 2023 to March 2024. There were gains in each province, with the fastest rise in Nova Scotia and British Columbia. Saskatchewan and Alberta reported the slowest gains.
Average weekly wages were up 0.6% in Nova Scotia's goods-producing industries and up 6.5% in Nova Scotia's services-producing industries. Most of the industries reported year-over-year growth in average weekly wages with the largest increases in accommodation/food services as well as health/social assistance and retail trade. Average weekly wages were down in education and manufacturing industries.
Year-to-date (January-March 2024 vs January-March 2023)
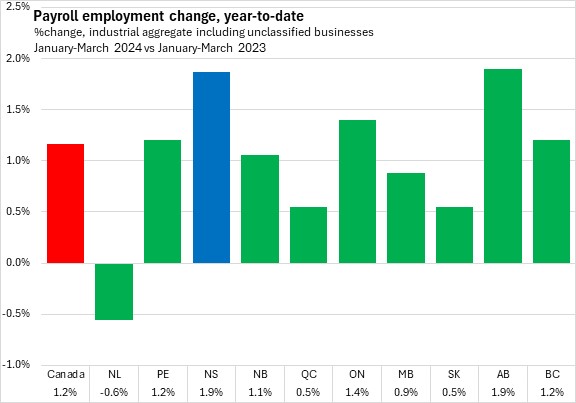
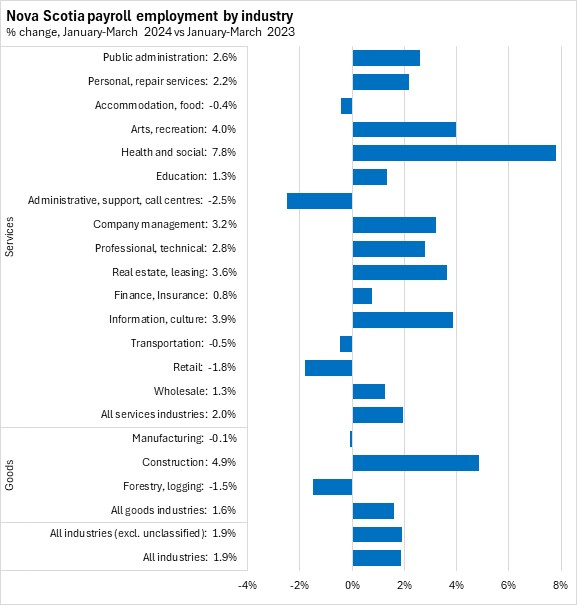
In January-March 2024, Nova Scotia's payroll employment increased 1.9% over January-March 2023. Across Canada, payroll employment growth was 1.2% with gains in all provinces except Newfoundland and Labrador. Nova Scotia and Alberta reported the fastest rise in payroll employment.
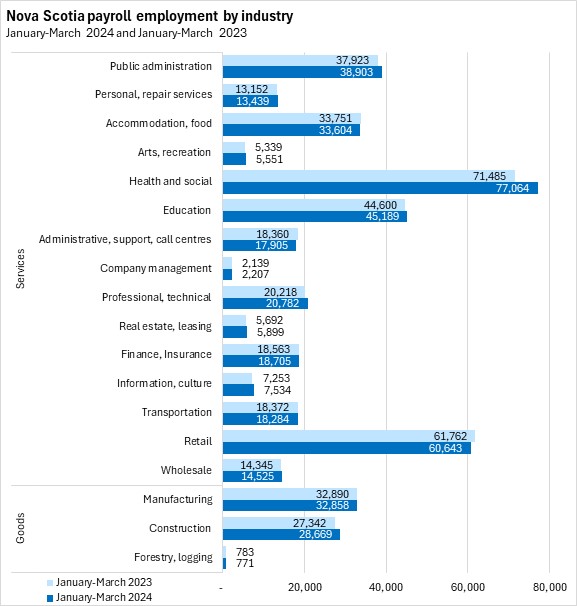
In January-March 2024, health/social assistance as well as construction, arts/entertainment/recreation, and information/culture industries reported the fastest employment growth in percentage terms compared to the same period in 2023. Administrative support/call centres and retail trade reported the largest percentage declines.
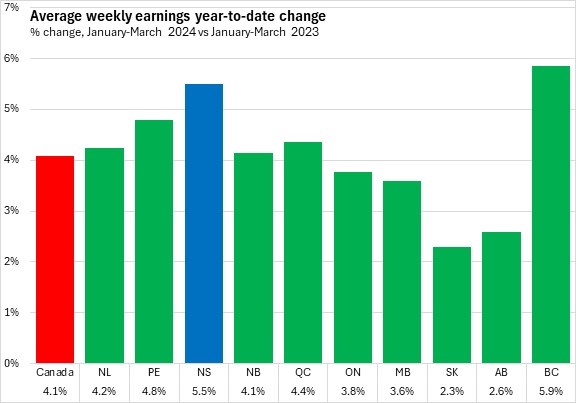
In January-March 2024, Nova Scotia's average weekly earnings increased by 5.5% compared to the same period in 2023. National average weekly earnings were up 4.1% in the first three months of the year with gains in all provinces. British Columbia, Nova Scotia, and Prince Edward Island reported the fastest gains in average weekly earnings while Alberta and Saskatchewan reported the slowest rise.
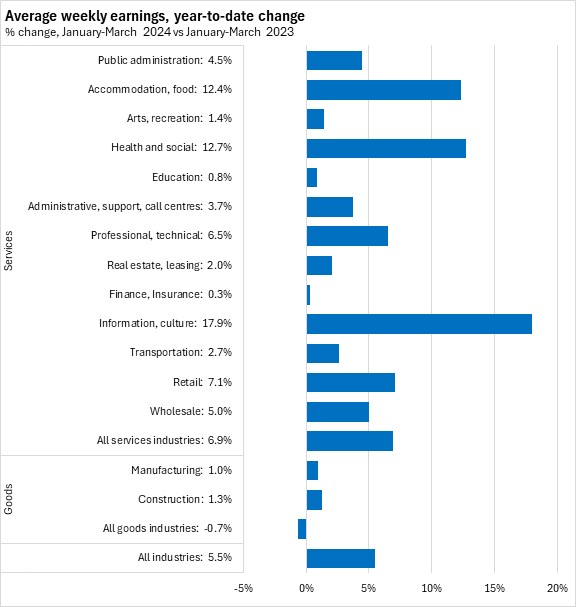
In January-March 2024, information/culture, health/social assistance, and accommodation/food services reported the fastest percentage gains in average weekly earnings compared to the same period in 2023. The slowest rise was in finance/insurance services.

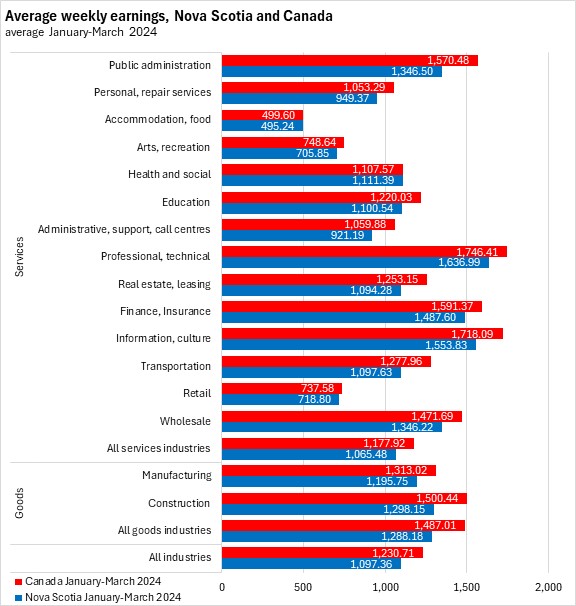
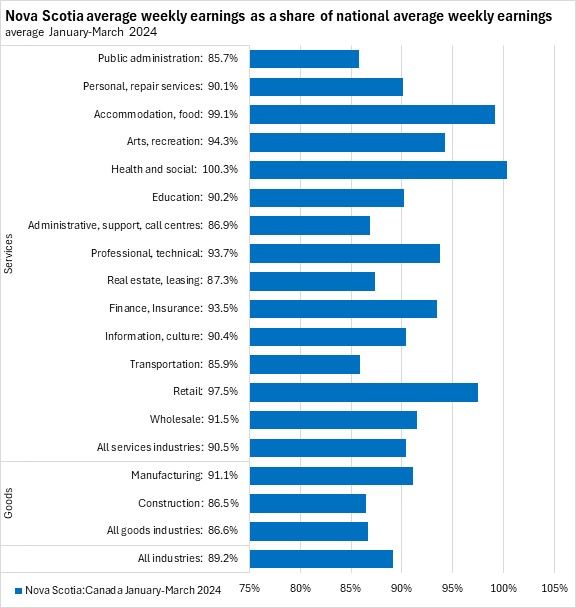
In January-March 2024, Nova Scotia's average weekly earnings were highest in professional and technical services industries. Nova Scotians' average weekly earnings averaged 89.2% of the national value for all industries in January-March 2024. All Nova Scotia industries reported average weekly earnings below their national counterparts except health/social assistance. The gaps were narrowest in accommodation/food services as well as retail trade. Public administration and transportation workers in Nova Scotia reported the largest gaps in average weekly earnings compared with the national average for the industry.
Source: Statistics Canada. Table 14-10-0222-01 Employment, average hourly and weekly earnings (including overtime), and average weekly hours for the industrial aggregate excluding unclassified businesses, monthly, seasonally adjusted; Table 14-10-0223-01 Employment and average weekly earnings (including overtime) for all employees by province and territory, monthly, seasonally adjusted
<--- Return to Archive