The Economics and Statistics Division maintains archives of previous publications for accountability purposes, but makes no updates to keep these documents current with the latest data revisions from Statistics Canada. As a result, information in older documents may not be accurate. Please exercise caution when referring to older documents. For the latest information and historical data, please contact the individual listed to the right.
<--- Return to Archive
For additional information relating to this article, please contact:
February 19, 2025LIFE SATISFACTION AND QUALITY OF LIFE, Q4 2024 Statistics Canada has updated and expanded data about how Canadians perceive their quality of life. This information is collected as part of the Canadian Social Survey, conducted from October-December 2024. National data does not include any results from the Territories.
This survey reports on Canadians' overall satisfaction with life, sense of meaning and purpose, hopeful future outlook, loneliness, having someone on whom to depend on when needed, sense of belonging to community, satisfaction with time use, satisfaction with local environment, confidence in institutions, trust in people and experiences of discrimination. Results are stated as the share of the population reporting. Not all indicators of quality of life were surveyed in each period.
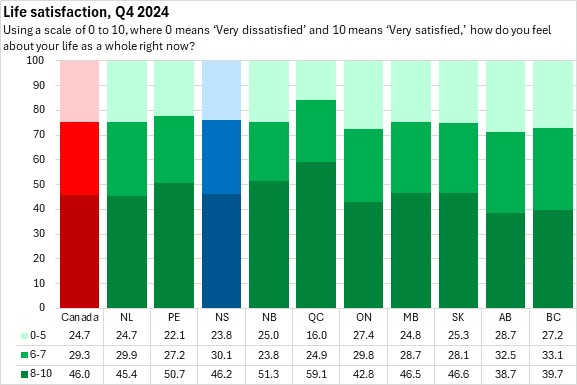
Life satisfaction
In Nova Scotia, 46.2% of respondents rated their life satisfaction in the most satisfied categories (8-10) while 30.1% rated their life satisfaction at moderate levels (6-7) and 23.8% responded with the least satisfied categories (0-5).
Across Canada, 46.0% of the respondents were in the most satisfied categories while 24.7% were in the least satisfied categories. High life satisfaction (8-10) was most prevalent in Québec while it was least prevalent in Alberta. Low life satisfaction was most prevalent in Alberta and least prevalent in Québec.
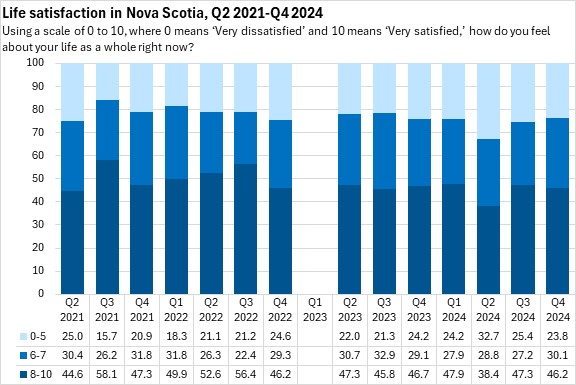
In Nova Scotia, life satisfaction has been trending down in recent years. There was a notable deterioration in reported life satisfaction in Q2 2024, but this has recovered partilly in the last two quarters.
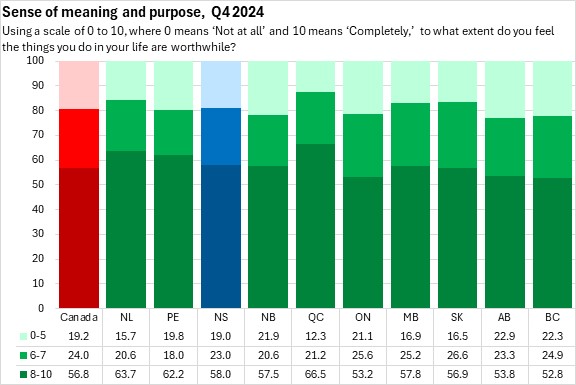
Sense of Meaning and Purpose
In Nova Scotia, 58.0% of respondents replied in the three strongest categories (8-10) for sense of meaning and purpose. Across Canada, 56.8% reported the strongest sense of meaning and purpose. The highest share of respondents in these categories were in Québec while the lowest share of respondents in these categories were in British Columbia, Alberta and Ontario.
19.0% of Nova Scotians responded that their sense of meaning and purpose in the things they do in life were in the lowest categories (0-5). The national average response in the lowest categories was 19.2% with weak sense of meaning and purpose most prevalent in Alberta and British Columbia (least prevalent in Québec).
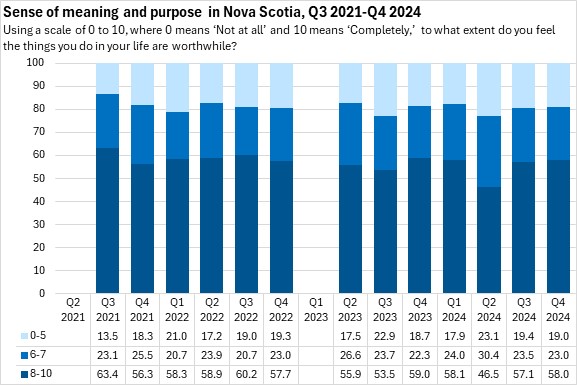
In Nova Scotia, sense of meaning and purpose declined in Q2 2024 before recovering in Q3 and Q4.
Hopeful Outlook for the Future
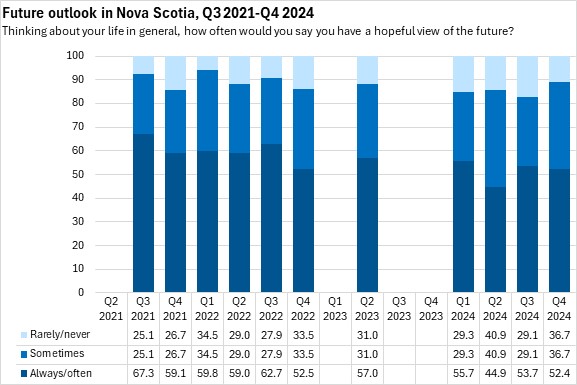
52.4% of Nova Scotians reported feeling hopeful about the future always or often while 10.9% of Nova Scotians rarely or never felt hopeful about the future. Nationally, 56.3% of Canadians always or often felt hopeful about the future while 12.5% rarely or never felt hopeful about the future. Respondents in New Brunswick and Alberta had the highest prevalence of rarely/never feeling hopeful about the future. Respondents in Québec were most likely to report always having a hopeful outlook for the future.
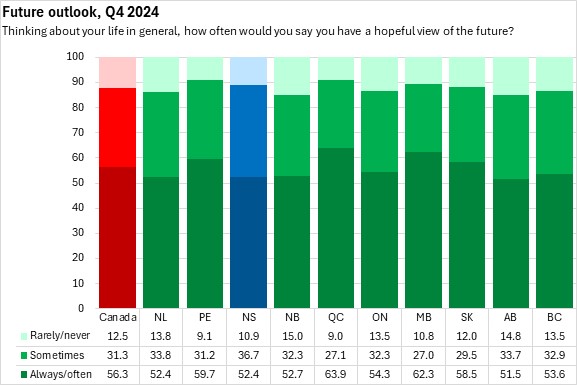
The prevalence of a hopeful outlook has eroded in recent years, though there was some improvement in Q3 and Q4 2024.
Loneliness
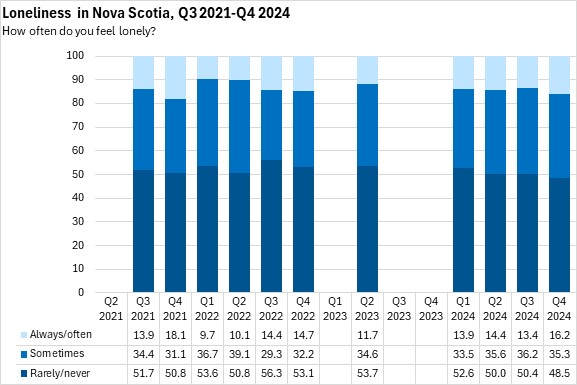
In Nova Scotia, 48.5% of the population reported rarely or never feeling lonely. A further 35.3% reported feeling lonely sometimes while 16.2% reported feeling lonely often or always.
Nationally, 49.7% of the population are rarely or never lonely, 36.9% are lonely sometimes and 13.4% are often or always lonely. The share of the population that are rarely or never lonely was highest in Québec and lowest in Manitoba and Prince Edward Island. The share of the population reporting frequent loneliness was highest in Prince Edward Island (followed by Nova Scotia) and lowest in Newfoundland and Labrador.
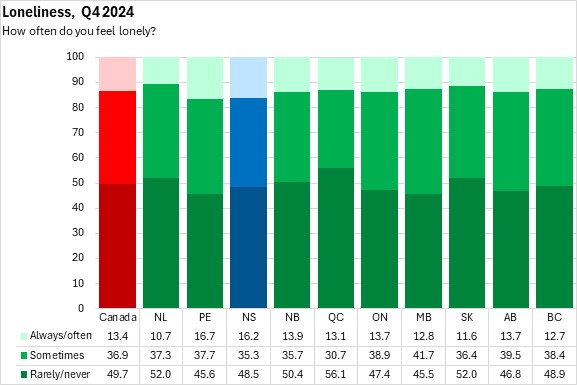
Over the last 3 quarters, there has been some increase in Nova Scotia's share of the population that feelings of loneliness.
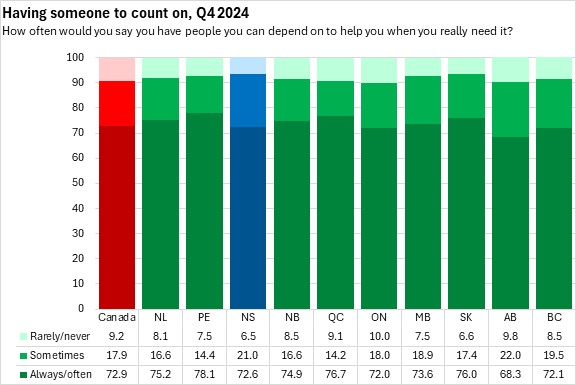
Someone to Depend on When Needed
In Nova Scotia, 72.6% of the population felt they always or often had someone on whom to depend when needed while 21.0% sometimes had someone on whom to depend. Across Canada, 72.9% of respondents felt they always or often had someone upon whom to depend (highest: Prince Edward Island; lowest: Alberta).
6.5% of Nova Scotians felt they rarely or never had someone upon whom to depend - the lowest such prevalence among provinces (closely followed by Saskatchewan). Nationally 9.2% of the population rarely/never has someone on whom to depend (highest: Ontario).
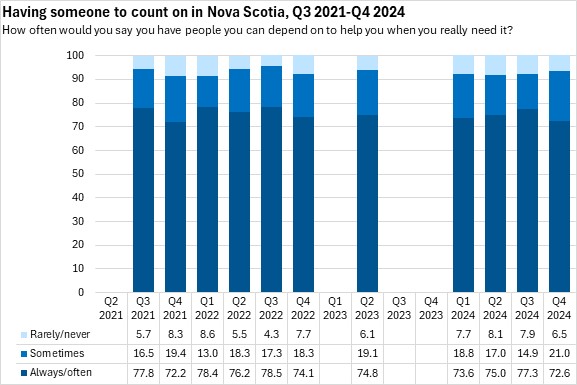
At one point, Nova Scotians were among the most likely to report always or often having someone upon whom to depend. This eroded from 2022-2024, and improved in Q2 and Q3. In the most recent data, there was a notably increase in the share of the population that indicated sometimes having someone upon whom to depend.
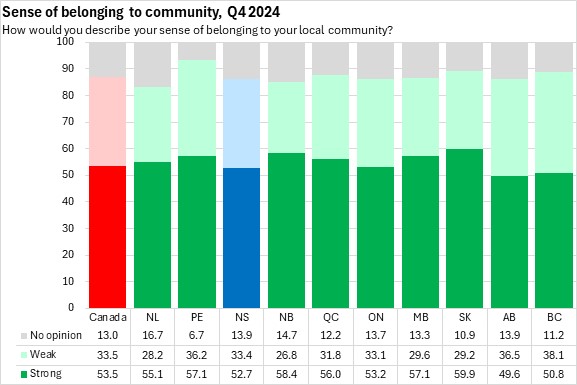
Sense of Belonging to Community
In Nova Scotia 52.7% of respondents indicated a somewhat or very strong sense of belonging to their community - below the national average of 53.5% of Canadians. Only Alberta and British Columbia reported a lower share of respondents than Nova Scotia with a strong or very strong sense of belonging to community.
In Nova Scotia, 33.4% of respondents reported a somewhat or very weak sense of belonging to community - similar to the national average of 33.5%. Residents of British Columbia, Alberta and Prince Edward Island reported more widespread weakness in sense of belonging to community.
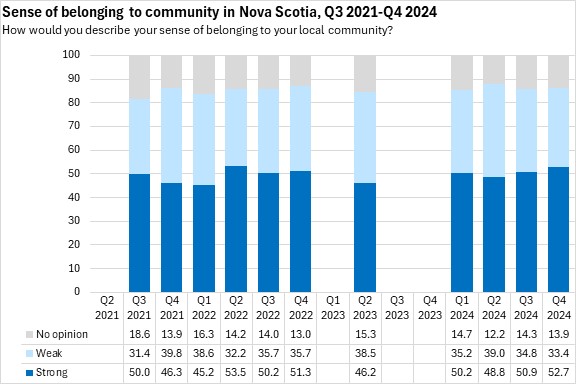
Nova Scotia's sense of belonging to community declined from Q4 2022 to Q2 2023, it has recovered partially in the last two quarters.
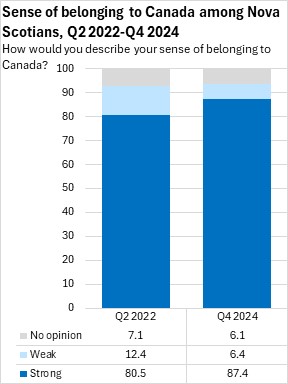
Sense of belonging to Canada
In Nova Scotia 87.4% of respondents felt a strong or very strong sense of belonging to Canada, the highest prevalence among provinces. Nationally, 80.2% of Canadians felt a strong or very strong sense of belonging to Canada. The lowest prevalence of a strong sense of belonging to Canada was reported in Québec (73.4%).
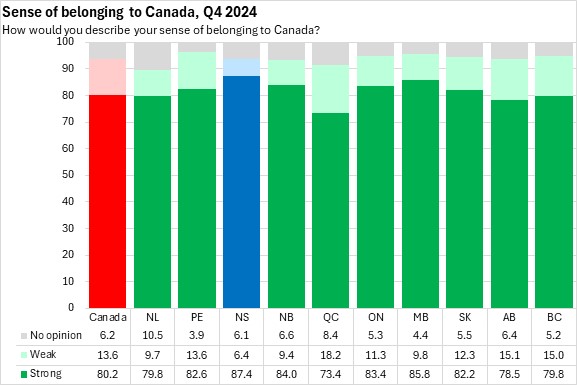
Although measured infrequently, Nova Scotians' sense of belonging to Canada has increased since it was last assessed in Q4 2022.
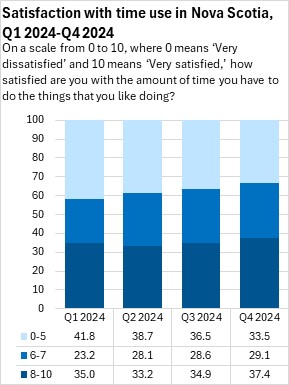
Satisfaction with Time Use
In Nova Scotia, 33.5% of respondents reported low satisfaction with time use (0-5). This was below the national average of 36.3%. Low satisfaction with time use was more prevalent in Ontario, Alberta and British Columbia.
37.4% of Nova Scotians reported the highest levels of satisfaction with time use, which was very similar to the national average (37.3%). Respondents in New Brunswick and Québec reported the highest satisfaction with time use.
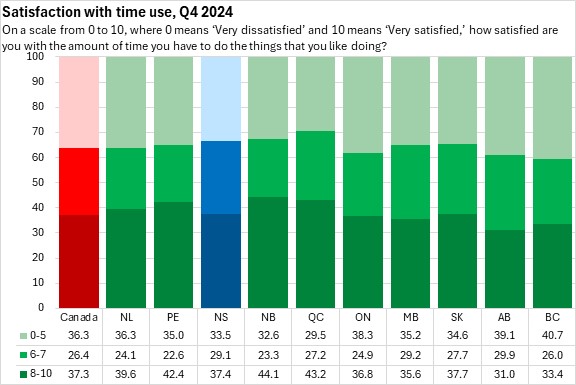
Although infrequently measured, satisfaction with time use appears to be improving in Nova Scotia.
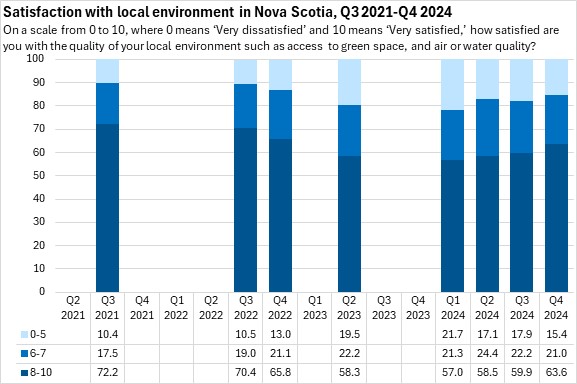
Satisfaction with local environment
In Nova Scotia, 63.6% of respondents reported the highest levels of satisfaction with the local environment - above the national average of 60.2%. High satisfaction with the local environment was notably more prevalent in Prince Edward Island while it was least prevalent in Alberta and Ontario.
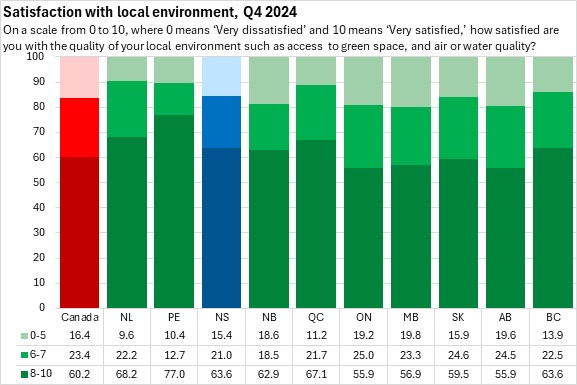
Satisfaction with the local environment has improved since Q1 2024.
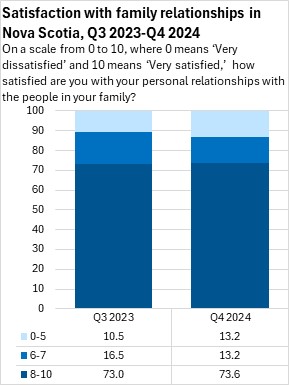
Satisfaction with family relationships
In Nova Scotia 73.6% of respondents reported the highest levels of satisfaction with their family relationships. This was below the national average of 75.0% of Canadians who had the highest satisfaction with their family relationships. Newfoundland and Labrador residents reported the highest levels of satisfaction with family relationships while those in Alberta and British Columbia (followed by Nova Scotia) were least likely to report high satisfaction with family relationships.
13.2% of Nova Scotians reported the lowest levels of satisfaction with family relationships (0-5), which was the highest prevalence among provinces. Across Canada, 10.1% of respondents had low satisfaction with family relationships. This was least prevalent in Québec.
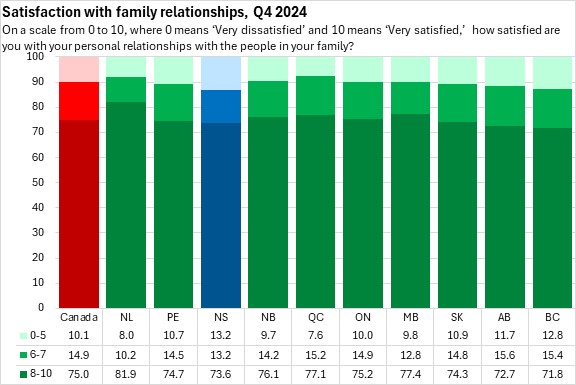
Although infrequently assessed, satisfaction with family relationships has become more polarized with a rising share reporting the highest levels of satisfaction along with a rising share reporting the lowest levels of satisfaction.
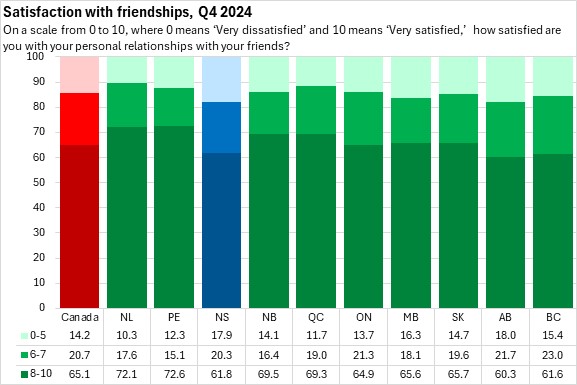
Satisfaction with friendships
In Nova Scotia, 61.8% of respondents reported the highest levels of satisfaction (8-10) in their relationships with friends. Only Alberta and British Columbia residents reported lower prevalence. Nationally 65.1% of Canadians had the highest levels of satisfaction in their relationships with friends (highest prevalence: Newfoundland and Labrador and Prince Edward Island).
17.9% of Nova Scotians reported the lowest levels of satisfaction (0-5) in their relationships with friends, the second highest prevalence after Alberta. Nationally, 14.2% of Canadians reported lower levels of satisfaction with their friendships, with the lowest share in Newfoundland and Labrador.
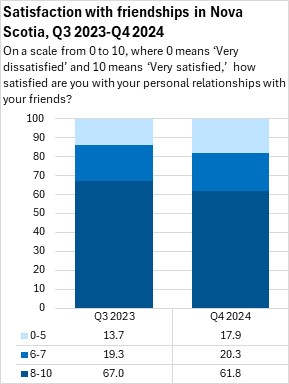
Although infrequently measured, there has been a marked deterioration in Nova Scotians' satisfaction in relationship with friends since Q3 2023.
Confidence in Institutions
Confidence in institutions is measured on a scale from 1 to 5.
Canadians generally reported higher levels of confidence in the police with somewhat lower levels of confidence for the justice/courts and school systems. Strong levels of confidence in the Federal Parliament and Canada's media were even less prevalent.
In Nova Scotia 62.0% of the population had the highest levels of confidence in the police, which was somewhat below the national average of 63.4%. Respondents in British Columbia were least likely to report high levels of confidence in police while those in Québec had the highest levels of confidence in police.
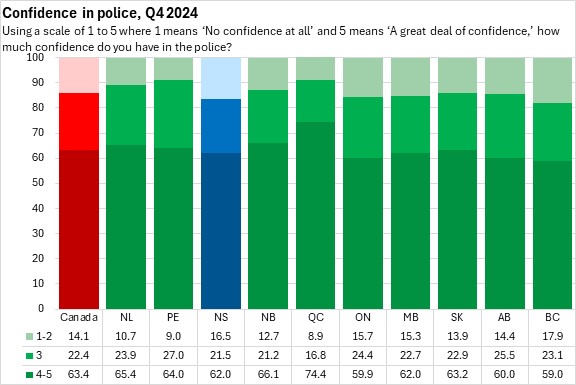
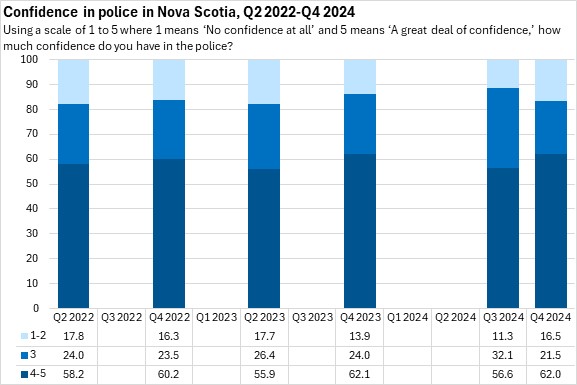
In the most recent results, there has been a polarization of Nova Scotians' satisfaction with police - share for both the highest and lowest levels of satisfaction have risen.
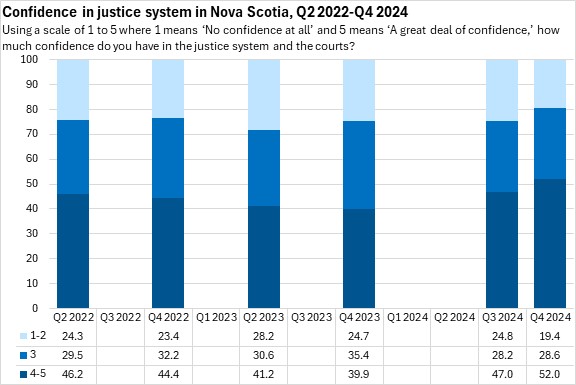
In Nova Scotia, 52.0% of respondents expressed the highest levels of confidence in the justice system, which exceeded the national share (48.2%). British Columbia and Newfoundland and Labrador residents were less likely to express high confidence in justice and the courts. Residents of Québec had the highest levels of confidence in the justice system.
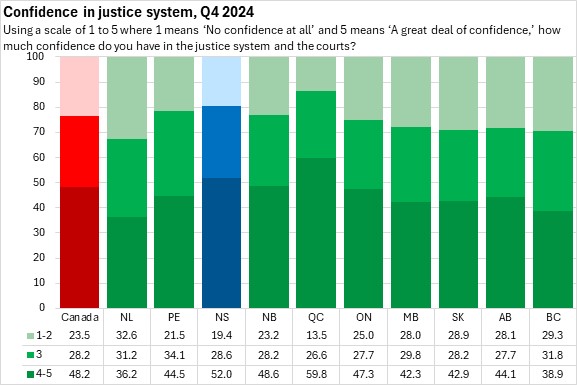
Nova Scotians' confidence in justice and the courts had been declining, but then started to improve through 2024.
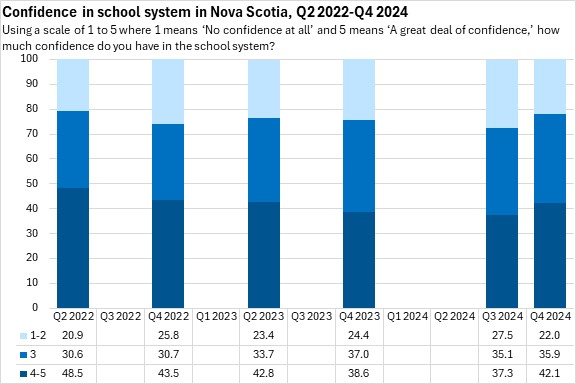
42.1% of Nova Scotians reported strong confidence in the school system, which was below the national average (45.0%). Residents in Québec and Prince Edward Island reported higher levels of confidence in their school systems. Residents of New Brunswick and Alberta had the lowest levels of confidence in the school system.
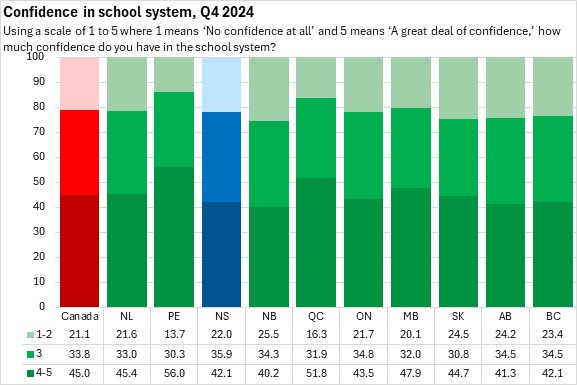
Nova Scotians' confidence in schools had been declining, but improved in Q4 2024.
23.1% of Nova Scotians report high confidence in Canada's Federal Parliament, which was below the national average (28.3%). Residents in Newfoundland and Labrador, Saskatchewan and Alberta reported wider prevalence of low confidence in Canada's Federal Parliament. Residents of Québec had the highest confidence in Canada's Federal Parliament.
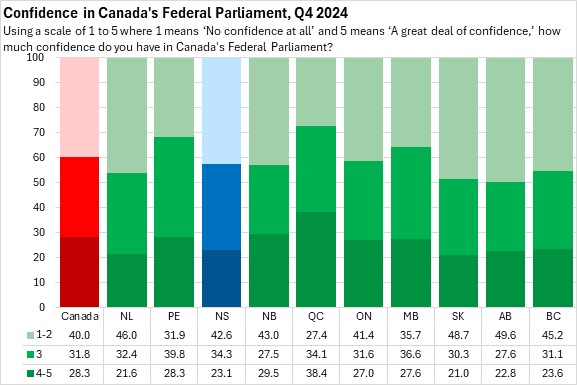
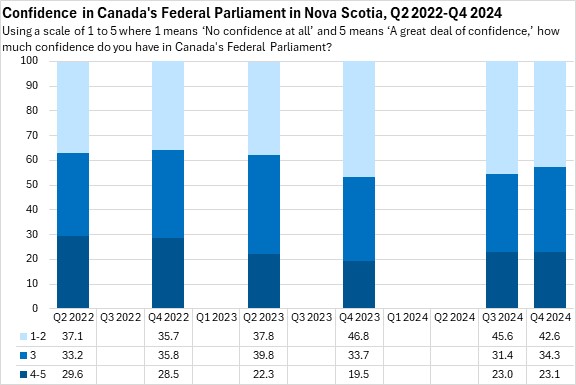
Nova Scotians' confidence in Federal Parliament has been falling, though some improvement was reported through 2024.
39.0% of Nova Scotians expressed the highest levels of confidence in Canadian media, which was above the national average (36.2%). Respondents in Alberta reported the least prevalence of high confidence in Canadian media. Respondents in Québec expressed higher confidence in Canadian media.
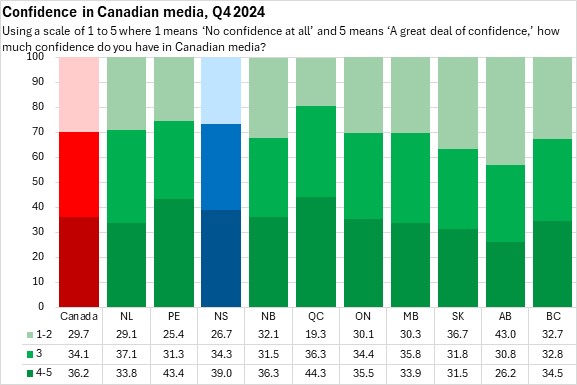
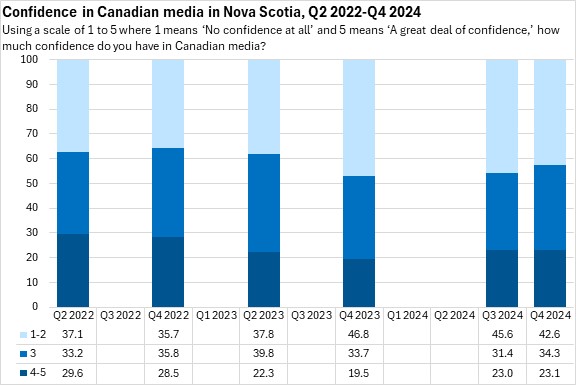
Nova Scotians' confidence in Canadian media has been deteriorating, though there were small improvements in 2024.
Trust in people
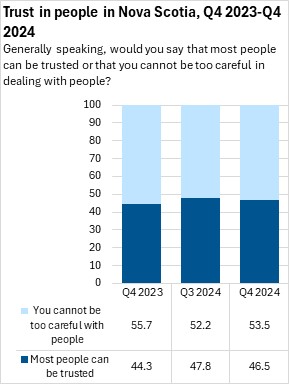
46.5% Nova Scotians were most likely to report trusting most people, which was above the national average of 43.5% (highest: Prince Edward Island). Respondents in Québec were most likely to report that you cannot be too careful with people.
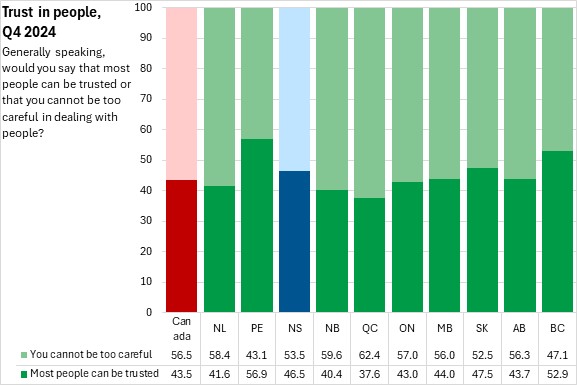
Although infrequently measured, Nova Scotians' trust in other people improved in 2024.
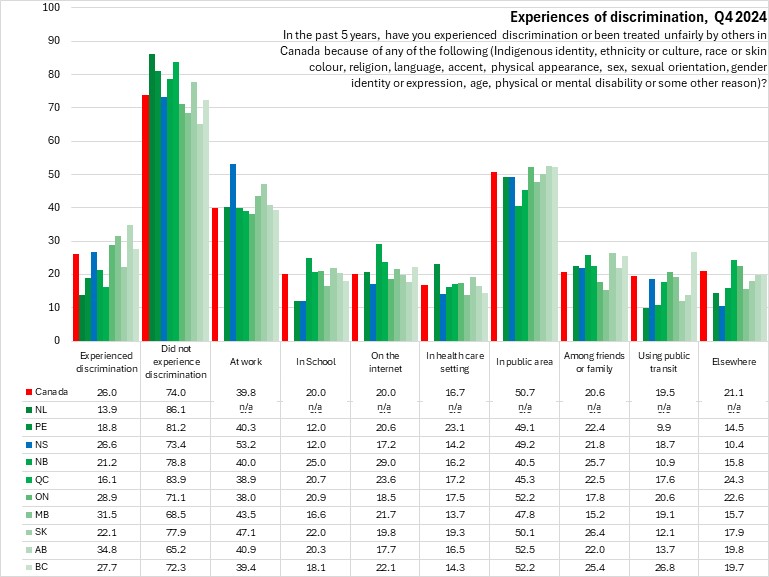
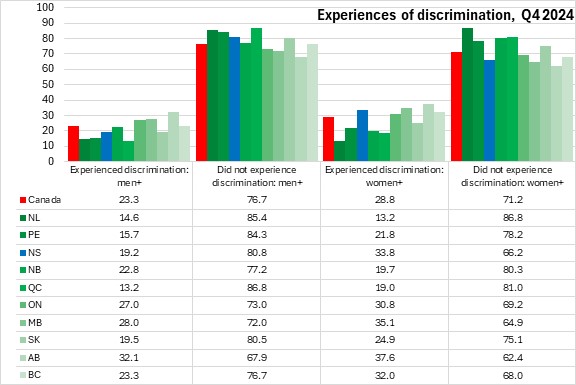
Discrimination
In Nova Scotia, 26.6% of respondents reported experiences of discrimination or unfair treatment while 73.4% of the population did not report these experiences. Across Canada, 26.0% of the population reported discrimination or unfair treatment, with higher prevalence in Ontario, Manitoba and Alberta.
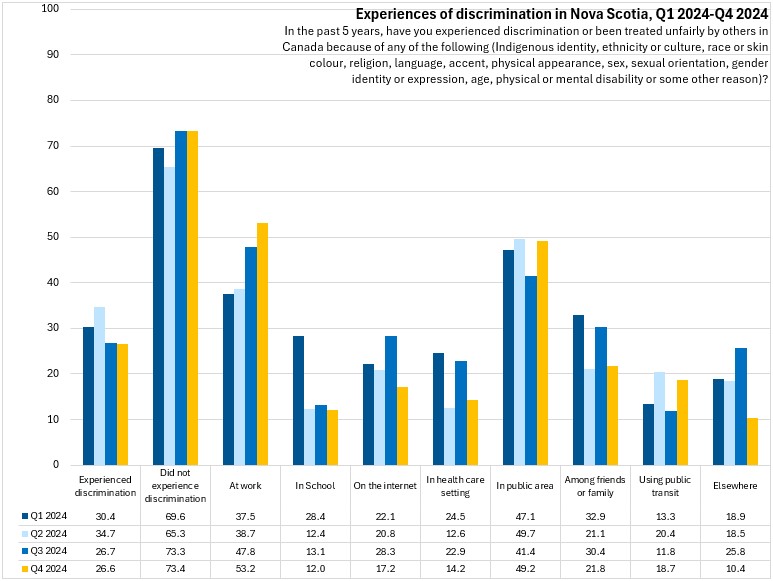
Among those that reported experiences of discrimination in Nova Scotia, the most common contexts were in workplaces or in public/retail spaces. Nova Scotians were the most likely to report experiences of discrimination in the workplace.
Although there is limited data, Nova Scotians' experiences of discrimination in school appear to have declined substantially as a whole though discrimination in workplace settings has been rising.
Across Canada, women were notably more likely to report experiencing discrimination or unfair treatment than were men.
Source: Statistics Canada. Table 13-10-0843-01 Life satisfaction by gender and province; Table 13-10-0845-01 Sense of meaning and purpose by gender and province; Table 13-10-0847-01 Future outlook by gender and province; Table 45-10-0048-01 Loneliness by gender and province; Table 45-10-0050-01 Having someone to count on by gender and province; Table 45-10-0052-01 Sense of belonging to local community by gender and province; Table 45-10-0067-01 Satisfaction with time use, by gender and province; Table 45-10-0069-01 Satisfaction with local environment, by gender and province; Table 45-10-0073-01 Confidence in institutions, by gender and province; Table 45-10-0098-01 General trust in people by gender and province; Table 45-10-0100-01 Discrimination and unfair treatment by gender and province; Table 45-10-0092-01 Satisfaction with friend relationships by gender and province; Table 45-10-0090-01 Satisfaction with family relationships by gender and province; Table 45-10-0077-01 Sense of belonging to Canada, by gender and province
<--- Return to Archive