The Economics and Statistics Division maintains archives of previous publications for accountability purposes, but makes no updates to keep these documents current with the latest data revisions from Statistics Canada. As a result, information in older documents may not be accurate. Please exercise caution when referring to older documents. For the latest information and historical data, please contact the individual listed to the right.
<--- Return to Archive
For additional information relating to this article, please contact:
February 25, 2025FOOD SERVICES AND DRINKING PLACES, DECEMBER AND ANNUAL 2024 Monthly (December 2024 vs November 2024, seasonally adjusted)
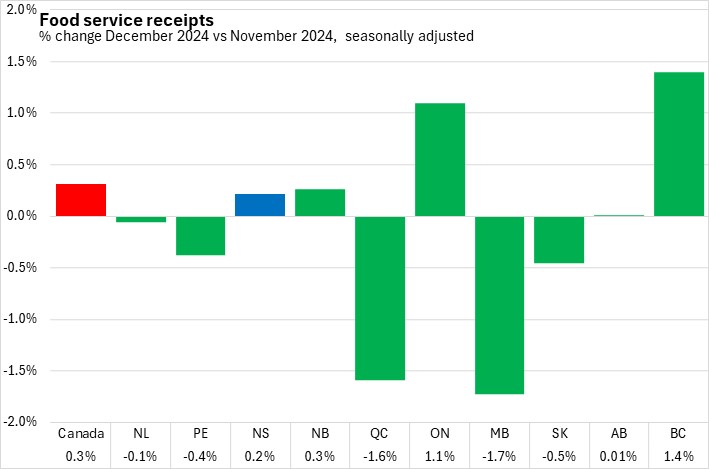
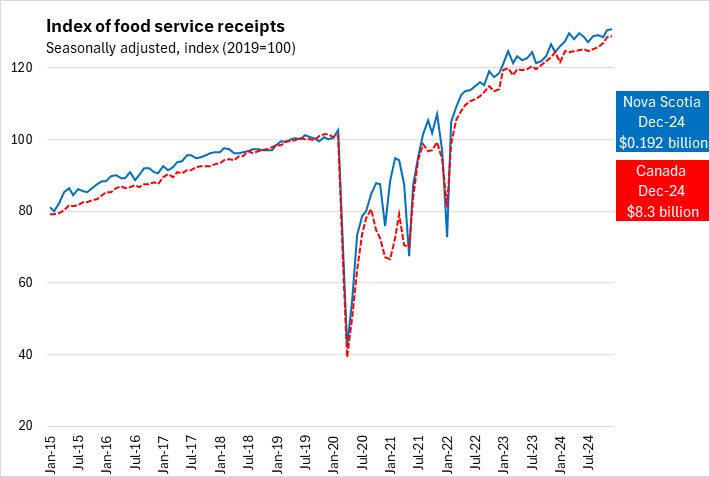
Nova Scotia food services and drinking places receipts increased 0.2% to $192.0 million. Canada's food services and drinking places receipts increased by 0.3% to $8.3 billion. Across Canada, five provinces reported higher receipts for food services and drinking places, led by British Columbia. Manitoba reported the largest decline.
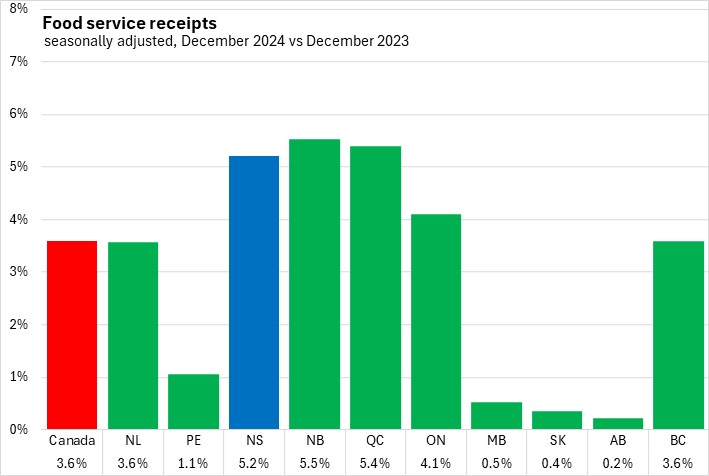
Year-over-year (December 2024 vs December 2023)
Nova Scotia food services and drinking places receipts increased 5.2% year-over-year. Canada's food services and drinking places receipts increased 3.6%. There were year-over-year gains in all provinces led by New Brunswick, Quebec and Nova Scotia.
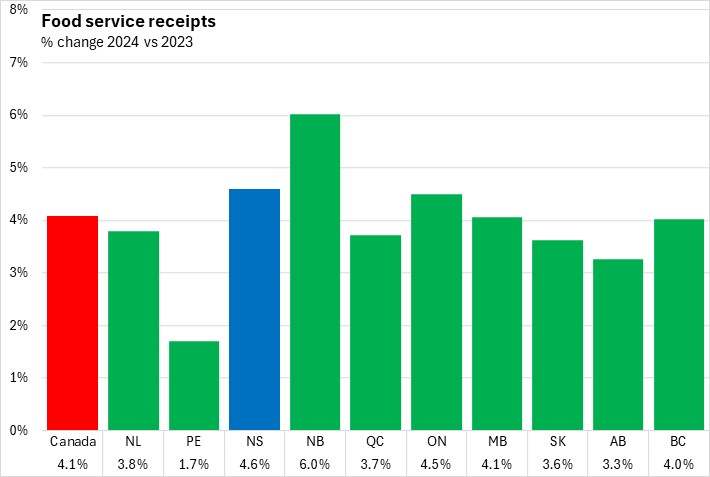
Annual (2024 vs 2023)
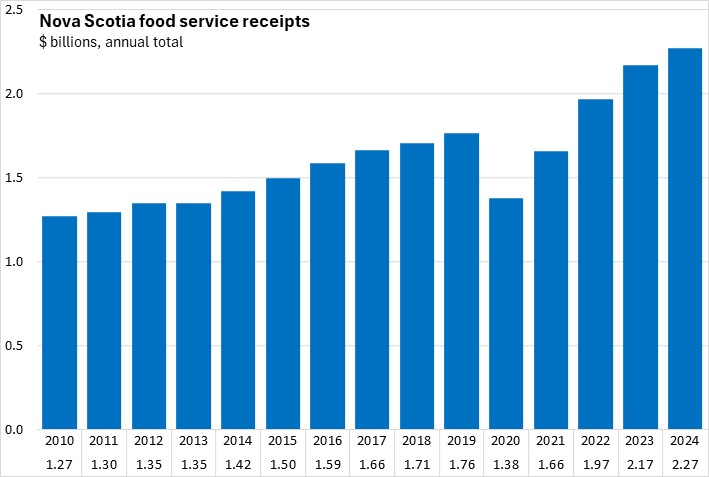
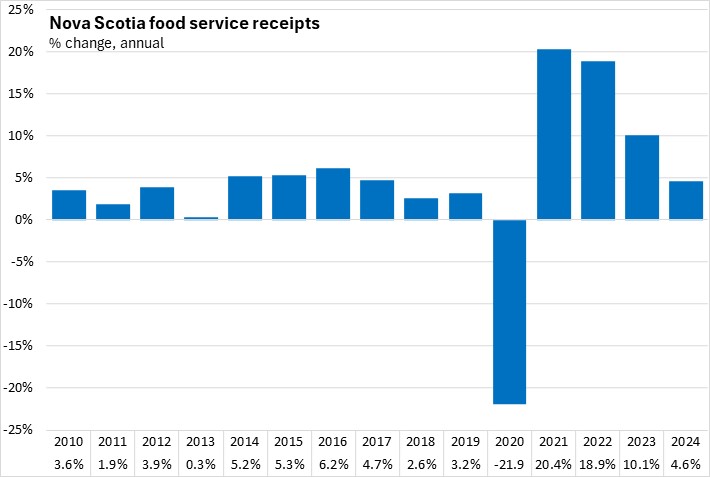
Nova Scotia's annual food services and drinking places receipts increased 4.6%. Nationally food services and drinking places receipts increased 4.1%. All provinces reported an annual increase in receipts. New Brunswick reported the fastest percentage gain in annual food service receipts while Prince Edward Island had the slowest increase.
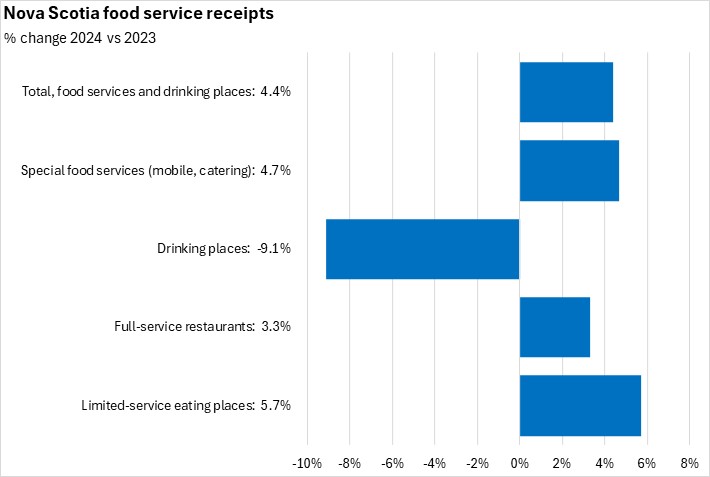
Nova Scotia's annual gains in food service receipts are attributable to the increases in limited service eating places, though there were smaller increases at full-service restaurants and specialty food service providers (such as mobile and catering). Nova Scotia drinking places reported lower annual receipts compared to the same period last year.

Trends
Nova Scotia's food service receipts exhibit more volatility than national food service receipts, but in recent months Nova Scotia's receipts have grown faster than the national trend.
Nova Scotia's annual food services and drinking places receipts increased 4.6% to $2.27 billion.
Source: Statistics Canada. Table 21-10-0019-01 Monthly survey of food services and drinking places (x 1,000)
<--- Return to Archive