The Economics and Statistics Division maintains archives of previous publications for accountability purposes, but makes no updates to keep these documents current with the latest data revisions from Statistics Canada. As a result, information in older documents may not be accurate. Please exercise caution when referring to older documents. For the latest information and historical data, please contact the individual listed to the right.
<--- Return to Archive
For additional information relating to this article, please contact:
March 03, 2025INTERPROVINCIAL TRADE, 2023 From June to October 2024, Statistics Canada surveyed business establishments with 5 or more employees and $50,000 or more in revenue across 12 broad industry categories, asking about their interprovincial trade activities in the previous 12 months (2023).
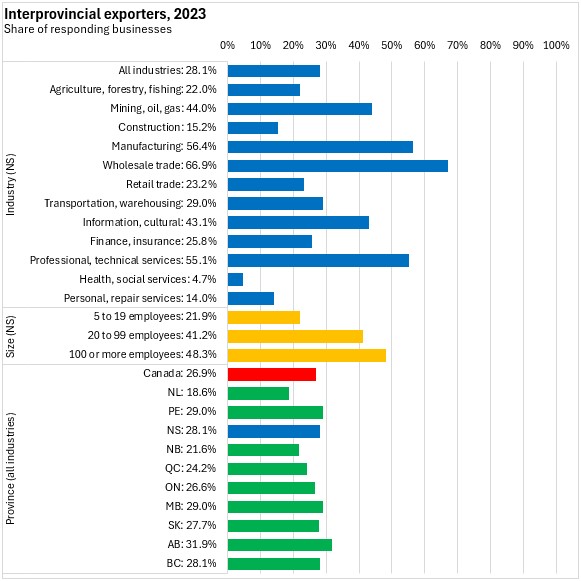
In Nova Scotia, 28.1% of businesses reported interprovincial export sales. This was above the national average of 26.9% of respondent businesses. Interprovincial exports were most common among Alberta businesses and least common among businesses in Newfoundland and Labrador.
In Nova Scotia, wholesale trade, manufacturing, professional/technical services and mining reported the highest prevalence of interprovincial exporters. Nova Scotia businesses in health/social services and construction were notably less likely to be exporters. Larger employers in Nova Scotia were also more likely to be interprovincial exporters.
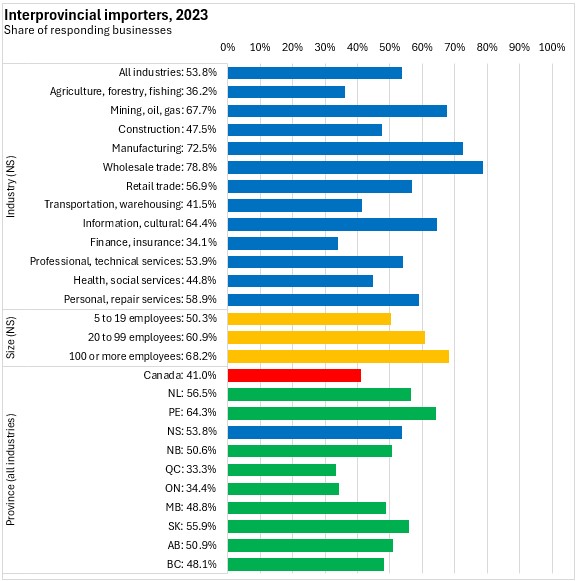
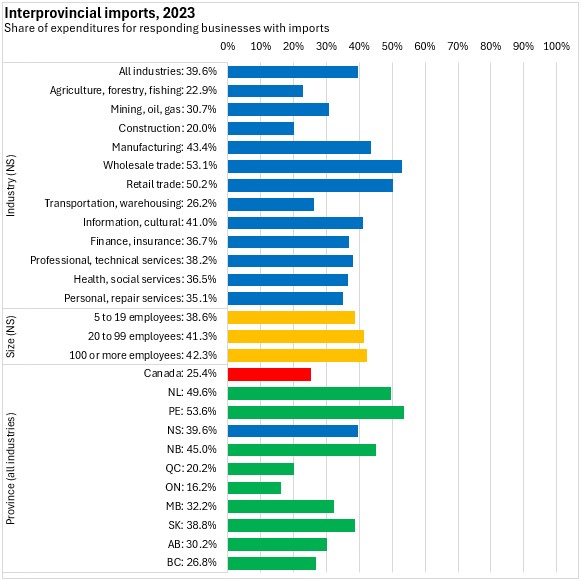
Nova Scotia's businesses were substantially more likely to be importers of supplies from other provinces with 53.8% reporting inputs purchased from another province. Across Canada, 41.0% of businesses reported inputs purchased from another province with notably lower interprovincial imports to Canada's two largest provinces: Ontario and Québec. Interprovincial imports were more prevalent among businesses in Newfoundland and Labrador, Prince Edward Island and Saskatchewan.
Among Nova Scotia businesses, wholesalers were the most prolific interprovincial importers, followed by manufacturers, miners and those in information/cultural industries. Nova Scotia businesses in finance/insurance and agriculture/forestry/fishing were less likely to report inputs imported from another province or territory. Larger employers in Nova Scotia were also more likely to be interprovincial importers.
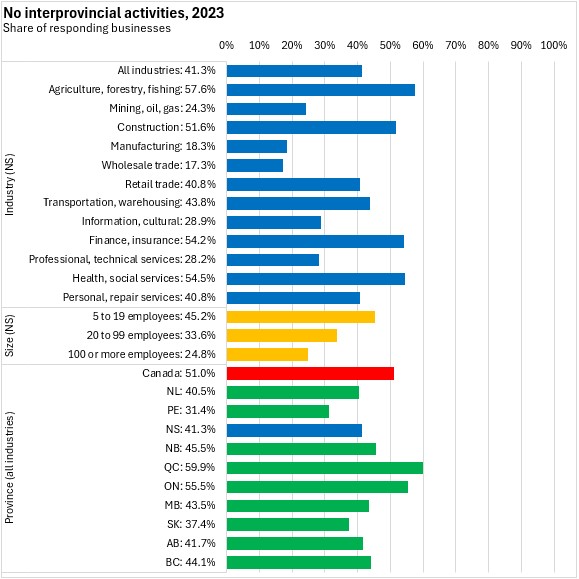
There were no interprovincial activities reported from 41.3% of Nova Scotia businesses. This was lower than the national portion of 51.0%, which reflects much higher portions of businesses in Ontario and Québec.
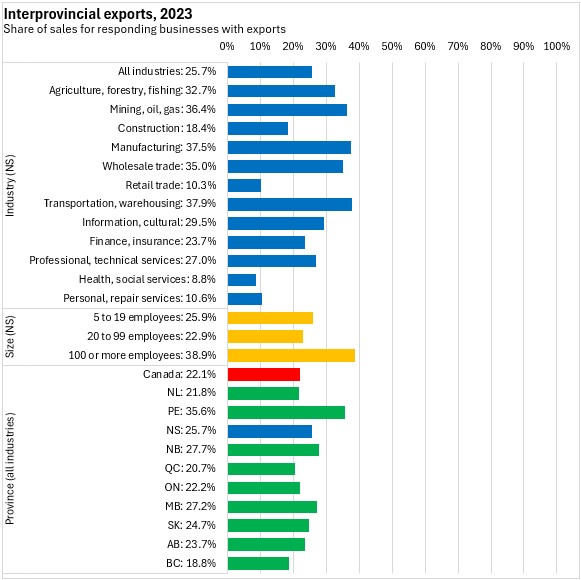
Among those businesses that reported interprovincial exports from Nova Scotia, these exports accounted for 25.7% of sales. Canada's interprovincial exporters reported 22.1% of sales were to other provinces or territories. Prince Edward Island's interprovincial exporters had the highest reliance on sales to other provinces while those in British Columbia and Québec reported lower reliance on interprovincial export sales.
Interprovincial export sales from Nova Scotia were most important for transportation/warehousing, wholesale trade, manufacturing, mining and agriculture/forestry/fishing businesses. Interprovincial exports were less important for businesses in retail trade, health/social services and personal/repair services.
Nova Scotia's interprovincial importers reported that 39.6% of their expenditures were for products sourced in another province or territory. Wholesale and retail trade as well as manufacturing reported the highest reliance on inputs from other provinces/territories.
Across Canada, only 25.4% of interprovincial importers' purchases came from another province or territory. This was notably lower for responding businesses in Ontario and Québec.
Obstacles to interprovincial trade
Businesses that reported making interprovincial exports were asked about the obstacles that they perceived in interprovincial trade.
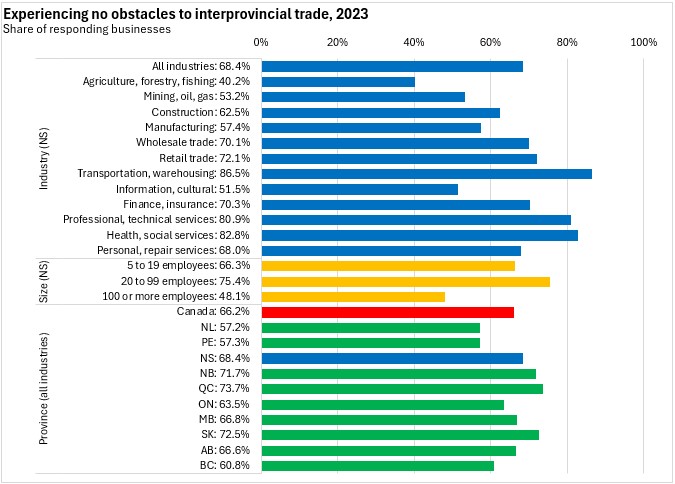
Over two-thirds of Nova Scotia businesses with interprovincial exports (68.4%) reported no obstacles when selling goods to other provinces or territories. Those in transportation/warehousing, health/social services and professional/technical services were more likely to report no interprovincial export barriers in 2023. Businesses in agriculture/forestry/fishing, information/culture and mining were more likely to report some obstacles to interprovincial exports. Smaller and medium-sized employers reported a lower incidence of interprovincial export barriers.
Across Canada, just under two-thirds (66.2%) of interprovincial export businesses reported no obstacles to interprovincial exports. Québec businesses reported the least perceived obstacles to interprovincial trade while exporting businesses in Newfoundland and Labrador and Prince Edward Island reported more obstacles to interprovincial exports.
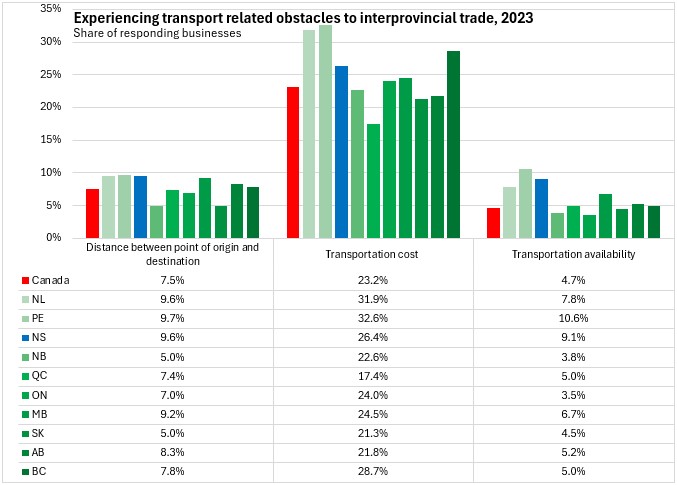
When asked about specific obstacles to interprovincial trade, the most commonly-reported obstacles were in transportation - distance, cost and availability. Transportations problems were more prevalent among Canada's three eastern-most provinces: Newfoundland and Labrador, Prince Edward Island and Nova Scotia. British Columbia interprovincial exporters also reported more obstacles associated with transportation costs.
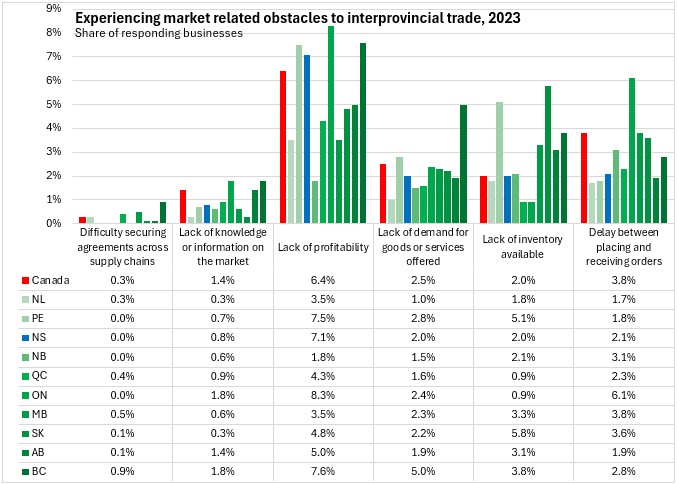
Market conditions were the next largest source of interprovincial export obstacles, notably concerns about profitability.
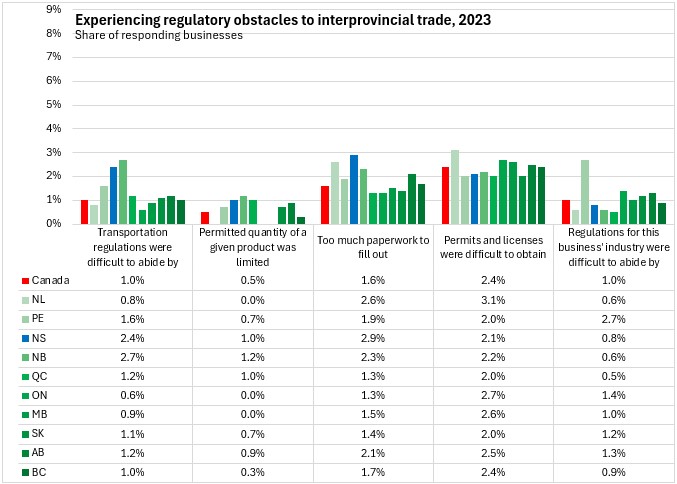
Regulatory barriers were less commonly cited than transportation or market conditions, though transportation regulations and paperwork burdens were notably more widely cited as interprovincial trade barriers in Nova Scotia.
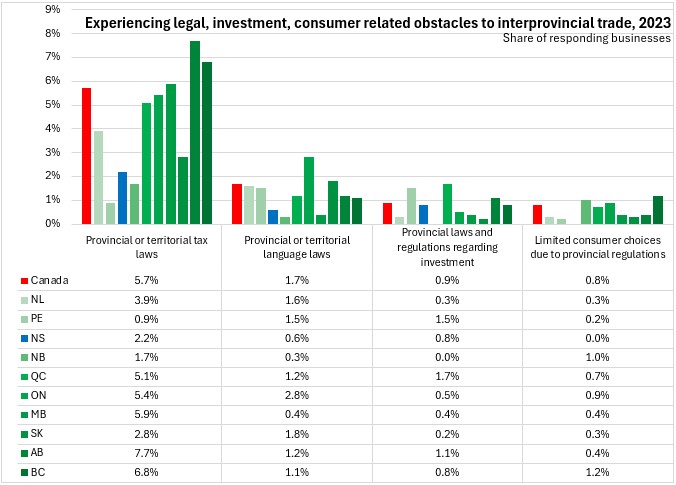
Tax laws were notably more commonly cited interprovincial trade barriers in central and western provinces (except Saskatchewan). Tax laws were notably less commonly cited as interprovincial export obstacles in the Maritimes.
Source: Statistics Canada. Table 33-10-0941-01 Businesses' interprovincial trade activities conducted within Canada over the last 12 months; Table 33-10-0942-01 Percentage of businesses' total purchases of goods or services from suppliers within another province or territory over last 12 months; Table 33-10-0946-01 Percentage of businesses' total sales of goods or services sold to customers located within another province or territory over the last 12 months; Table 33-10-0948-01 Obstacles experienced by businesses when selling goods or services to customers located within another province or territory over last 12 months
<--- Return to Archive