The Economics and Statistics Division maintains archives of previous publications for accountability purposes, but makes no updates to keep these documents current with the latest data revisions from Statistics Canada. As a result, information in older documents may not be accurate. Please exercise caution when referring to older documents. For the latest information and historical data, please contact the individual listed to the right.
<--- Return to Archive
For additional information relating to this article, please contact:
September 10, 2025LIFE SATISFACTION AND QUALITY OF LIFE, Q2 2025 Statistics Canada has updated some of its indicators about how Canadians perceive their quality of life, focusing on life satisfaction, sense of belonging to community, future outlook and satisfaction with local environment. This information is collected as part of the Canadian Social Survey, conducted from April-June 2025. National data does not include any results from the Territories. Results are stated as the share of the population reporting. Not all indicators of quality of life were surveyed in each period.
Life satisfaction
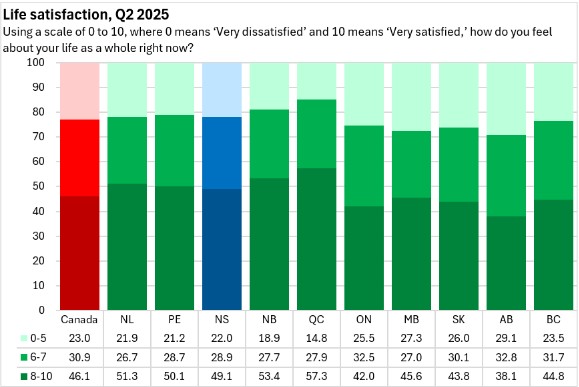
In Nova Scotia, 49.1% of respondents rated their life satisfaction in the most satisfied categories (8-10) while 28.9% rated their life satisfaction at moderate levels (6-7) and 22.0% responded with the least satisfied categories (0-5).
Across Canada, 46.1% of the respondents were in the most satisfied categories while 23.0% were in the least satisfied categories. High life satisfaction (8-10) was most prevalent in Québec, followed by the Atlantic provinces. Life satisfaction was notably lower for Ontario and the four westernmost provinces, with Alberta reporting the highest portion responses in the lowest life satisfaction categories (0-5).
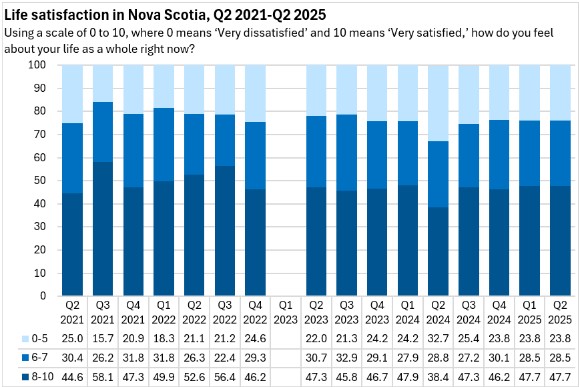
In Nova Scotia, life satisfaction has been trending down in recent years. There was a notable deterioration in reported life satisfaction in Q2 2024, but this has recovered partially in the last four quarters.
Sense of Meaning and Purpose
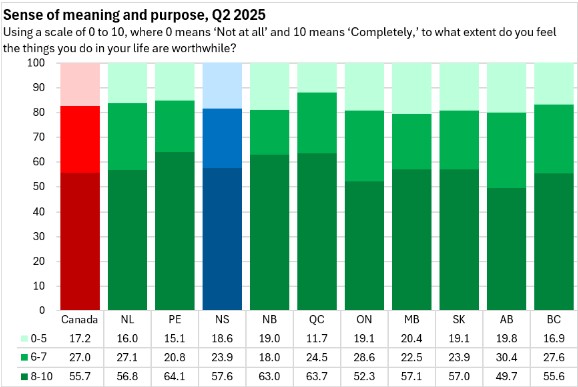
In Nova Scotia, 57.6% of respondents replied in the three strongest categories (8-10) for sense of meaning and purpose. Across Canada, 55.7% reported the strongest sense of meaning and purpose. The lowest share of respondents in these categories were in Alberta.
18.6% of Nova Scotians responded that their sense of meaning and purpose in the things they do in life were in the lowest categories (0-5). The national average response in the lowest categories was 17.2% with weak sense of meaning and purpose most prevalent in Manitoba and Alberta (least prevalent in Québec).
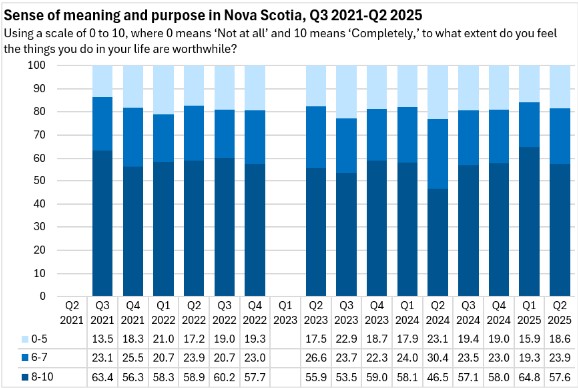
In Nova Scotia, sense of meaning and purpose improved from Q2 2024 to Q1 2025, but has eroded in the last quarter's results.
Hopeful Outlook for the Future
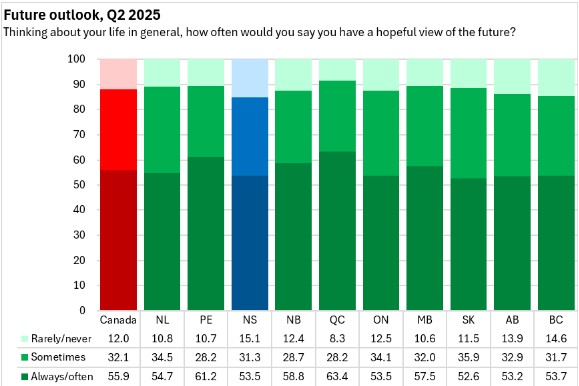
53.5% of Nova Scotians reported feeling hopeful about the future always or often while 15.1% of Nova Scotians rarely or never felt hopeful about the future. Nova Scotia reported the largest portion of respondents that rarely or never felt hopeful about the future.
Nationally, 55.9% of Canadians always or often felt hopeful about the future while 12.0% rarely or never felt hopeful about the future. Respondents in Québec were most likely to report always having a hopeful outlook for the future.
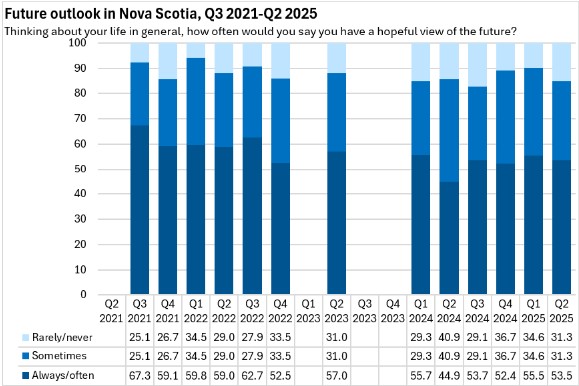
The prevalence of a hopeful outlook in Nova Scotia has eroded in recent years. Although there were improvements from Q2 2024 to Q1 2025, the latest results are closer to those observed in Q3 2024.
Satisfaction with local environment
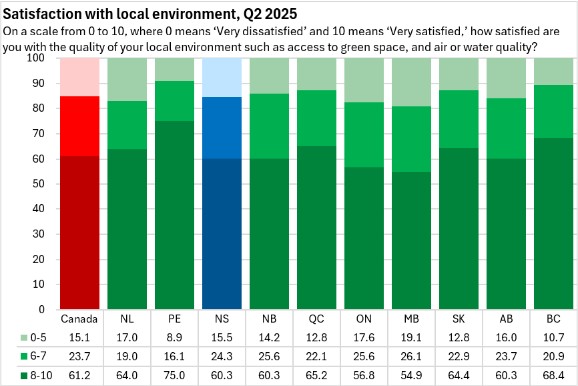
In Nova Scotia, 60.3% of respondents reported the highest levels of satisfaction with the local environment - below the national average of 61.2%. High satisfaction with the local environment was notably more prevalent in Prince Edward Island while it was least prevalent in Manitoba and Ontario.
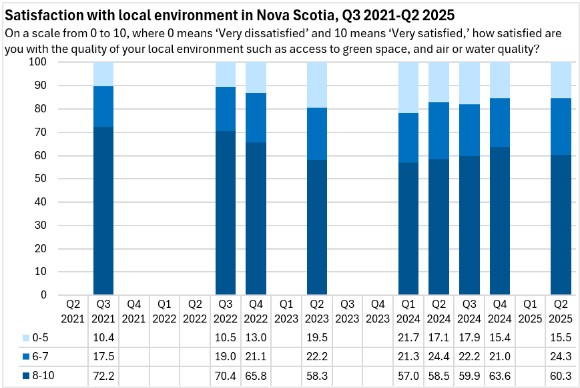
Satisfaction with the local environment has improved since Q1 2024.
Source: Statistics Canada. Table 13-10-0843-01 Life satisfaction by gender and province; Table 13-10-0845-01 Sense of meaning and purpose by gender and province; Table 13-10-0847-01 Future outlook by gender and province; Table 45-10-0069-01 Satisfaction with local environment, by gender and province
<--- Return to Archive