The Economics and Statistics Division maintains archives of previous publications for accountability purposes, but makes no updates to keep these documents current with the latest data revisions from Statistics Canada. As a result, information in older documents may not be accurate. Please exercise caution when referring to older documents. For the latest information and historical data, please contact the individual listed to the right.
<--- Return to Archive
For additional information relating to this article, please contact:
October 09, 2025HOUSEHOLD WEALTH, Q2 2025 Household Assets, Liabilities and Net Worth
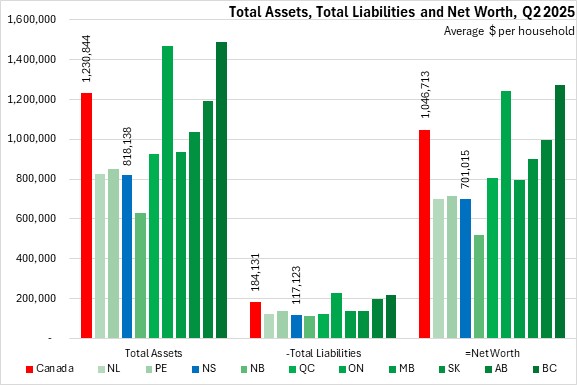
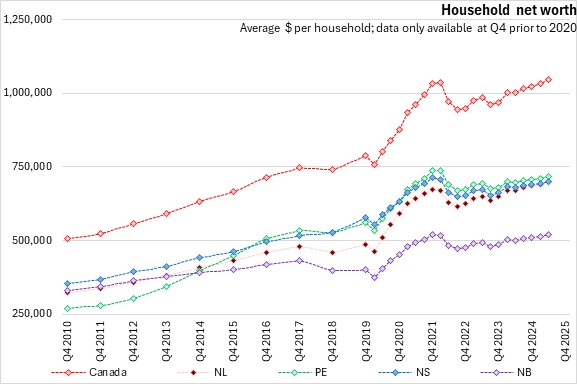
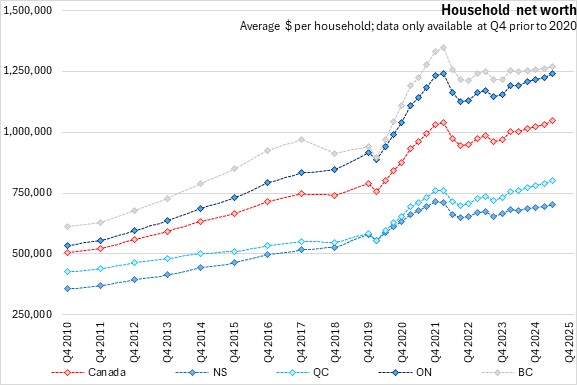
Canada’s average assets were $1,230,844 in Q2 2025. Nova Scotia’s assets were well below the national average at $818,138. Nova Scotia's household liabilities were $117,123 per household. As a result, Nova Scotia's net worth came to $701,015 per household, the second highest among the Atlantic provinces. British Columbia and Ontario had the highest per household wealth among all provinces while New Brunswick had the lowest net worth per household.
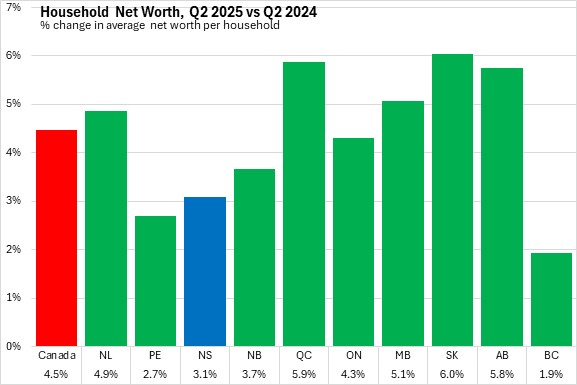
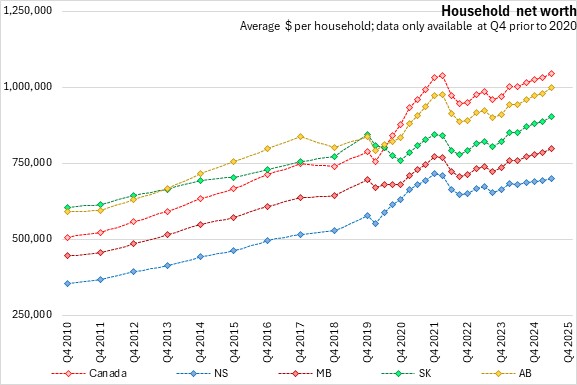
Nova Scotia's net worth increased by 3.1% from Q2 2024 to Q2 2025, slower than the national average (+4.5%). All provinces reported gains over the same quarter the previous year. Québec, Saskatchewan and Alberta reported the fastest gains in net worth. British Columbia reported the slowest gain.
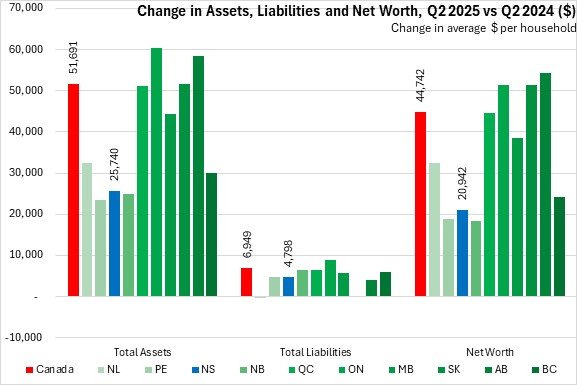
Compared to Q2 2024, national assets per household increased by $51,691 while liabilities increased by $6,949, bringing national net worth up by $44,742. Nova Scotia’s assets increased by $25,740 per household while liabilities grew by $4,798 from Q2 2024 to Q2 2025, increasing Nova Scotia's net worth per household by $20,942.
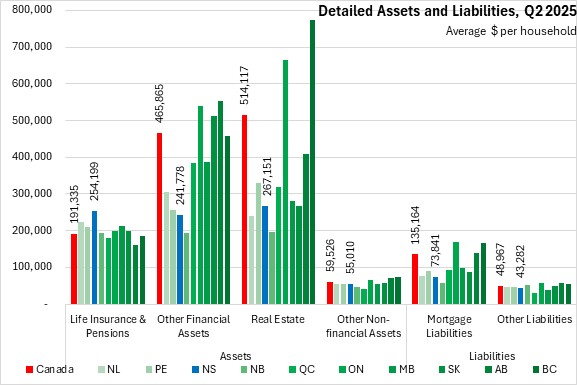
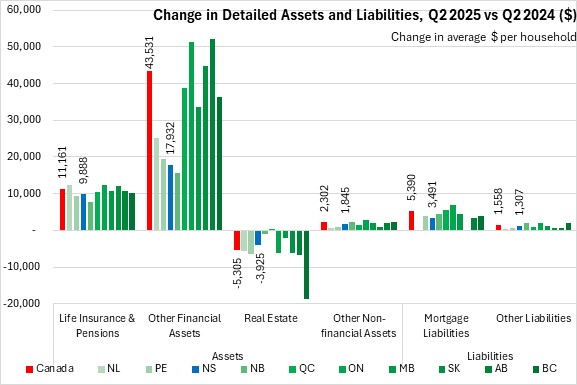
In detailed assets and liabilities Nova Scotians continued to have the highest life insurance and pension assets per household. British Columbia and Ontario had real estate assets far above the national average of $514,117.
The national level for mortgage liabilities in Q2 2025 was $135,164. Nova Scotia mortgage liabilities per household were the second lowest among provinces at $73,841. Other non-mortgage liabilities for Nova Scotia were below national average at $43,282 per household.
Nova Scotia's per household life insurance and pension assets increased by $9,888 from Q2 2024 to Q2 2025. Nova Scotia’s other financial assets increased by $17,932 over this period. National life insurance/pension assets were up $11,161 per household with gains in all provinces (steepest in Newfoundland and Labrador, followed closely by Ontario) while other national financial assets were up by $43,531 per household with gains in all provinces (led by Alberta).
Nova Scotia’s real estate asset values declined by $3,925 per household from Q2 2024 to Q2 2025. Nationally, average real estate assets per household fell by $5,305 per household with declines in all provinces, except Québec, led by British Columbia.
Nova Scotia's mortgage liabilities rose by $3,491. The national average mortgage liability per household increased by $5,390. Nova Scotia's other liabilities increased by $1,307 while the national average over the four quarters increased by $1,558.
Household net worth grew in all provinces from Q1 to Q2 2025.
Source: Statistics Canada. Table 36-10-0661-01 Distributions of household economic accounts, wealth, Canada, regions and provinces, quarterly (x 1,000,000)
<--- Return to Archive